國
立
交
通
大
學
經 營 管 理 研 究 所
碩 士 論 文
生理特徵應用於市場區隔之研究
Physic-Psychodemographics:
Incorporation of Physical Attributes
into Market Segmentation
研 究 生:溫勝裕
指導教授:唐瓔璋 教授
生理特徵應用於市場區隔之研究
Physic-Psychodemographics: Incorporation of Physical
Attributes into Market Segmentation
研 究 生︰溫勝裕
Student︰Sheng-Wu Wen
指導教授︰唐瓔璋
Advisor︰Ying-Chan Tang
國立交通大學
經營管理研究所
碩士論文
A ThesisSubmitted to Institute of Business and Management College of Management
National Chiao Tung University in Partial Fulfillment of the Requirements
for the Degree of
Master of Business Administration
May 2008
Taipei, Taiwan, Republic of China
中華民國 九十七 年 六 月
生理特徵應用於市場區隔之研究
生理特徵應用於市場區隔之研究
生理特徵應用於市場區隔之研究
生理特徵應用於市場區隔之研究
學生:溫勝裕 指導教授:唐瓔璋國立交通大學經營管理研究所碩士班
摘要
自 Smith 將市場區隔的概念帶進行銷的領域中,市場區隔的研究議題在行銷 實務中歷久不衰。行銷人員可以利用眾多區隔變數,如地理區隔、人口統計變數、 生活型態、利益尋求變數、忠誠度、使用頻率等等有意義的變數對於(消費者)市 場予以切割分析。 然而在數十年的相繼研究後,市場區隔的研究臻於成熟,也很難有所突破。 另一方面,生物科技領域學科卻在資訊科技的支撐下突飛猛進,尤其在人類基因 的研究上常有突破性發現。由美國、英國、日本、德國、法國及中國大陸六國科 學家參與的人類基因組計畫 HGP (Human Genome Project),在西元 2000 年公佈 了人類基因組圖譜的排序草圖,此項研究成果的發表將促進更多遺傳疾病、基因 療法和基礎基因研究的發展。 有鑑於生物科技的高度發展,本研究欲引用身體的生理特徵,將之帶進市場 區隔的研究議題當中。首先利用生活型態將消費者予以分類,再利用生理特徵變 數與消費者型態做交叉驗證。另外,本研究亦利用心理、生理及行為三方面分析 比較其不同基礎區隔是否在消費者創新特質上有所差異。 研究結果呈現,以生活型態為基礎分類的消費者型態與生理特徵為基礎分類 的區隔無顯著相關性。然而,有趣的是本研究結果卻約略顯示出,以生活型態為 基礎區隔的消費者型態在生理特徵上有些微的分布差異。另一方面,本研究結果 亦顯示出無論在不同的生活型態集群或是生理特徵區隔,消費者創新特質皆具有 顯著的差異。購買行為在是否購買、購買次數、第一次購買日期、購買金額、購 買產品類別及購買目的上,對消費者創新特質則具有顯著的差異。 本研究初步探索生理特徵在市場區隔的潛在探究性,以及從多方面的角度檢 視消費者創新特質的差異性。而未來的研究除了可以在研究方法上更為精緻化 外,後續的研究也可以繼續針對其他行銷相關議題進行探討,,將探索的領域近 一步拓展。II
Physic-Psychodemographics: Incorporation of Physical Attributes into
Market Segmentation
student:
Sheng-Wu Wen Advisors:Dr. Edwin-TangInstitute of Business and Management
National Chiao Tung University
ABSTRACT
The general approaches of market segmentation have been investigated and developed very often in past decades, and some methods were popular and familiar in practices, such as demographic, psychographic and lifestyle. Though these methods were well-established, there was still enough room to advance for this marketing issue.
Thanks to the achievement of information technology, which release the
possibility to unlock the physical mysteries of human beings. To our point of view, we want to examine if specific physical attribute has the potential capability to be the element of segmentation. Therefore, we followed the traditional segmentation method by lifestyle first; however, the primary objective of this research was to explore the possible implication of physical attribute, so this research would investigate the correlation between lifestyle-based typology and physical attribute based classification.
In addition to above investigation, consumer innovativeness was another issue this research interested. Though innovativeness was always an important topic, we found that previous literatures focused on the dispute of concept and measurement most of the time. To provide a comprehensive outlook, we tried to obtain and compare consumer innovativeness from three different aspects: lifestyle, buying behavior, and physical attribute.
The results showed that there was no significant difference between lifestyle based typology and physical attribute based classification. However, we suggested further analysis of relationship due to the specific distribution of physical attribute on each typology. In addition, this research also demonstrated that consumer
innovativeness was significant difference on lifestyle based typology, physical
attribute classification, and some part of DC buying behavior. Therefore, future study could expand this topic by concentrating on other marketing issue, and try to refine the research methods.
Table of contents
Chinese abstract………..………..Ⅰ English abstract………..………..Ⅱ Table of Content………...Ⅲ List of Figures and Tables………..………..……Ⅵ
Chapter1. INTRODUCTION
1.1 Research Background and Motives………...1
1.2 Research Objectives……….………..5
Chapter2. LITERRATURE REVIEW 2.1 Market Segmentation 2.1.1 Segmentation definition……….6 2.1.2 Segmentation Bases………...7 2.1.3 Segmentation methods……….10 2.2 Lifestyle 2.2.1 Psychology aspect………12 2.2.2 Sociology aspect………...13 2.2.3 Marketing aspect………..13 2.2.4 Measurement………14 2.3 Physical Attribute 2.3.1 Dermatoglyphics………...……...16 2.4 Consumer Innovativeness 2.4.1 Innovativeness definition……….18 2.4.2 Measurement………19
IV
Chapter3. RESEARCH METHODOLOGY
3.1 Research Framework………..24
3.2 Questionnaire Generation 3.2.1 Questionnaire design………25
3.2.2 Pretest………...31
3.3 Obtainment of Physical attribute of objects………...32
3.4 Research Process………32
3.5 Statistic Methods………33
Chapter4. DATA ANALYSIS AND RESULTS 4.1 Descriptive Statistics………..35
4.2 Reliability and Validity………...37
4.3 Consumer Typology 4.3.1 Factor analysis………..39
4.3.2 Cluster analysis………44
4.4 Proposition test 4.4.1 Description of cluster………...47
4.4.2 Relationship of physical-attribute classification with cluster identity…….49
4.5 Consumer innovativeness on lifestyle based, physical attribute based, and DC buying behavior 4.5.1 Consumer innovativeness on lifestyle based typology………51
4.5.2 Consumer innovativeness on physical attribute based classification……...52
Chapter5. Conclusion and Suggestion
5.1 Conclusion………..56
5.2 Limitations………..57
5.3 Suggestion for Future Research………..57
Reference
………..59VI
List of Figures and Tables
Figure
Figure 1-1 Market capitalization of biotechnology industry………2
Figure 2-1 Classifications of Segmentation Bases………9
Figure 2-2 Classifications of Segmentation Methods………..11
Figure 3-1 Research Framework………..24
Figure 3-2 Research Process………32
Table
Table 3-1 DC buying behavior items………...26Table 3-2 Domain-Specific Innovativeness scale items………..28
Table 3-3 Demographic items………..29
Table 4-1 Demographic profile of respondents ………...35
Table 4-2 Cronbach coefficient alpha …..………...38
Table 4-3 DSI scale convergent validity table……….38
Table 4-4 Eigenvalue table of factor analysis .………40
Table 4-5 Factors included in Factor1………..40
Table 4-6 Factors included in Factor2………..41
Table 4-7 Factors included in Factor3………..41
Table 4-8 Factors included in Factor4………..42
Table 4-9 Factors included in Factor5………..42
Table 4-10 Factors included in Factor6………43
Table 4-11 Factors included in Factor7………43
Table 4-12 Factors included in Factor8………44
Table 4-14 Clustering statistics compare table……….45
Table 4-15 Factor means of clusters ...……….45
Table 4-16 Cluster profile based on demographic characteristics………47
Table 4-17 Relationship of physical attribute (TFRC) with clusters ...………..50
Table 4-18 Consumer innovativeness on lifestyle based clusters………51
Table 4-19 Scheffe multiple comparisons (lifestyle typology)………52
Table 4-20 Consumer innovativeness on physical attribute based segments………...52
Table 4-21 Scheffe multiple comparisons (TFRC classification)………53
Table 4-22 Consumer innovativeness on DC buying behavior………53
Table 4-23 Scheffe multiple comparisons (Have you ever bought any DC?)………..54
Table 4-24 Scheffe multiple comparisons (How many DCs have you ever owned?)..54
Table 4-25 Scheffe multiple comparisons (When did you buy your first DC?)……...55
Table 4-26 Scheffe multiple comparisons(How much money did your latest DC cost?) ………55
1
Chapter1 Introduction
1.1
Research Background and Motives
Though the general approach of segmentation was developed and significantly
elaborated a few decades ago, there are numerous further research possibilities in this area.
No matter in academic or practice, the concept of market segmentation is always important and capable in marketing field. Traditionally, market segmentation be regarded as the basis of marketing strategy, practitioner can’t enforce effective marketing communication on subject without forming an appropriate strategy, or what Kolter called “STP” (Segmentation, Target, Positioning).
But consumer market is dynamic and changeful; firms can’t always take the “old trick” all the time. Since last century, a numerous and substantial inventions have changed the world, such as mobile phone, computer, internet, and so on. Contemporary enterprises must actively to accommodate new techniques, new competitive environment, new consumer behavior, and develop diversified competitive modes. For example, the appearance of Internet changed the most of the world we live: the information-searching behavior we used to be, the way we communicate with others, the action we usually take, and the sought we possess. On the other hand, the continuously developing techniques generate implicit possibilities and challenges for existent market, for our objective: the application of physical attribute in marketing.
Biotechnology was deemed the next promising industry following information technology and telecommunication industry. In past decades, we can see that
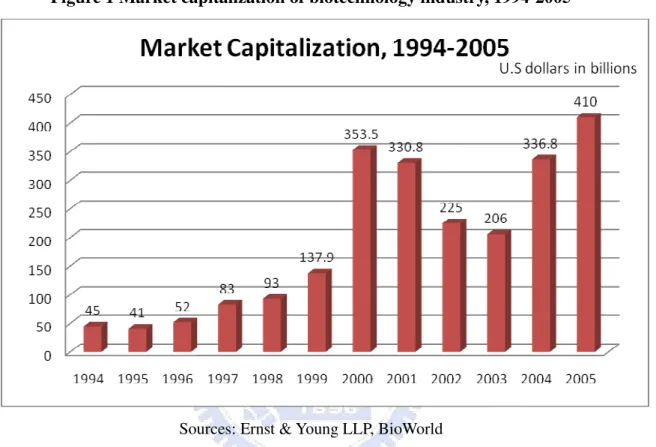
biotechnology has enormous market growth, through the gradually development of method and technique. Market capitalization of this area has grown up for decades (see exhibit 1), and expect to speed up in this century.
Figure 1 Market capitalization of biotechnology industry, 1994-2005
Sources: Ernst & Young LLP, BioWorld
According to BIO’s1 statement, the biotechnology industry originated in the 1970s, based largely on a new recombinant DNA technique whose details were published in 1973 by Stanley Cohen of Stanford University and Herbert Boyer of the University of as California, San Francisco. The relevant industries of biotechnology involve medicine, agriculture, environment, energy, and marine, this area includes numerous and various product and service. Although the development of biotechnology still moves on lively, we can’t find the application in marketing field yet.
1. The Biotechnology Industry Organization (BIO) was founded in 1993 to represent biotechnology companies at the local, state, federal and international levels. As of December 2006, BIO's membership consisted of more than 1,100 biotechnology companies, academic centers, state and local associations and related enterprises.
3
Simply speaking, biotechnology is a technology based on biology, by definition of United Nations Convention on Biological Diversity, “Biotechnology means any technological application that uses biological systems, living organisms, or derivatives thereof, to make or modify products or processes for specific use.” Biotechnology is an interdisciplinary science; it involves genetics, molecular biology, biochemistry, embryology and cell biology. Among these disciplines, our interest is going to explore the genetic possibility in marketing field, which means market segmentation.
One of the most well-known biotechnology relatives is genetics. Since the announcement of working draft of the genome by HGP2 (Human Genome Project) in June 2000, it seems that genetic relatives will grow dramatically in this century. It certainly will, but there are a number of problems and disputes exist. That is, in other words, researchers or practitioners who interested in this area still have enormous room to explore, confirm, research, and utilize.
The development of information technology encourage the breakthrough of many disciplines, such as bioinformatics, which is defined as “ research, development, or application of computational tools and approaches for expanding the use of biological, medical, behavioral or health data, including those to acquire, store, organize, archive, analyze, or visualize such data” by NIH (National Institute of Health). Therefore, this research is trying to further explore the possibility of physical attributes applying in market segmentation, and discuss the relationship between different consumer typology which is segmented by lifestyle and consumer innovativeness, then check the external validity by real purchasing behavior.
2. The Human Genome Project (HGP) is an international scientific research project. Its primary goals were to determine the sequence of chemical base pairs which make up DNA and to identify the approximately 25,000 genes of the human genome.
The project began in 1990 and supported by governments such as U.S, England, France, Japan and so on. A working draft
Innovativeness, Roehrich (2004) thought that it is the more well-defined among marketing concepts. What we discuss here is consumer innovativeness, or” consumption of newness,” which is the tendency to buy new products more often and more quickly than other people (Midgley and Dowling, 1978). In early periods, Rogers propose the famous definition, which define someone is an innovator or not by the time-of-adoption method, but this method was criticized for both in theory and methodology (Midgley and Dowling 1978; Hurt et. al. 1977). Though there are some disputes between different researchers, the significance of the innovativeness issue is undoubted, especially when the new products are created and launched consistently in modern society.
Today, it’s necessary for companies to continuously launch new product due to the more and more competitive market. In the past, marketing managers used various segmentation bases to segment heterogeneous consumers, then profiling these clusters to further understand consumer pattern. Now, it seems like the market segmentation issue can go forward by the achievement of the genetic study. Through the development of information technology and biotechnology, we can acquire more detailed gene information from each animal, plant, and human.
In studies of genetic disease, H. Cummins (1936) first found the patient of Down syndrome own unusual fingerprints combination. Galton (1892) and Wilder (1902) investigated the genetic-based derma, and thought the epidermal ridges were affected by gene. Then we believe the accomplishment of draft of genome will encouraged more and more scientists to explore the cause between physiology, psychology and behavior. It was argued that each fingerprint characteristic was controlled by polygenic inheritance and the environment of womb mutually. Therefore, partial
5
information of genome can be observed through external fingerprints, and we could analyze the variation of consumer behavior from observed physical attribute: fingerprints.
Another contribution this study made was to validate the capability of physical attribute in consumer innovativeness. For example, if there is one company which sell innovative goods or novel service, the manager must wants to know how many people will interested in company’s goods or service, and where are these customers. As a result, this method was different from previous “questionnaire,” which might be counterfeited by respondent; physical attribute would provide more direct, effective measurement.
1.2
Research Objectives
In summary, this research wants to explore the likelihood of physical attribute in market segmentation. If physical attribute of body can really be used to segment consumer market, to explain the consumer innovativeness, or actual purchasing behavior, we surely get a preliminary understanding on this area. For this reason, we raise the propositions below:
P1: Physical attribute can provide an instrument to market segmentations
P2: Different segments, whatever derived from lifestyle, physical attribute, or buying behavior, can constitute various degree of consumer innovativeness.
Chapter2 Literature Review
2.1 Market Segmentation
From economics perspective, the originally analogous concept of segmentation stem from imperfect competition theory (Robinson, 1933), but it still uncorrelated to marketing field relative until Smith’s introduction. Smith (1956) stated: “Market segmentation involves viewing a heterogeneous market as a number of smaller homogeneous markets, in response to differing preferences, attributable to the desires of consumers for more precise satisfaction of their varying wants.”
In order to understanding the difference and similarity among these individuals, and to take a effect work on marketing mix (4P)、communication,、product design… , investigators should first separate those individuals appropriately.
2.1.1 Segmentation definition
There are numerous definitions of market segmentation by different researchers. To some extent, these concepts are analogous but somewhat different.
Lilien and Kolter (1983) consider that market segmentation is a theory to explain the variation among consumers, exploit and investigate them from strategic view.
Similar to above, Dickson (1982) thought market segmentation have to understand the what, when, how and why of demand, which results from the interaction of personal and environmental. Such combination is needed to explain and target marketing strategy.
7
Boote (1981) argued that segmentation analysis is to identify people within the market who are more likely to be influenced by marketing than others in particular product or service. Besides, the objectives of which are to reduce the risk in marketing a new product, service, or brand. Segmentation analysis also help marketer to increase the communication efficiency by directly assigning marketing resources to selected segment.
Still there are other definitions of segmentation such as Wendell (1956), Alfred (1981), McCarthy (1996) and Kotler (1997). Especially, Dickson and Ginter (1987) reviewed a lot of literatures about market segmentation and product differentiation, they clarified the difference of which in underlying framework aspect, and concluded that product differentiation and market segmentation are clearly not alternative management strategies.
Simply speaking, all these definition almost derived from Smith’s concepts of partitioned markets into homogeneous sub-markets in terms of customer demand, and led to the identification of clusters of consumers that respond to similarly to same marketing mix (Wedel and Kamakura, 2000). To our research, we followed the original definition of market segmentation and further to expand the domain of segmentation basis, which will discuss below.
2.1.2 Segmentation Bases
A segmentation basis is defined as a set of variables or characteristics used to assign potential customers to homogeneous groups (Wedel and Kamakura, 2000). Still, academics or practitioners applied and selected various segmentation bases due to their different purposes and markets.
For example, Haley (1968) considered that traditional segmentation types were handicapped by an underlying disadvantage inherent in its nature, such as geographic, demographic and volume. He thought that all these above were belong to ex-post analysis, or descriptive factors; they can’t predict the buying behavior well. In other words, they provided helpful guideline in some marketing practice issues but had weak causal relationship in buying behavior. Haley suggested that identify market segments by causal factors rather than descriptive factors. Causal factors also could be called “benefit segmentation”, it consists of detail consumer value system like product benefit, attitude etc... . Though descriptive factors were commented by their poor predict ability, however, demography, brand perceptions, or media habits can describe the segments which by applying benefit sought. Combination of these two factors will help researchers better understand who make up these segments.
Similar to Haley’s suggestion, Wind (1978) argued that a segmentation model requires not only basis of segmentation, bug also descriptors of various segments, and all of consumer behavior variables could be bases or descriptors. Therefore, he divided these variables into two types:
- General customer characteristics: demographic, socioeconomic characteristics, personality, lifestyle characteristics, attitudes, behavior toward channel and so on
- Situation-specific customer characteristics: product usage, purchase patterns, benefits sought, new product concepts etc
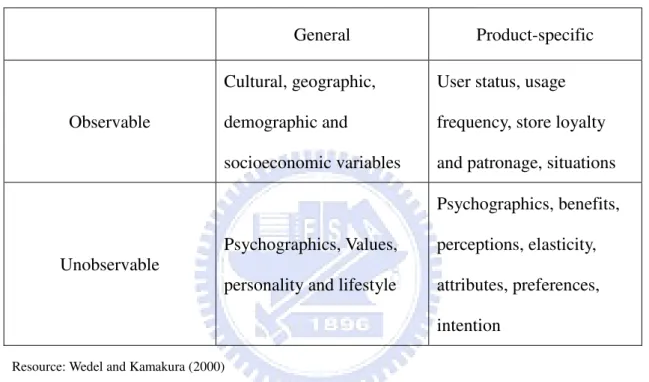
Frank, Massy and Wind (1972) classified segmentation bases into general and
9
observable or unobservable, shown in Figure 2.1. Generally speaking, researchers have consensus gradually that some variables are better than other variables as bases of segmentation (Wind, 1978; Assael, 1976). That is, there was no uniform approach which can apply to all kinds of categories or markets.
Figure 2-1 Classifications of Segmentation Bases
General Product-specific
Observable
Cultural, geographic, demographic and
socioeconomic variables
User status, usage frequency, store loyalty and patronage, situations
Unobservable
Psychographics, Values, personality and lifestyle
Psychographics, benefits, perceptions, elasticity, attributes, preferences, intention
Resource: Wedel and Kamakura (2000)
Most of the time, practitioner selected one behavioral pattern to segment consumer, but there were a number of researchers who challenged the validity and reliability of this way (Assael, 1976). Though this study is trying to use a new physical pattern to discriminate consumers, the query we might face is under consideration. In addition to applying physical attribute of body, the lifestyle basis was selected to supplement the reliability and validity of this research. Physical attribute reflects private information of gene of human body; hence it belongs to personal factor. However, consumer behavior also involved environment, politics, society, and psychology, so we attempt to undertake together with lifestyle, which will introduce latter.
2.1.3 Segmentation methods
The methods employed in segmentation research were numerous and depended on researchers’ objectives and refinement. Simply speaking, what segmentation really work is to group something that investigators interested, and then helped them to take necessary action behind that. Green (1977) first brought up classification of segmentation into a-priori and post-hoc approaches. Wind (1978), meanwhile, suggested that researchers can segment market except for typical dichotomy, that is, flexible segmentation and componential segmentation. He thought these four types of segmentation models can be effective, if only were selected appropriately. These models are:
- Priori segmentation model: investigator choose the basis of segmentation and the result show the segment’s size and characteristic such as
demographic, psychographic, socioeconomic etc.
- Clustering-based segmentation design: respondents were clustered based on the relatively “distance” which are some kinds of bases of segmentation. - Flexible segmentation: this approach is the integration of the results of a conjoint analysis and a computer simulation of consumer choice behavior. Segments can be classified due to the consumer’s response to alternative product offerings.
- Componential segmentation: the method of predict which person type will be most responsive to what type of product feature; the personality is included as well. It is an integration of conjoint analysis and orthogonal arrays. -
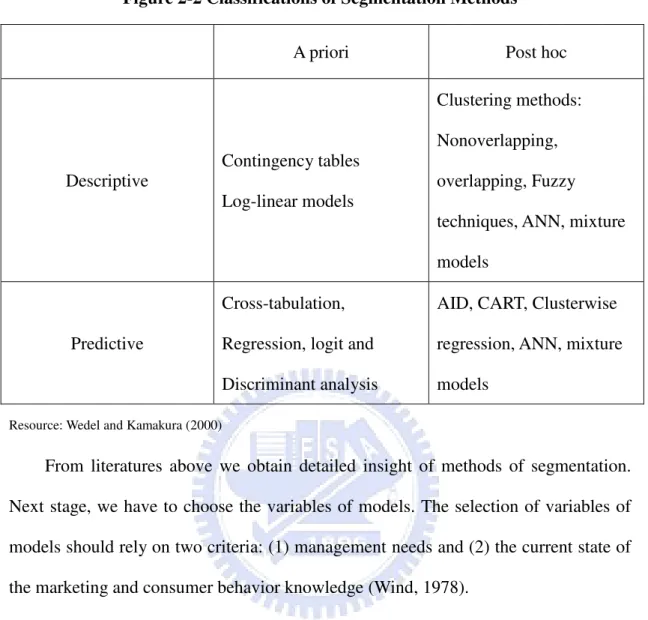
Recently, Wedel and Kamakura (2000) classified the methods of segmentation following Green (1977) and Wind (1978), however, added the second approach by judging whether descriptive or predictive( see figure 2.1.2). Descriptive methods attempt to examine the associations among a set of distinctive variables. Predictive methods consist of two sets of variables, which one can be explained by another one.
11
Figure 2-2 Classifications of Segmentation Methods
A priori Post hoc
Descriptive Contingency tables Log-linear models Clustering methods: Nonoverlapping, overlapping, Fuzzy techniques, ANN, mixture models
Predictive
Cross-tabulation, Regression, logit and Discriminant analysis
AID, CART, Clusterwise regression, ANN, mixture models
Resource: Wedel and Kamakura (2000)
From literatures above we obtain detailed insight of methods of segmentation. Next stage, we have to choose the variables of models. The selection of variables of models should rely on two criteria: (1) management needs and (2) the current state of the marketing and consumer behavior knowledge (Wind, 1978).
First, some popular bases of segmentation are easy to use and well-established, these bases included demographic, socioeconomics, psychographic, lifestyle and so on. Nevertheless, these various bases have some inherent defects and criticized by their ineffective, low predict ability, poorness (Yankelovich, 1964; Bass et al., 1968; Boote, 1981; Baalbaki and Malhotra, 1993; Vyncke, 2002), and false feedback due to the self-reported measures (Nighswonger and Martin, 1981).
Second, genetic scientists are striving to explore the gene issues and associate which to hereditary disease or general behavior of human. On the other side,
marketing researchers interested in investigating the consumer purchasing behavior and others relative patterns. Hence this research attempt to link up physical attribute which is gene-oriented with market segmentation, this idea of combination might arouse the further research in market segmentation issues.
2.2 Life Style
Though the concept of lifestyle stemmed from psychology and sociology, the use of lifestyle concept is widespread and diversity. Some made a study of youth and youth sub-cultures (e.g. Jenkins, 1982; Bynner and Ashford, 1992), some did the family (Lee, 1976; Hunt and Hunt, 1987) and so on. Since the concept is derived from psychology and sociology, we first introduce the conceptualization briefly and then review the development and application of lifestyle in marketing field
2.2.1 Psychology aspect
In psychology, Alfred Adler (1929) regarded individual as a coherent ‘whole person’, the values and guiding principles which provide the framework for that wholeness being termed the person’s “style of life” (Veal, 1993). Adler and his follower explore the lifestyle issue based on the individual psychology perspective, which emphasize the personality everyone possesses is unique and coherent. Similar to Adler’s point, George Kelly (1955) proposed a system of “constructions” which called “Personal Construct Theory”. Both of them focus on a person’s inner world, how to organize individual inner world, and how individual change the inner world along with environmental variation. Correlate to the propositions above, Reynolds and Darden (1974) and Earl (1983) relate lifestyle to “Personal Construct Theory”, and this blend provides a framework for the individual development of a coherent lifestyle (Veal, 1993)
13 2.2.2 Sociology aspect
Undoubtedly, the lifestyle issues had continuously interested among sociologist because it is regard as a derivatives of class, status, or party. Max Weber (1968) argued that divisions in society arise not only from class, but also from status. By Weber’s (1948) description a status group is distinguished by the honor accorded to it by the rest of society, but also by its particular style of life. Veal further to illustrate the function of "style of life”
The style of life adopted by a status group serves to mark the boundaries of the group and to reinforce the honor system which underpins the group’s status. (Veal, 1993)
Otherwise, Veblen (1954) compared the differences in lifestyle between two different production formations, Marx (1966) consider that lifestyle is a phenomenon, which is determined by the objective position in production process. Therefore, the role of lifestyle in sociology has been mainly discussed in socio-economic status, structure of society, and culture & sub-culture related issues.
2.2.3 Marketing aspect
It is generally acknowledged that Lazer (1963) was the first one to lead the concept of lifestyle into marketing field (Plummer, 1974). In Lazer’s definition, he thought lifestyle is a systematic conception which can distinguish the variation between societies or groups against others.
Today, lifestyle is generally regarded as the patterns in which people live and spend their time and money for the most part (Kaynak and Kara, 2001; Engel, Blackwell and Miniard, 1995). Most of the marketing managers may chose lifestyle to be the basis of segmentation, because it’s easy to use and fruitful description of
consumer characteristics. Though there were few researchers distinct the terms between lifestyle and psychographic, they were used interchangeably in marketing research literature (Wedel and Kamakura, 2000). The term “Psychographic” was first introduced by Demby (1974), who find the need to enhance the richness of purely demographic and further understand the consumer behavior in order to develop more adequate advertising strategies (Vyncke, 2002).
2.2.4 Measurement
The famous AIO scale is one of the measurements used to apply lifestyle segmentation. AIO scale includes three categories: activities, interests and opinions, which consist of a number of Likert-type items. For example, Wells and Tigert (1971) developed 300 AIO statements. It’s a well-known and general accepted measurement which used to segment market, but some researchers argue that constructs such as activities and attitudes are immediately affluence by the environment, hence are neither stable nor generalizable (Wedel and Kamakura, 2000).
RVS (Rokeach, 1973) and LOV (Kahle, 1983) scale then emerged result from the focus of value concept. Rokeach defines value as “an enduring belief that a specific mode of conduct or end-state of existence is personally or socially preferable to an opposite or converse mode of conducts or state of existence,” and LOV is just an abbreviated scale derived from RVS. Another lifestyle instrument: VALSTM, which was developed by Mitchell (1983). VALSTM lifestyle typology also derived from theoretical concepts used by Rokeach in his value scale. In fact, though VALSTM was popular when it appeared in early period, the critics argue that it was far associated with actual product-related behavior, and solely based on general social values (Wedel and Kamakura, 2000). Therefore, VALSTM was modified two times to current version
15
which developed from multiple personality constructs and considering buying behavior relatives.
Obviously, psychographic or lifestyle are commonly used to be descriptors of segment which based on other bases of segmentation. Underlying frameworks and measurement of psychological constructs existed inherent difficulty in such models. Another implicit problem is the verbal self-reported measurement, which probably result in the bias between consumer perception and actual buying behavior. In Zaltman’s study (2003), he found that in most cases, consumers can’t clearly explain why they buy specific product by the use of verbal measures; even so, lifestyle provide simple and well-established instrument. Beside, academics have found that individual values have a significant impact on consumer’s behavior, especially on their inclinations to adopt new products (Daghfous et al., 1999). Therefore, we choose lifestyle as the basis of segmentation. In this study, each respondent will be separated into a specific segment by using multivariate method, that is, cluster analysis. When the typologies had been completed, physical attribute based classification and behavioral patterns could go further.
2.3 Physical Attribute
The notion of physical attribute of body to be the basis of segmentation resulted from the achievement of biotechnology from past years. More and more scientists around world devoted themselves to the investigation of genome; all the projects were hosted, sponsored by private enterprises or governments, the famous one is Human Genome Project (HGP). Clear megatrend of consumer’s need for customized therapies arouse researchers’ interest, but we did not to investigate the applicability of genetic therapies nor potential medical market. What we really interest is the
association between psychology, physiology, and behavior in market segmentation issue.
2.3.1 Dermatoglyphics
Dermatoglyphics is a discipline which investigates the patterns of human fingers, palms, and soles. It can associate with anthropology, criminology, genetics and racial study. Perhaps the most familiar implication of this area is fingerprint identification, which usually be used as the powerful certification of crime when judgment. In addition to identification, many researchers studied the variation of different races around whole world.
Harold Cummins (1926) is the first one to introduce “dermatoglyphics”, and describe the detail in his book: “Fingerprints, Palms and Soles: An Introduction to Dermatoglyphics”. In fact, the studies of fingerprints were even far more than nineteen century. In studies of genetic disease, H. Cummins (1936) first found the patient of Down syndrome own unusual fingerprints combination, and numbers of following researches continuously discover the relationship between genetic diseases and fingerprints (Cummins, 1961). Furthermore, the development of biology also advanced the study of dermatoglyphics. Galton (1892) and Wilder (1902) investigated the genetic-based derma, and thought the epidermal ridges were affected by gene. Kristine Bonnevie (1924) completed many studies of inheritance of fingerprint characteristics.
The progress of information technology and algorithm advance the examination of between gene and fingerprints. It was considered that each fingerprint characteristic was controlled by polygenic inheritance and the environment of womb mutually. As a result, some information of genetic variation can be observed through external
17
fingerprints. By doing this, we might compare the variation of purchasing behavior, or innovativeness of objectives derived from genetic aspect of observed physical attribute: fingerprints. Finally, to combine with lifestyle to explore the applicability of the framework as we suggested in market segmentation and consumer innovativeness.
2.4 Consumer Innovativeness
The study of innovativeness can be classified into three categories: Firm
innovativeness, which refers to the how fast the firm’s ability to create or launch new products; Product innovativeness is the original degree of products; Consumer
innovativeness, which is the tendency to buy new products more often and more quickly than other people (Hurley and Hult, 1998; Daneels and Kleinsmith, 2001; Midgley and Dowling, 1978; Roehrich, 2004). The innovativeness we mention here is referring to consumer innovativeness.
The achievement of technology stimulates the speed of innovation of new products, and led to enormous competition among firms. Managers came up against this market situation and which encourage them to wonder about what consumer want, and how consumer treat the new products. Because firms have to benefit from revenue and that depends on satisfying customer needs better than competitors can satisfy those needs (Hauser, Tellis, and Griffin, 2006).
Besides, it’s not only practitioners have interests in consumer innovativeness, but also academics want to examine the propensities of consumers for novel products, which can play an important role in brand loyalty, decision making, preference, and communication (Hirschman, 1980).
2.4.1 Innovativeness definition
According to Rogers’ study (1962), the attitude of different people to adopt new product have significant variation, some tends to adopt rapidly, and others don’t. Rogers and Shoemaker (1971) defined innovativeness as the “degree to which an individual is relatively earlier in adopting an innovation than other members of his system”.
In fact, the term “innovativeness” has no real consensus among researchers (Roehrich, 2004). Though Rogers’ time-of-adoption method was accepted by a lot of following researchers at that time, Midgley and Dowling (1978) argued that Rogers’ definition of innovativeness was just an operational definition. They viewed innovativeness as a personality construct possessed to a greater or lesser degree by all individuals (Hirschman, 1980). Innovativeness can be classified into two categories: innate or inherent innovativeness, and actualized innovativeness (Midgley and Dowling, 1978), the latter is the same with concept of Rogers’ innovativeness. But the relationship between innate innovativeness and actualized consumer behavior is complex and affected by other intervene factors like communication network, interest, situational factors, marketing and so forth (Steenkamp, Hofstede, and Wedel, 1999; Midgley and Dowling, 1978).
The simplistic trait-behavior model and low-level definition of innovativeness were also discredited in other behavioral sciences (Mischel 1968; Peterson 1968; Midgley and Dowling, 1978). In addition, Steenkamp et al. (1999) defined that consumer innovativeness as “the predisposition to buy new and different products and brands rather than remain with previous choices and consumption patterns.”
19
Therefore, innate innovativeness was deemed a conceptual construct and can’t directly link to actualized consumer behavior due to the system of intervening variables. However, researchers can keep investigate this issue by modifying context setting or role of objective. As a result, we conclude that personality trait which called innovativeness everyone possessed more or less, but have to assess the fitness of application when researchers define the problems. In our discussion, we want do know if this new criterion of segmentation can discriminate various degrees of consumer innovativeness, so the digital camera (DC) purchasers were selected due to the product’s complete development and broad use nowadays.
In addition to the studies of innovation diffusion model and consumer behavior, innovativeness also had been associated with other disciplines, such as psychology, organizational behavior. There were numerous studies investigated the association between innovativeness and personality traits, some have found that innovativeness was correlated positively to optimum stimulation level (Steenkamp and Baumgartner, 1992; Zuckerman, 1979), others maybe creativity, risk taking and so on. Indeed, personal value plays an important role in cognitive structure which might interact with psychological or physical factors, and the objective of this study is not to depict possibly implicit interaction. Nevertheless, private physical attribute plus lifestyle may provide more powerful information for segmentation than before.
2.4.2 Measurement
It is the same to the extent of difficulty confronted by measurement of innovativeness with psychological scales. Since the development of innovativeness scales from the mid-1970s, there existed no homogeneity among theses scales as a result of diversified underlying premise and structure. Midgley and Dowling (1978)
commented that Rogers’ time-of-adoption method was a tautology, and another methodology to measure innovativeness was cross-sectional method, which might better than Rogers’ (Goldsmith and Hofacker, 1991).
Besides, Roehrich (2004) reviewed relative literatures and classified these scales into two categories: life innovativeness scales, which focus on the propensity to innovate at a general behavioral level, included Leavitt and Walton’s (1975), Kirton’s (1976) and Hurt et al.’s (1977). Adoptive innovativeness scales, which focus specifically on the adoption of new products, these scales included Raju’s (1980), Goldsmith and Hofacker (1991), and Baumgartner and Steenkamp (1996).
Because of the discrepancy of underlying framework, several kinds of scales have been used to measure innovativeness separately. For example, Hirschman (1980) thought that innovativeness is related to novelty seeking and consumer creativity, Fromkin (1971) suggested a link between innovative behavior and need for uniqueness, and others can be found in Roehrich’s study (2004).
Similar to Hirschman’s work, Kirton (1976) developed the well-known innovators-adaptators inventory (KAI) scale, but mostly used in the investigation of creative propensity within organization. Raju’s (1980) scale has good internal consistency, but be criticized by its structure. Le Louarn’s (1997) scale has proved to have good psychometric properties and good predictive validity (Roehrich, 2004). It seems like the Le Louarn’s scale is the better one used to measure innovativeness; however, we abandoned Le Louarn’s scale because of the difficulty of language translation.
21
Finally, we choose Goldsmith and Hofacker’s (1991) scale to be our measurement of innovativeness result from its two merits: First, Goldsmith and Hofacker’s Domain-Specific innovativeness scale (DSI) merely consists of six items and directly taps the latent construct itself rather than secondary variable; Second, DSI has been confirmed its validity of both several product field and nations (Flynn and Goldsmith, 1993a; 1993b; Goldsmith and Flynn, 1992; Goldsmith, d’Hauteville and Flynn, 1998).
Chapter3 RESEARCH METHODOLOGY
3.1 Research Framework
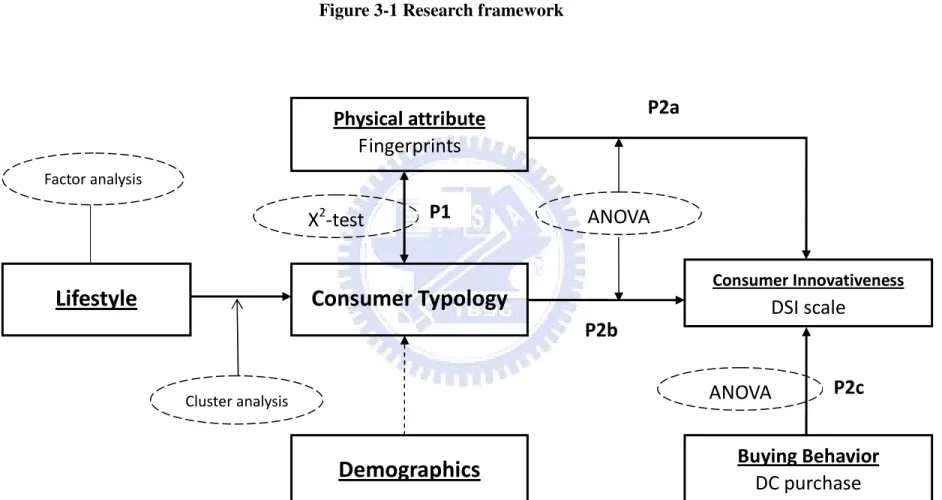
After reviewing the past literatures and works, we might obtained more insights from physical attribute, consumer innovativeness, and the possible application in market segmentation. The application of lifestyle segmentation has prevailed in past decades, such as AIO, LOV, and VALSTM, which were criticized for poor performance on segmentation and validity though. Wedel (2000) suggested to establish a theoretical link between value and behavior. In Daghfous’ study (1999),` it was proved that individual value has significant impact on inclination to adopt new products. In addition to lifestyle, we argued that physical attribute can provide another way to validate consumer typology which segmented by lifestyle. Consequently, consumer typologies will represent various degree of consumer innovativeness.
Besides, we also investigated the respondents’ actual buying behavior to cross-validate these typologies. Digital camera (DC) was chose as subject because it’s complete development in high-tech product category. Digital camera was still an innovative product in last century rather than traditional camera; however, the maturity of nowadays market made manufacturers keep launching into new features or designs to maintain their market share, respectively. Therefore, we propose two propositions, and the framework of this research will show below.
P1: Physical attribute can provide a good instrument to market segmentation
P2: Different segments, whatever derived from lifestyle, physical attribute, or buying behavior, can constitute various degree of consumer innovativeness.
24
ANOVA
Figure 3-1 Research framework
X
2-test
P1
P2a
P2b
P2c
Lifestyle
Consumer Typology
Physical attribute
Fingerprints
Demographics
Consumer InnovativenessDSI scale
Buying Behavior
DC purchase
Factor analysis Cluster analysisANOVA
3.2 Questionnaire generation
3.2.1 Questionnaire designThe survey questionnaire was divided into four sections. We cited the VALSTM survey as the Section 1 to measure the value and lifestyle of respondents. There were 10 questions in section 2, investigating the respondents’ DC buying behavior. These questions included the frequency, amount of money, brand, place, purpose and so on. Moreover, Goldsmith and Hofacker’s (1991) Domain-Specific innovativeness scale was used as the measurement of consumer innovativeness in section 3 due to its advantages we ever discussed in chapter 2. Finally, section 4 investigated the respondents’ basic demographic information and that would be used for describing purpose.
Section 1
In section 1, the items of current VALSTM version was cited to conduct constructs of lifestyle, which later will be analyzed by using cluster analysis. Original VALSTM consists of two partitions; First part includes 35 psychological items and 4 demographic items in second part. Demographic part was eliminated because section 4 will cover these items. Five of psychological items were deleted since cultural variation and too many similar items.
Section 2
No doubt, most of social scientists care about the connections between behavior pattern and specific topic, such as sociology, psychology, economy and for this research, marketing. In marketing aspect, what researchers really interested is the relation between buying behavior and specific marketing issues. Walters (1970)
26
suggested that consumer behavior can be analyzed from these issues: whether consumers buy the product or not, what product, why, when, where and how.
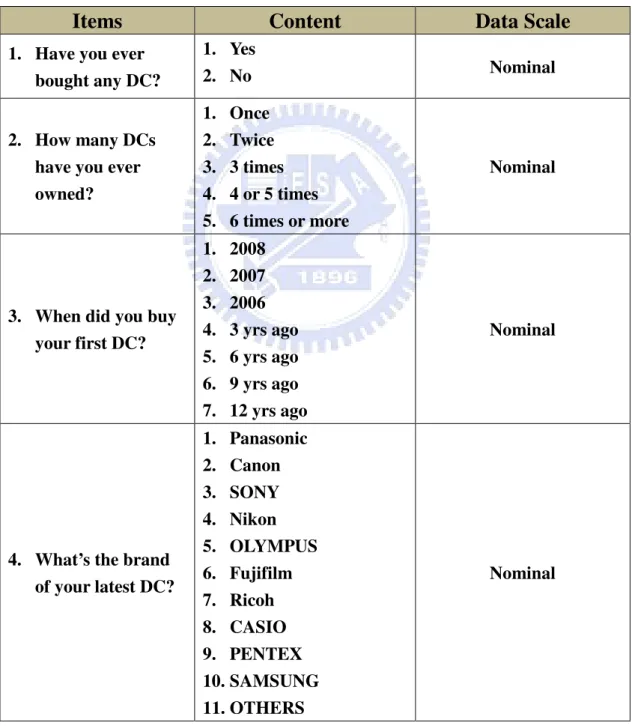
This section investigated the respondents’ digital camera buying behavior and of course, we also asked what brand of digital camera they owned, how much they spend, and what kinds of equipment their digital camera possessed. Table 3-1 below showed the detail.
Table 3-1 DC buying behavior Items
Items
Content
Data Scale
1. Have you ever bought any DC?
1. Yes
2. No Nominal
2. How many DCs have you ever owned? 1. Once 2. Twice 3. 3 times 4. 4 or 5 times 5. 6 times or more Nominal
3. When did you buy your first DC? 1. 2008 2. 2007 3. 2006 4. 3 yrs ago 5. 6 yrs ago 6. 9 yrs ago 7. 12 yrs ago Nominal
4. What’s the brand of your latest DC? 1. Panasonic 2. Canon 3. SONY 4. Nikon 5. OLYMPUS 6. Fujifilm 7. Ricoh 8. CASIO 9. PENTEX 10. SAMSUNG 11. OTHERS Nominal
5. Where did you buy your latest DC? 1. Professional store 2. 3C square 3. Hypermarket 4. Home shopping channel 5. Internet shopping 6. Mail order 7. Department store 8. OTHERS Nominal
6. How much money did your latest DC cost? 1. < NT$ 4999 2. NT$ 5,000 – 9,999 3. NT$ 10,000 – 14,999 4. NT$ 15,000 – 19,999 5. NT$ 20,000 – 24,999 6. > NT$ 25,000 Nominal 7. How many megapixels did your latest DC possess?
1.
< 3.0 megapixel 2. 4.0 – 6.0 megapixel 3. 7.0 – 9.0 megapixel 4. > 10.0 megapixel Nominal 8. What volume is your memory card? 1. < 1G 2. 1G 3. 2G 4. 4G 5. 8G 6. OTHERS Nominal9. What type is your latest DC?
1. Basic 2. Advanced 3. Professional
Nominal
10. Why did you buy your first DC at that time? 1. Personal/Family use 2. Business use 3. Professional use 4. Keep up with DC trend 5. OTHERS Nominal
28
Section 3
As we discussed in chapter2, different innovativeness scales resulted from diversified conceptualization of consumer innovativeness, which represent different structural dimensions (Roehrich, 2004). We chose Goldsmith and Hofacker’s (1991) Domain-Specific Innovativeness (DSI) scale to measure consumer innovativeness due to: (1) DSI is simple and directly (six items and directly taps the latent construct) (2) DSI has been verified its applicability in various products and countries (e.g. U.S, French, German) (3) DSI has good psychological traits, i.e. reliability and predictive validity (Roehrich, 2004; Hauser et al., 2006).
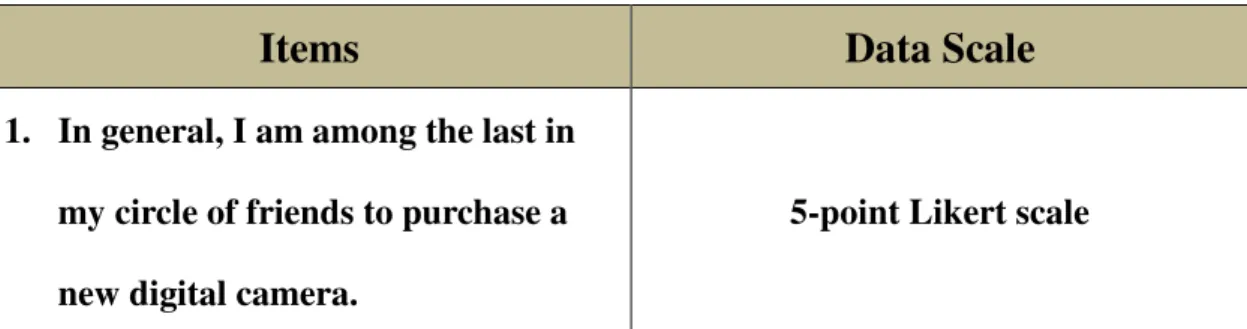
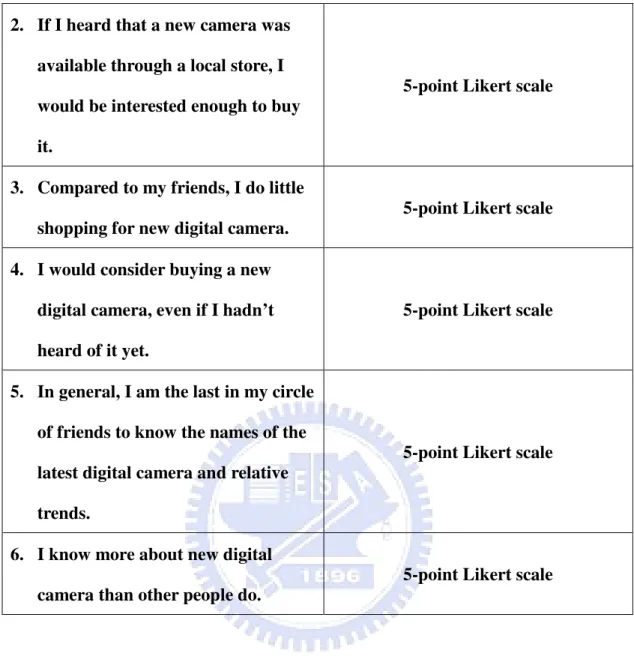
Although DSI scale has been confirmed that it was available in various products and countries, we were still careful when handling with the wording of items because of cultural difference, and product category variation. The finished translation form will show in appendix. Table 3-2 demonstrated the items of scale we used in digital camera category before translation, and the process of translation and pretest will present in next paragraph. Finished DSI scale utilized 5-point-likert-scale and three of six items are negative worded items, they are item 1, 3, and 5, respectively. In essence, consumer innovativeness is relatively high than others if respondent represents high average score.
Table 3-2 Domain-Specific Innovativeness scale items
Items
Data Scale
1. In general, I am among the last in my circle of friends to purchase a new digital camera.
2. If I heard that a new camera was available through a local store, I would be interested enough to buy it.
5-point Likert scale
3. Compared to my friends, I do little shopping for new digital camera.
5-point Likert scale
4. I would consider buying a new digital camera, even if I hadn’t heard of it yet.
5-point Likert scale
5. In general, I am the last in my circle of friends to know the names of the latest digital camera and relative trends.
5-point Likert scale
6. I know more about new digital camera than other people do.
5-point Likert scale
Section 4
In the study of market segmentation, descriptive variable is used to profile the segments in order to further analysis or managing purpose. One of well-known descriptive variables is demographic variable; as a result, we conduct seven common demographic variables to enrich segment profile and cross-validate consumer innovativeness.
Table 3-3 Demographic Items
Items
Content
Scale
1. Sex 1. Male
30 2. Age 1. < 20 yrs 2. 21 – 25 yrs 3. 26 – 30 yrs 4. 31 – 35 yrs 5. 36 – 40 yrs 6. 41 – 45 yrs 7. 46 – 50 yrs 8. 51 – 55 yrs 9. 56 – 60 yrs 10. > 61 yrs Nominal
3. Family Life Cycle
1. Single
2. Married, but no kids 3. Youngest child < 6yrs 4. 6 < youngest child <18 yrs 5. Youngest child > 18 yrs, but
dependent
6. All children are independent 7. Others Nominal 4. Location 1. North Taiwan 2. Middle Taiwan 3. South Taiwan 4. East Taiwan 5. Others Nominal 5. Education background
1. Junior high school 2. Senior high school 3. Junior college 4. College
5. Graduate school
6. Occupation 1. Student 2. Public servant 3. Housewife 4. High-Tech industry 5. Business 6. Service industry 7. Manufacturing 8. Others Nominal 7. Personal Monthly Income 1. < NT$ 20,000 2. NT$ 20,001 – 35,000 3. NT$ 35,001 – 50,000 4. NT$ 50,0001 – 100,000 5. > NT$ 100,001 Nominal 3.2.2 Pretest
Eight graduate students from NCTU Institute of Business and Management were invited to participate in this pretest. Most of the participants suggested that there were too many similar questions in section 1; as a result, we eliminated three questions from original list. Of course, the two religion relative items have drawn out before the pretest. Unfortunately, DSI scale demonstrated that some factor loadings of six items were not significant at 0.05 level even if the reliability was acceptable (coefficient alpha=0.6238). After discussing with professor and 5 participants, #2 and #4 of DSI scale were modified to fit for original meaning properly.
32
3.3
Obtainment of physical attribute of respondents
In general, it is difficult to obtain private physical attribute from public. One is that public unwilling to provide physical parameter because they thought that personal physical attribute will invade their privacy and probably used as illegal activities. Another one is that analysis of physical attribute needs precision instruments and complicated processing problem. This research cooperated with Z.F. SPECTRUM TECHNOLOGIES INC., which is a company used precision instruments to acquire and analyze personal physical attributes, such as fingerprints and hair.
The report can provide a lot of physical parameters; however, we chose loop number of fingerprint to provide personal physical information due to: (1) the classified model of fingerprints are still undefined, besides, categorical data can’t be used as qualitative research, such as the shape of fingerprints (2) although hair provided more personal physical information rather than fingerprints, what parameters we should chose from hair is another problem.
3.5
Statistic Methods
This section will introduce some statistic methods that will be used in this study. First of all, Descriptive Statistics is a statistic technique to summary general information of variables, such as mean, variance, distribution, normality and so on. It provides researchers rough image about interested question. Graph, table, or figure is necessary to summarize and present aggregate data. Though descriptive statistics can’t provide more detail information, it’s good instrument to help researcher understand whole situation preliminary.
Factor analysis is a technique which combines lots of similar variables into each construct. Several similar variables were replaced by one factor, that is, each variable is considered as a dependent variable that is a function of some unobserved, underlying set of factors. Thus, factor analysis implies fewer factors and summarizes most of the measured information in data set.
Cluster analysis is a well-known instrument for market segmentation research; the primary objective of cluster analysis is to classify observations into identified group by their characteristics. In general, cluster analysis usually can be divided into two major procedures: hierarchical and nonhierarchical. Though there is no absolute answer when which procedure should be choose, we use the K-means method of nonhierarchical procedure to analyze the data due to large sample (N=271).
Analysis of Variance (ANOVA) is a famous technique used to compare the means of several populations on a single measured variable. In this study we used ANOVA to examine if any variation exists in consumer innovativeness, by lifestyle
34
based typology, physical attribute based classification, and buying behavioral patterns. Although two-way or more high-level ANOVA can be utilized, we abandon these procedures because that’s not the interest of this research.
In categorical data analysis, test of homogeneity could demonstrate whether existing significant relationship on specific variable or not among categories. Most of the time, researcher would show the contingency table and profile the difference if statistic test was significant. On the other hand, Chi-square test is the most common tool which was used to examine between two separate classifications. This study attempted to do exploratory research on this barren field; as a result, we utilized a lot of Chi-square test to identify the potential relationship.
Chapter 4 DATA ANALYSIS
The data were analyzed by software SAS 9.0. Section 4.1 demonstrated basic sample information, that is, demographic distribution and make-up. In section 4.2, the validity and reliability of questionnaire could be qualified. Section 4.3 produced the latent factors and factor scores of 30 items of lifestyle by factor analysis first, and then nonhierarchical procedure of cluster analysis been applied to form consumer typologies. We validated if existing significant relationship between lifestyle-based consumer typologies and physical-attribute-based classification in section 4.4. Ultimately, section 4.5 examined the difference of consumer innovativeness among separate consumer typologies based on lifestyle, physical-attribute-based classification, and DC buying behavior.
4.1 Descriptive Statistics
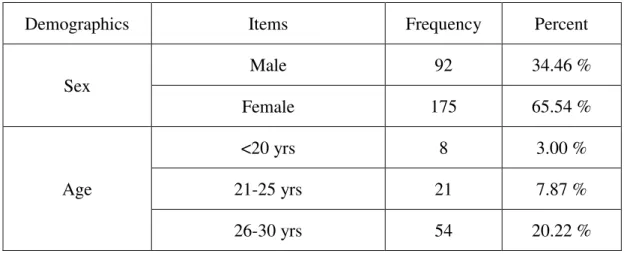
There were totally 271 recovery questionnaires till the end of investigation. Data consist of 267 available samples, two incomplete questionnaires, and two lost data of fingerprints of subjects. Descriptive Statistics were presented below, but the dropped sample won’t be included.
Table 4-1 Demographic profile of respondents
Demographics Items Frequency Percent
Sex Male 92 34.46 % Female 175 65.54 % Age <20 yrs 8 3.00 % 21-25 yrs 21 7.87 % 26-30 yrs 54 20.22 %
36 31-35 yrs 51 19.10 % 36-40 yrs 43 16.10 % 41-45 yrs 40 14.98 % 46-50 yrs 26 9.74 % 51-55 yrs 14 5.24 % 56-60 yrs 7 2.62 % >61 yrs 3 1.12 %
Family life cycle
Single 101 37.97 %
Married, but no kids 29 10.90 %
Youngest child < 6 yrs 47 17.67 %
6 yrs < Youngest child <18 yrs
55 20.68 %
Youngest child > 18 yrs,
but dependent 18 6.77 %
All children are independent 16 6.02 %
Location North Taiwan 207 77.53 % Middle Taiwan 1 0.37 % South Taiwan 21 7.87 % East Taiwan 34 12.73 % Others 4 1.50% Education Level
Junior high school 17 6.37 %
Senior high school 49 18.35 %
Junior college 70 26.22 %
College 106 39.70 %
Occupation Student 10 3.76 % Public servant 44 16.54 % Housewife 11 4.14 % High-Tech industry 9 3.38 % Business 35 13.16 % Service industry 105 39.47 % Manufacturing 12 4.51 % Free 12 5.64 % Others 25 9.40 % Monthly Income < NT$20,000 30 11.32 % NT$ 20,001 – NT$ 35,000 99 37.36 % NT$ 35,001 – NT$ 50,000 67 25.28 % NT$ 50,001 – NT$ 100,000 59 22.26 % >NT$ 100,001 10 3.77 %
Regarding to Table 4-1, there were 34.46% of male and 65.54% female in this investigation. Almost half of respondents, their ages are from 26 to 40 years old (55.42%) and 37.97% are single. 77.53% of whom lived in north Taiwan, well-educated (75.28% of above junior college) and work in service industry (39.47%). Besides, they also have well monthly income (51.31% of above NT$ 35,001).
4.2
Reliability and Validity
Since Goldsmith and Hofacker’s (1991) DSI scale was cited and translated into Chinese, it inevitably has to test the reliability and validity of scale. PROC CORR
38
& PROC CALIS procedures were used to examine reliability and validity, respectively. The outcomes showed below:
Table 4-2 Cronbach Coefficient Alpha
Cronbach Coefficient Alpha Variables Alpha
Raw 0.767427
Standardized 0.769787
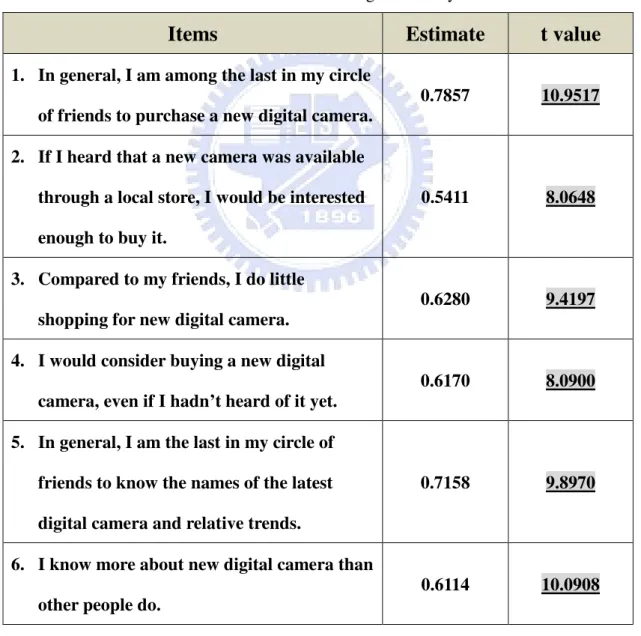
Table 4-3 DSI scale convergent validity
Items
Estimate
t value
1. In general, I am among the last in my circle of friends to purchase a new digital camera.
0.7857 10.9517
2. If I heard that a new camera was available through a local store, I would be interested enough to buy it.
0.5411 8.0648
3. Compared to my friends, I do little shopping for new digital camera.
0.6280 9.4197
4. I would consider buying a new digital camera, even if I hadn’t heard of it yet.
0.6170 8.0900
5. In general, I am the last in my circle of friends to know the names of the latest digital camera and relative trends.
0.7158 9.8970
6. I know more about new digital camera than other people do.
Cronbach coefficient alpha was acceptable (0.77), and Table 4-3 reveals that each factor loading was significant (︱t︱> 1.96), which implied that convergent validity was acceptable. Therefore, we thought that DSI scale were well-translated and applicable due to the verification of validity and reliability.
4.3
Consumer Typology
In chapter 2, the definition and development of market segmentation has been reviewed, besides, we also introduced various methods which were used to apply in this issue. First of all, all of lifestyle variables were reduced to some representative latent factors by factor analysis, then the factor scores could be used to process cluster analysis later. When both of these two steps have been completed, the analysis could go further.
4.3.1 Factor analysis
This research used 30 lifestyle items as the base of factor analysis. Principal Component Analysis was used to produce lifestyle factors; meanwhile, these factors were rotated by VARIMAX approach, which maximizes the sum of variances of required loadings of the factor matrix and tend to simplify the structures (Hair et al., 1992).
Zaltman and Burger (1975) suggested that factor’s eigenvalue should exceed one, and cumulative variance should reach 40%. After the process of PROC FASTCLUS procedure, we retained 9 factors due to Zaltman and Burger’s suggestion. Meanwhile, the cumulative variance accounts for 64% of total variance (Table 4-4)
40
Table 4-4 Eigenvalue Table of Factor Analysis
Factor Eigenvalue Proportion Cumulative
Factor1 6.648 0.2216 0.2216 Factor2 2.851 0.0950 0.3166 Factor3 1.937 0.0646 0.3812 Factor4 1.723 0.0574 0.4386 Factor 1.346 0.0449 0.4385 Factor6 1.302 0.0434 0.5269 Factor7 1.197 0.0399 0.5668 Factor8 1.156 0.0385 0.6053 Factor9 1.092 0.0364 0.6417
Since above factors have been retained to represent the latent factors with respect to lifestyle of respondents, each factor should be assigned some meaning. General speaking, the naming of factors is very subjective and vary among different researchers. Here we chose the factor loadings which value are high than .5 to label these factors.
Factor1: Experience factor
There were eight significant factor loadings been included in factor1. These variables reflected the tendency to seek for novelty, new stimulation, exciting feeling, and don’t want to a boring, invariable life. Therefore factor1 represents the attempt of stimulation seeking, and enjoy the whole new experience.
Table 4-5 Factors included in Factor1
Number Item Factor loading
A23 I like the challenge of doing something I have never
done before .72
A26 I am always looking for a thrill .72
A27 I like doing things that are new and different .70
A14 I like trying new things .56
A2 I like outrageous people and things .55
A3 I like a lot of variety in my life .50
A30 I like my life to be pretty much the same from week
to week -.58
Factor2: Active factor
Factor2 includes four variables, which represent the feature of leading, and superiority. High score of this factor demonstrates strong attempt on being a leader, as a result, they are active and high self-esteem.
Table 4-6 Factors included in Factor2
Number Item Factor loading
A18 I like to lead others .77
A11 I have more ability than most people .75
A6 I like being in charge of a group .74
A12 I consider myself an intellectual .60
Factor3: Status factor
Factor3 included three variables, which all show the inclination to dress fashionable than others, or pursuit of latest trend, fashion event. For this reason, factor3 was named the status factor.
Table 4-7 Factors included in Factor3
Number Item Factor loading
A16 I like to dress in the latest fashions .87
A10 I dress more fashionably than most people .82