國 立 交 通 大 學
資訊科學與工程研究所
碩 士 論 文
於 MIMO-OFDM 之數位訊號型成波束之設計與分析
Design and Analysis of Digital Beamforming
in MIMO-OFDM Modem
研 究 生:張卉萱
指導教授:許騰尹 教授
於 MIMO-OFDM 之 數 位 訊 號 型 成 波 束 天 線 之
設 計 與 分 析
Design and Analysis of Digital Beamforming
in MIMO-OFDM Modem
研 究 生:張卉萱 Student:Huei-Syuan Chang
指導教授:許騰尹 Advisor:Terng-Yin Hsu
國 立 交 通 大 學
資 訊 科 學 與 工 程 研 究 所
碩 士 論 文
A ThesisSubmitted to Institute of Computer Science and Engineering College of Computer Science
National Chiao Tung University in partial Fulfillment of the Requirements
for the Degree of Master
in
Computer Science
Hsinchu, Taiwan, Republic of China
i
摘要
波束成型(digital beamforming)是一個由多根天線產生一個有全向性波束的 技術,其目的是為了可以提高訊號的品質消除其他訊號之干擾,並提升在多輸入 多輸出 (MIMO) 的傳輸系統效能。 本篇論文提出一個方法來搜尋訊號入射角的角度,此演算法是利用接收端所 收到的訊號做能量之分析,藉由偵測到不同角度的能量,來調整波束的角度。另 一方面在波束角度,我們利用權重向量來做調整,提升訊號的強度並衰減其他干 擾之訊號,即可提升訊號的品質。在3GPP Long-Term Evolution(LTE) 的系統平台且符合 Spatial Channel Model (SCM)所規範的通道模型中模擬。模擬結果指出此演算法和未使用全向性波束的 技術效能相比,可發現訊號的強度對效能之影響,提高整體系統的效能。以上皆 是應用在多輸入多輸出的傳輸系統平台。
ii
Abstract
Digital beamforming in MIMO-OFDM system is an efficient way to improve the performance. It emphasized that the signals of interest and minimize interfering signals. Using received signals and controlling the beam pattern is used to steering the direction of maximum gain.
In this paper, the estimation of arrival of angle (AOA) is proposed. This method used the correlation power of transmitted signals by searching the maximal quality at received. In addition, it could find an arrival angle on received-end and used weighting vector to adjust angle of beam pattern to steering them. Weighting vector can promote signals of interest quality and improve SINR (Signal Interference Noise Ratio), increasing performance.
The simulation platform is 3GPP Long-Term Evolution (LTE) with Spatial Channel Model (SCM) channel. It showed that the proposed algorithm with digital beamforming is better than with the unused digital beamforming system. All of these simulations are in MIMO-OFDM 4×4 platform.
iii
誌謝
能完成這篇論文,首先要感謝我的指導教授許騰尹老師。老師很有耐心引導 我如何獨立思考,培養解決問題的能力。亦特別感謝 ISIP Lab 的同學和學長們, 因為大家的互相幫忙,分享和指導,讓我在研究的過程中獲益良多。最後感謝交 通大學提供良好的研究環境和家人的支持與鼓勵,讓我的碩士學業能順利的完 成。 張卉萱 謹誌 民國九十九年八月二十五日iv
Table of Contents
摘要 ... i
Abstract ... ii
誌謝 ... iii
Table of Contents ... iv
List of Figures ... v
List of Tables ... vi
Chapter 1 Introduction ... 1
1.1 Digital Beamforming ... 1Chapter 2 System Platform ... 4
2.1. LTE PHY Specification ... 4
2.3. System Description... 10
2.4. Problem Statement ... 11
Chapter 3 The Proposed Digital Beamforming Algorithm ... 13
3.1 Digital Beamforming Block ... 13
3.2 Introduction to Detect Algorithm ... 14
3.3 Detection Algorithm ... 15
3.4 Weighting Vector ... 21
Chapter 4 Simulation ... 24
Chapter 5 System Architecture ... 30
Chapter 6 Conclusions ... 33
v
List of Figures
Fig. 1.1 A generic digital beamforming system ... 2
Fig. 1.2 Digital beamforming networks ... 3
Fig. 2.1 LTE MIMO transmitter ... 5
Fig. 2.4 LTE sub-frame format ... 7
Fig. 2.5 LTE resource block format ... 8
Fig. 2.6 Block diagram of channel model ... 8
Fig. 2.6 Example of Laplacian AoA (AoD) distribution, cluster, AS = 30 ... 10
Fig. 2.7 The system description of the MIMO-OFDM system ... 11
Fig. 3.2 All transmitter signals on receiver end on digital beamforming system ... 15
Fig 3.4 CIR of receiver ... 18
Fig 3.5 Auto-correlation structure ... 18
Fig. 3.6 Determine region to estimate AOA ... 19
Fig. 3.8 The example which showed searching region (AOA of last step = 130 ) .... 21 o Fig. 4.1 SER of digital beamforming technique for 64QAM modulated 4×4 MIMO OFDM systems ... 25
Fig. 4.2 BER of digital beamforming technique for 64QAM modulated 4×4 MIMO OFDM systems ... 26
Fig. 4.3 Different beam angle effects multipath ... 27
Fig. 4.4 Difference of tap1 and tap2 AOA is 4o, BER of digital beamforming technique for 64QAM modulated 4×4 MIMO OFDM system ... 27
Fig. 4.5 Difference of tap1 and tap2 AOA is 7o, BER of digital beamforming technique for 64QAM modulated 4×4 MIMO OFDM system ... 28
Fig. 4.6 Difference of tap1 and tap2 AOA is 10o, BER of digital beamforming technique for 64QAM modulated 4×4 MIMO OFDM system ... 29
Fig. 5.1 Architecture of proposed algorithm ... 31
Fig. 5.2 Cross-correlation ... 31
Fig. 5.3 Auto-correlation ... 32
vi
List of Tables
TABLE I Related works ... 12
TABLE II It is an example that a path has 6 taps in channel ... 21
TABLE III Possible Angle_X and Angle_Y ... 21
TABLE IV Simulation Parameter ... 24
TABLE V Comparison with other algorithms ... 29
1
Chapter 1
Introduction
In order to get high transmission rate and guaranteed quality of service has grown rapidly in wireless communication system. Transmission by means of orthogonal frequency division multiplexing (OFDM) can be seen as a kind of multi-carrier transmission. ‘OFDM has developed into a popular scheme for wideband digital communication, It is feasible to insert a Cyclic Prefix (CP) between the OFDM symbols, thus eliminating the inter-symbol interference. OFDM has used in applications such as digital television and audio broadcasting, wireless networking and broadband internet access. Recently, OFDM has been adopted as the downlink transmission scheme for 3GPP Long-Term Evolution (LTE).
Multiple-Input Multiple-Output (MIMO) system with antenna arrays is equipped at both the transmitter and receiver with a signal processor. Antenna arrays not only improve the high-bit-rate transmission and increase the performance of system over multipath fading channel, but also exploit the interference suppression. Therefore, the combination of MIMO and OFDM increase the diversity gain and enhance the system capacity on frequency-selective channels.
Multiple antenna techniques are considered as the promising technique for the high spectral efficiency. The space division multiple access (SDMA) is one of multiple antenna technique, it increases system capacity and signal quality by digital beamforming and null interference operations. The digital beamforming presents as follows.
1.1 Digital Beamforming
2
arrays for directional signal transmission or reception. It can adjust or adapt its own beam pattern in order to emphasize signals of interest and to minimize interfering signals. In early applications, it works in Sonar and Radar system. Now it can be applied to communications for improving system performance. Furthermore, DBF will be increasing capacity into future wireless communications system.
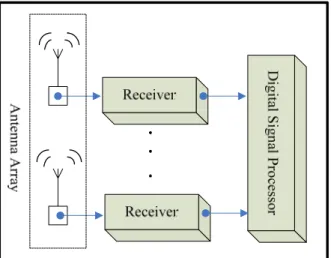
A generic DBF antenna system shows in Fig. 1.1. It consists of three components: the antenna array, the digital receivers, and the digital signal processing.
Digital beamforming is based on the RF signals and each antenna elements into two binary baseband signals cosine and sine wave. It can use two baseband signals to find amplitude and phase of signals at each received antenna. The process of beamforming is used weighting vector to change received signals, like adjust amplitudes and phase of signals. Those combine signals to forming the desired output. The key of this technology is the accurate translation of the analogy signal into digital region. An optimum antenna is that conversion of arrival signals can’t distort. Therefore, digital beamforming antenna can be considered to be an optimum antenna.
Fig. 1.1 A generic digital beamforming system
Fig. 1.2 depicts two kinds of simple beamforming structures. The process represented in Fig. 1.2 (a) is referred to as element-space beamfroming, where the
3
data signals from the array elements are directly multiplied by a set of weights to form the desired beam. By selecting appropriate values for the weighting vector, one can implement beam steering, adaptive nulling and beamshaping. The beam-space process in Fig. 1.2 (b) is that output of each beam can then be weighted and the result combined to produce a desired output.
In this paper, the contribution is that use the auto-correlation value to detect the arrival of angle in digital beamforming system. By calculating the weighting vector adjusts beam pattern to steer them, canceling the interference signals and minimizing multipath.
(a) Element-space beamfroming
(b) Beam-space digital beamforming Fig. 1.2 Digital beamforming networks
4
Chapter 2
System Platform
This chapter is going to describe complete simulation environments form MIMO-OFDM specification of LTE PHY layer with the SCM channel model. The system operates in 20MHz spectrum allocation.
Section 2.1 describes the 4×4 MIMO transceivers, the signaling flow of LTE and the MIMO encoder/decoder.
2.1. LTE PHY Specification
Orthogonal Frequency Division Multiplexing (OFDM) is a kind of multi-carrier transmission, which achieves high data rate and combat multi-path fading in wireless networks. The main of OFDM is that data is divided into several parallel data streams or channels. Its ability to cope with several data streams simultaneously, thus achieve a high spectral efficiency. In addition, one for each sub-carrier carries individual data, and the equalizer can be implemented with low complexity in frequency domain.
2.1.1. Transmitter
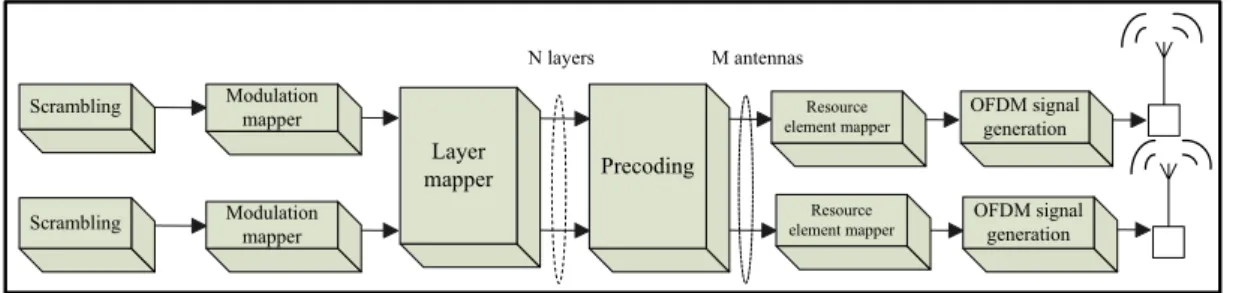
Fig. 2.1. depicts that the architecture of MIMO-OFDM transmitter in LTE specification proposal. The initial scrambling stage serves in the purpose of interference rejection. Scrambling sequence can be generated by a shift-register implementation, and then the scrambled bits pass through modulation block to generate complex-valued modulated symbols.
The layer mapping is the function to establish a mapping of the complex-valued modulation symbols onto one or several transmission layers. Basically a layer corresponds to a spatial multiplexing channel.
5
The pre-coding extracts exactly one modulation symbol from each layer, jointly process these symbols, mapping the result in the frequency domain and antenna domain.
The resource-block mapped divides the transmitted symbols into the resource elements of the set of resource blocks on each antenna. The resource block is assigned by the MAC scheduler for transmission of transport block(s). To transform the signal after modulator in frequency domain constellations into time-domain constellations, Inverse Fast Fourier Transform (IFFT) is used. There are 1024 frequency entries for each IFFT, or 1024 sub-carriers in each OFDM symbol. 600 of them are data carriers, the rest 423 are null carriers. Finally, the time domain signals, appended to the Cyclic Prefix (CP) of 144 or 160 sub-carries, are transmitted by RF modules.
Scrambling
Scrambling OFDM signal
generation Modulation mapper Modulation mapper Resource element mapper Resource
element mapper OFDM signalgeneration Layer
mapper Precoding
N layers M antennas
Fig. 2.1 LTE MIMO transmitter
2.1.2 Receiver
The receiver block diagram is shown as Fig. 2.2. Assume the dipole antenna is used to receive signals from the RF module, the first step is synchronization to recognize each OFDM symbol, and then transport block(s) are transformed signal streams by resource element mapper. Through the digital beamforming function block, the proposed algorithm can control the signals to received large energy. After the proposed algorithm, each OFDM symbol is transformed to frequency domain by the Fast Fourier Transform (FFT). If the OFDM symbol belongs to reference signal (described in section 2.1.4), then it is used for channel estimation.
6
In order to restore the original signal shape, the equalization is used to adjustment and is designed to compensate for the unequal frequency response of some other signal processing circuit or system. The signal streams are through de-precoding and equalization, and then these combine signal streams by layer mapper.
After separation by decoder, the signal streams are de-modulated to bit-level streams. These bit-level data streams merge into the two data streams after layer de-mapper and de-modulation. Finally, the data streams are de-scrambler.
Fig. 2.2 LTE receiver
2.1.3 Receiver moving
In communication system of daily life, receiver and transmitter are as well mobile and base station respectively. The mobile device has own position by mobility, the bean pattern would trace desired signal to adjust AOA of detection. In order to simulate the mobility, AOA of signal increases 10o in every 5 subframes.
2.1.4 Frame Format
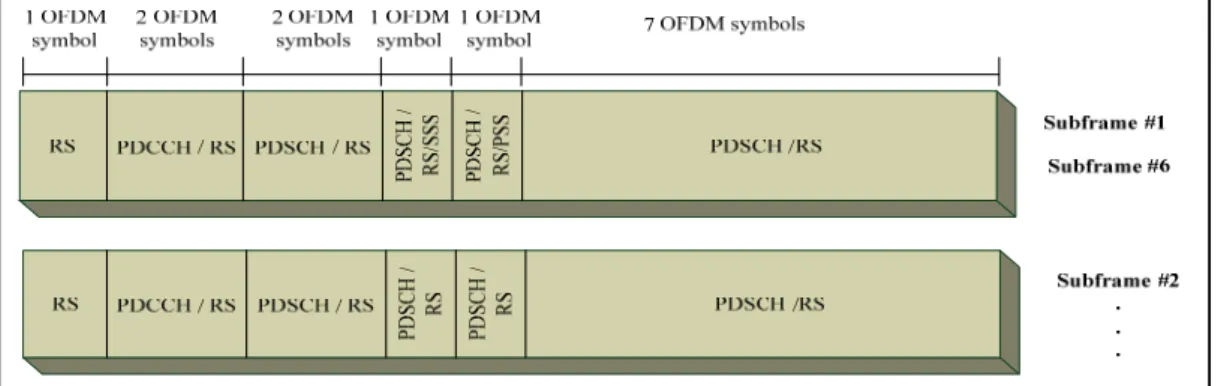
The frame and sub-frame format are shown as Fig. 2.3. and Fig. 2.4. The radio frame is comprised of 10 sub-frames. A sub-frame consists of Physical Downlink Share Channel (PDSCH), Reference Signal (RS) and Physical Downlink Control Channel (PDCCH). PDSCH is used for all user data, as well as for broadcast system information. Data is transmitted on the PDSCH in units known as transport blocks.
7
PDCCH carries a message known as Downlink Control Information (DCI), which includes resource assignments and other control information for a UE or group of UEs. RS(s) are known signals which do not carry any data. It can be used to do channel estimation. Each sub-frame has 14 OFDM symbols, and then each symbol has 12 sub-carries. Fig. 2.5 describes that Sub-carries be filled in resource block in turn. Especially, first and sixth sub-frame for downlink is that these sub-frames include the LTE synchronization signals (SS). The SS (s) are transmitted on downlink of each cell and are intended to be used for initial cell search as well as for neighbor-cell search.
Fig. 2.3 LTE frame format
8
Fig. 2.5 LTE resource block format
2.2.
Channel Model
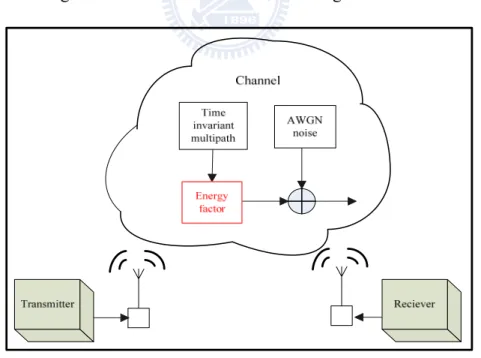
There are many imperfect effects during transmitted signals through channel, time invariant multipath energy factor and Additive White Gaussian Noise (AWGN), and so on. The block diagram of channel model is shown in Fig. 2.6.
Fig. 2.6 Block diagram of channel model
9
Additive white Gaussian noise (AWGN) comes from many natural sources, such as the thermal vibrations of atoms in antennas, "black body" radiation from the earth and other warm objects, and from celestial sources such as the sun. The AWGN channel is a good model for many satellite and deep space communication links. On the other hand, it is not a good model for most terrestrial links because of multipath, terrain blocking, interference, etc. The signal distorted by AWGN can be derived as
( ) ( ) ( )
r t =s t +n t
where ( )r t is received signal, s t( ) is transmitted signal, ( )n t is AWGN.
2.2.2 Energy Factor
Digital beamforming is able to enhance the received signal form the transmitter and minimize unwanted interferences. The digital beamforming uses beam pattern on the receiver end to get the distinct strength of signal on the different directions of arrival. In this paper, the energy factor is used to simulate the digital beamformer behavior.
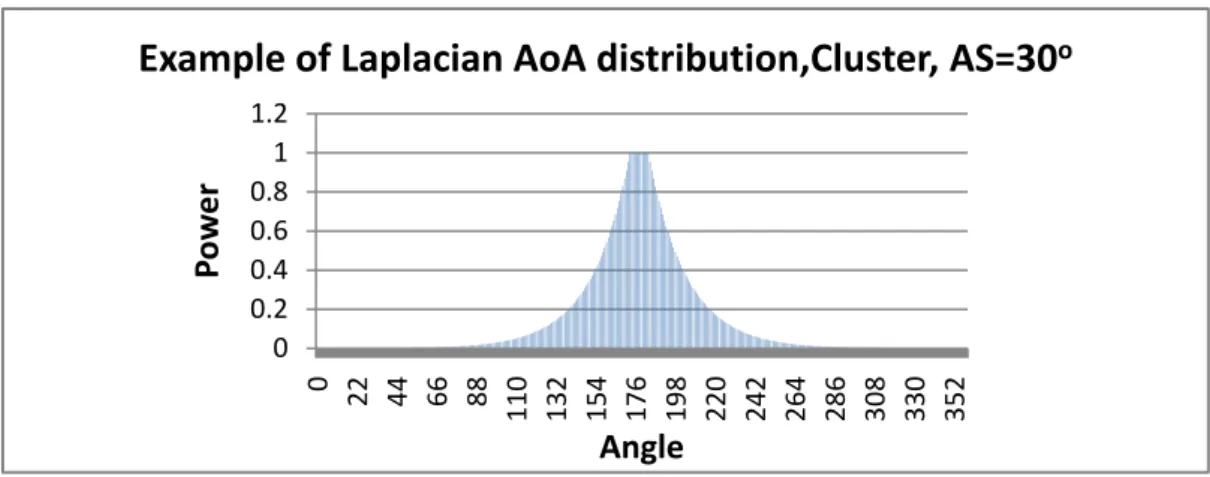
The energy factor is defined as the channel strength of each multipath. For example, every path has 6 taps which the individual strength is differently. In the receiver, the assumption is that all antennas have the same angle of arrival AOA. Laplacian distribution is used to generate the power angular spectrum. Each channel tap exhibits Laplacian power azimuth spectrum (PAS) in the domain and the angular spread (AS) is the second moment of PAS. The shape is ( ) 1 2 /
2
p φ e φ σ
σ
−
= where Φ is azimuth
angle and σ is Angular Spread (AS). Fig. 2.6 is the example of Laplacian distribution. The horizontal axis denotes arrival degree and the vertical axis is the power of signal. In the received end, the beam pattern is used to scan transmission environment. If the direction-of-arrival (DOA) of the signal-of-interest (SOI) is searched, the beam
10
pattern has adjusted to focus on the SOI while turning the SOI has large signal strength.
Fig. 2.6 Example of Laplacian AoA (AoD) distribution, cluster, AS = 30
2.3. System Description
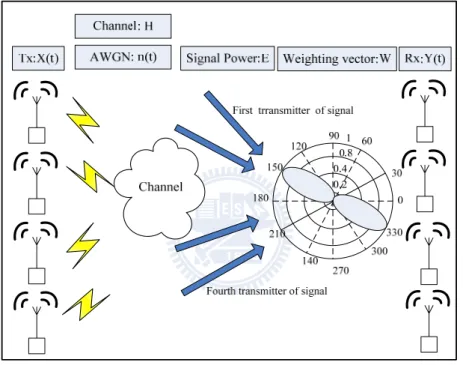
Fig. 2.7. described a MIMO-OFDM system. In a NT x NR spatial multiplexing
MIMO system, NT and NR are number of transmitted and received antennas. The data
is encoded by scrambler, N-QAM modulation, layer mapper, precoding and transmitted over the NT antennas simultaneously. Assuming channel is far-field, it
indicates all received antennas which view same AOA of multipath and the received based signal for NT x NR MIMO system is modelled as following:
((
E h
ij)
X
)
W
=
×
⊗
×
+
Y(t)
(t)
n(t)
………. (1) 111 121 131 141 116 126 136 146 6 211 221 231 241 216 226 236 246 1 6 1 311 321 331 341 316 326 336 346 411 421 431 441 416 426 436 446 ... ij k ijk k H H H H H H H H H H H H H H H H E h E h E E H H H H H H H H H H H H H H H H = ⎡ ⎤ ⎡ ⎤ ⎢ ⎥ ⎢ ⎥ ⎢ ⎥ ⎢ ⎥ × = × = × + + × ⎢ ⎥ ⎢ ⎥ ⎢ ⎥ ⎢ ⎥ ⎣ ⎦ ⎣ ⎦∑
where E is energy factor of multipath, k
k
is number of multipath, W is weightingvector (section 3.4 described it) . ( is mean transpose ) is the transmitted signal which modulated with N-QAM constellation in the i-th transmitted
0 0.2 0.4 0.6 0.8 1 1.2 0 22 44 66 88 110 132 154 176 198 220 242 264 286 308 330 352 Po w e r Angle
Example of Laplacian AoA distribution,Cluster, AS=30
o 1, ,...,2 T T N x x x ⎡ ⎤ = ⎣ ⎦ x[ ]
*T11
antenna in the transmitted signal space; is received signals vector and indicates Gaussian noise. Gaussian noise can take Gaussian-distributed. It’s most commonly used as additive white noise. Moreover, the frequency selective fading is indicated by the NR×NT channel matrix H, whose
elements
h
ijk represent the complex transfer function from the j-th transmit antenna to the i-th receive antenna and k-th multipath tap.Fig. 2.7 The system description of the MIMO-OFDM system
2.4. Problem Statement
In the digital beamforming system, the analysis issues is that the signal quality and how to detect the arrival of angle in digital beamforming system. If beam pattern alteration by calculating weighting vector, which eliminate the interference signals and emphasize the interest signals, the system can improve how much gain better then without the digital beamforming technique.
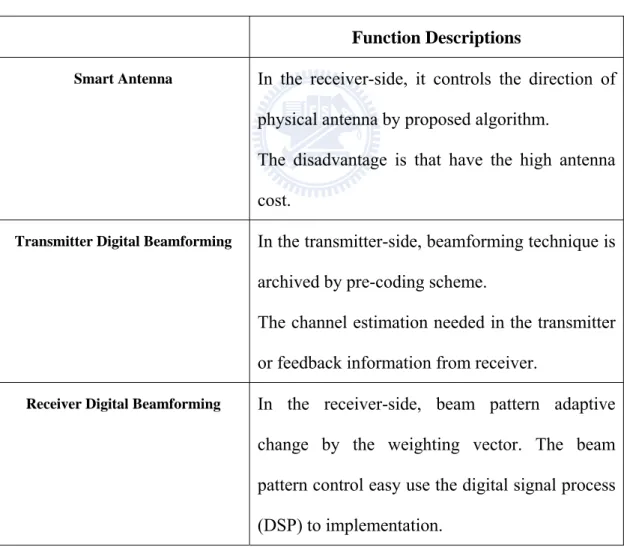
TABLE I showed 3 several digital beamforming methods. The comparison shows
1, ,...,2 R T N y y y ⎡ ⎤ = ⎣ ⎦ y 1, ,...,2 R T N n n n ⎡ ⎤ = ⎣ ⎦ n
12
the advantage and disadvantage of these methods. Smart antenna has highly cost transmitter digital beamforming which need to know channel information. In this paper, the receiver digital beamforming is adopted. It only uses digital signal process (DSP) and algorithm to receive signal.
Section 3 proposes an algorithm to detect the arrival of angle and discuss the related problems. It calculates weighting vector to select beam pattern in digital beamforming techniques.
TABLE I Related works
Function Descriptions
Smart Antenna In the receiver-side, it controls the direction of
physical antenna by proposed algorithm.
The disadvantage is that have the high antenna cost.
Transmitter Digital Beamforming In the transmitter-side, beamforming technique is
archived by pre-coding scheme.
The channel estimation needed in the transmitter or feedback information from receiver.
Receiver Digital Beamforming In the receiver-side, beam pattern adaptive
change by the weighting vector. The beam pattern control easy use the digital signal process (DSP) to implementation.
13
Chapter 3 The Proposed Digital
Beamforming Algorithm
In the standard of LTE, some MIMO-OFDM symbols have reference signal (RS), primary synchronization signals (PSS) and second synchronization signals (SSS). These are used to check the signal arrival or not, or estimate arrival angle of signal. In this proposed algorithm, the received symbols are used to calculate correlation value. According to correlation value, the signal arrival of angle can be find out. The information of correlation value can used to calculate weighting vector and to control beam pattern angle which steer the AOA of maximal correlation value. It can enhance desired the signal, dminish inference signals, and minimize multipath which can improve performance.
Section 3.2 and section 3.3 detail indicate that the proposed algorithm is how to detect the arrival of angle. Finally, the digital beamforming technique is employed to minimize multipath in section 3.4.
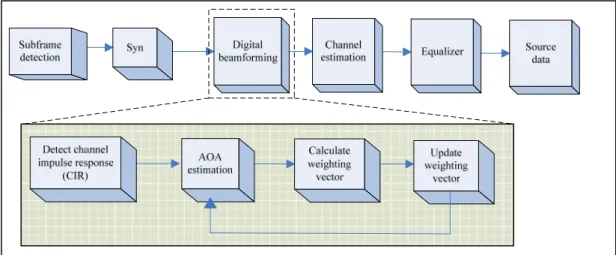
3.1 Digital Beamforming Block
Fig 3.1 is the block diagram of digital beamfomring. Digital beamforming is separate into the four functions. The functions are detect channel impulse response, AOA estimation, weighting calculate, and weighting update, respectively. The detector of channel impulse response, which assists the AOA estimation in detecting the best arrival angle, is the first function in the receiver. The AOA estimation is one of the major component that is effect the performance of receiver. The precision of the AOA estimation is considered in this function. The method use the AOA after estimation to calculate weighting and to update the beam pattern.
14
Considering the method of weighting, the goal is that the method can automatically maximize the SINR and enhance quality. The weighting degraded all interference by placing nulls at AOAs of interference and multipath. The block of weighting calculates is always to do this.
Fig. 3.1 Digital beamforming block diagram
3.2 Introduction to Detect Algorithm
When sub-frame detection is detected the signal and boundary detection is determined the starting of the symbol, the front end algorithms are complete the timing and frequency synchronization. The assumption is that the best timing and frequency are reached after the front end algorithms. The idea reference signals (RS), primary synchronization signals (PSS), second synchronization signals (SSS) of received signals is used to calculating the correlation value. The correlation value can examine the relative signal level. If the correlation value is large, it cans be expressed that the signal is coming which can decoded at the known sub-carries.
For example, the received signals are combined the all of transmitter signals that come from the difference transmitters. Due to each signals suffers interference by others, the dirty signal after interference cannot recognized rapidly and accurately. When beam pattern has been weighted to steer desired signal and to minimize
15
multipath effect, the receiver adjusts the higher gain for interest signal to receive the large power and better qualities signal. The correlation values are used to quantize the received power level that indicates the signal come from. According the correlation property, the maximum correlation value means the arrival of angle of the largest received power. Finally, the beam pattern is adjusted to this arrival of angle.
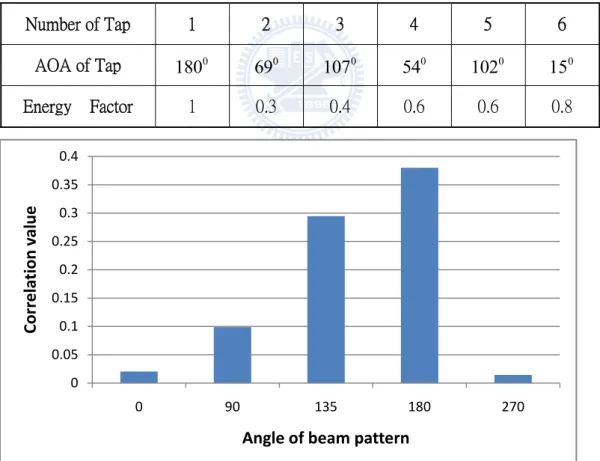
In Fig. 3.2, the example is that the tape of multipath is six and AOA of main tap is 180o. Using the switch beam with different angle, the correlation values of different angle are calculated. After the calculating the correlation value, the angle of beam pattern is 180o that the signal receives the largest power, so we can estimate AOA of the signal is 180o.
Number of Tap 1 2 3 4 5 6
AOA of Tap 180 0 69 0 107 0 54 0 102 0 15 0
Energy Factor 1 0.3 0.4 0.6 0.6 0.8
Fig. 3.2 All transmitter signals on receiver end on digital beamforming system
3.3 Detection Algorithm
The proposed algorithm has three steps to estimate AOA of signal:
0 0.05 0.1 0.15 0.2 0.25 0.3 0.35 0.4 0 90 135 180 270 Corr ela tion va lu e Angle of beam pattern
16
1. Using SSS calculate the cross-correlation value to find CIR, and then find 2 taps of maximal and second largest power.
2. Initiation of the beam pattern steers 0 , 0 180 , 0 0
90 and 270 , the PSS is used to 0
calculate four auto-correlation values which determine the possible region of received signal AOA. Finally, the RS calculates auto-correlation value to find AOA accurately as well.
3. In order to get clearly received signal, the two 2 taps of maximal power and second largest use the formula to find possible AOA of signal.
Step1: Use SSS to calculate cross-correlation value to find CIR
Assume that the signals from every transmitter that these arrive the received end at the same time are distorted by channel effect. The channel impulse response can simply detected to know the channel variation. The cross-correlation achieve to detect the channel variation.
Correlation, a mathematical tool, is used in signal processing for analyzing the series of values, such as time domain signals. Correlation is one of the most common function and the most useful statistics. The cross-correlation is used to find the relation of two different signals.
The correlation matrix is represented by calculating the parallel cross-correlation of the received signal R ki( ) and the known PSS training sequence ( )Q k to be
reference. Fig. 3.3 describes the correlation value how to generate by proposed cross-correlation architecture. These parameters are illustrated in later.
17
Fig. 3.3 Cross-correlation structure
1 2 3 2 1 (1) (2) (3) ( 2) ( 1) ( ) ( ) (62) (1) (2) ( 3) ( 2) ( 1) ( ) (61) (62) (1) ( 4) ( 3) ( 2) ( ) ( ) ( ) ( ) ( ) L L L PSS PSS PSS PSS B PSS B PSS B Q k PSS PSS PSS PSS B PSS B PSS B Q k PSS PSS PSS PSS B PSS B PSS B Q k Q k Q k Q k Q k − − − − ⎡ ⎤ − − − ⎢ ⎥ − − − ⎢ ⎥ ⎢ ⎥ ⎢ ⎥ =⎢ ⎥= ⎢ ⎥ ⎢ ⎥ ⎢ ⎥ ⎢ ⎥ ⎣ ⎦ L L L L L L L L L M M M M O M M M M M O M M M O (4) (5) (6) ( 1) ( 2 (3) (4) (5) (2) (3) (4) PSS PSS PSS PSS B PSS B PSS PSS PSS PSS PSS PSS + + M M M M M M M L L L L L L L L L ) ( 3) ( ) ( 1) ( 2) ( 1) ( ) ( 1) PSS B PSS B PSS B PSS B PSS B PSS B PSS B ⎡ ⎤ ⎢ ⎥ ⎢ ⎥ ⎢ ⎥ ⎢ ⎥ ⎢ ⎥ ⎢ ⎥ ⎢ ⎥ ⎢ ⎥ ⎢ + ⎥ ⎢ ⎥ + + ⎢ ⎥ ⎢ − + ⎥ ⎣ ⎦
The parallel cross-correlation with each Q kL( ) indicates the correlation power is
, ( ) i L CP k .
[
]
. 0 ( ) ( 1), ( 2), ( 3),... ( ) ( 1) ( 1) i L i i i i i B i L L CP k p R k B R k B R k B R k R k B Q k B = = − + − + − + =∑
− + ∗ − +The cross-correlation value of receiver is used to find CIR. In Fig. 3.4, fining largst value and second largest value register as Tap1 and Tap2, and these are used
regi the the corr and Step2:Use ion Auto-co presence of parallel au relation buff AP S1 In order to beam pat PSS to cal orrelation is f a periodic uto-correlati ffer2, the au
[
. 0 ( ) i L i B L P k p R = = =∑
co co S2 . . . correlation b find largest ttern to ste Fig lculate four s the correla c signal whi ion is corre utocorrelatio ( 1 ( 1) i i R k B R k B − + − + orrelation buffe orrelation buffe S6 S61 S60 buffer 1 Size 62 Fig 3.5 A t power of s eer 00, 18 18 3.4 CIR of r auto-corr ation of a s ich has bee elation of a on power is 1), ( ( i i R k B R k B − + ∗ − + er 1 fer 2 62 S1 Received sign Auto-correla signal, the s 0 80 , 900 a receiver relation val signal with n buried un a signal wit , ( ) i L AP k . 2), ( 1) i R k B + − + S2 . . . correlation Auto correlation nals ation structu search regio and 2700 . lues to dete itself, such nder noise. th correlati 3),... (i B+ R S61 S60 n buffer 2 ure on is divided In Fig. 3 ermine poss as determi Fig 3.5 sho on buffer1]
) k S62 Power d four segm 3.6 shows sible ning owed and ments that19
auto-correlation value is calculated of four different AOAs, and finding largest and second largest power values determine the regions. Fig. 3.7 is represented the four regions: region1, region2, region3 and region4.
0 0.05 0.1 0.15 0.2 0.25 0.3 0.35 0.4 0 90 180 270 Co rr ela tio n V alue
Angle of beam pattern
Fig. 3.6 Determine region to estimate AOA
0 0.05 0.1 0.15 0.2 0.25 0.3 0.35 0.4 0 90 135 180 270 Co rr e la ti o n v a lue
Angle of beam pattern
0 0 0 180 0 90 0 270 0 135
Fig. 3.7 Estimate AOA in the region
After determining the best region, Fig. 3.7 shows that the beam pattern is adjusted the AOA at the half of best region. The RS is used to calculate two partition of auto-correlation value, and then the searching region can reduce half region.
20
Step3: By two taps of maximal power and second largest, find possible AOA of signal
Finally, the pervious step find the AOA of maximal power, it has the limited improve the system performance. Although the AOA of half the best region that is between AOA of maximal tap and AOA of second largest tap is found, the received signal is not purely clear. It might be restrict the region of improvement. Therefore, the goal is that the AOA of pure signal is searched in the last step. The receiver of system performance can get the maximum gain.
In Step1, find two taps of maximal and second largest power (Tap1, Tap2).
1
Tap is value of maximal tap and Tap is value of second largest tap. Using 2 Tap1
and Tap2 value of impulse response, the substitution formula (2) can be written as:
1* _ 2* _
_
2
Tap Angle X Tap Angle Y
temp AOA= +
………..(2)
where temp AOA_ is last step to estimate AOA, Angle_ X is angle of Tap1,
_
Angle Y is angle of Tap2.
In order to finding the all possible AOAs, the binary search is used to find _
Angle Y and to estimate Angle_X . TABLE II describes an example. The search
AOA is 130o after step two in Fig.3.8. Using the formula (2) find all possible of _
Angle X and Angle Y_ . TABLE III illustrates this situation. According the
auto-correlation value of Angle_ X , the maximum value is used to decide the best
21
TABLE II It is an example that a path has 6 taps in channel
Number of Tap 1 2 3 4 5 6
AOA of Tap 69 0 188 0 107 0 54 0 102 0 95 0
Energy Factor 0.3 1 0.4 0.6 0.6 0.8
TABLE III Possible Angle_X and Angle_Y
_ Angle Y 85o 175 o 107 o 152 o 130 o 96 o 141 o 163 o 118 o _ Angle X 217 o 173 o 206 o 184 o 196 o 212 o 189 o 178 o 201 o Search region 180 0 45 130 45 90 270 o o o o o o o
Fig. 3.8 The example which showed searching region (AOA of last step = 130 ) o
3.4 Weighting Vector
3.4.1 Weighting Calculate
Weighting vector is combined gain and steer vector (Fig. 3.9). The Kaiser-Bessel function (formula (3) ) is used to calculate gain which can enhance strength of desired signal. The formula (4) is Steer vector, it will adjust beam pattern to steer estimate AOA and minimize unwanted signal.
22 2
1
/ 2
*
l ll
N
w
u
π
π
⎡
⎛
⎞
⎤
⎢
− ⎜
⎟
⎥
⎝
⎠
⎢
⎥
⎣
⎦
=
l =0,1…..,N/2 ...…………...(3) 2( ) sin( )
2
cos
ll
d
u
θ
λ
⎡
⎛
⎞
⎤
⎜
⎟
⎢
⎝
⎠
⎥
=
⎢
⎥
⎢
⎥
⎢
⎥
⎣
⎦
……….. (4)N is number of receiver antenna, d is element distance and θ is estimate AOA .
Fig. 3.9 the description of weighting vector
3.4.2 Update Weighting
According the weighting vector, the receiver signals can multiple the weighting
and combine it to create the new signals. Fig. 3.10 is the architecture of the weighting calculating. It uses a weighting vector to update the signals. Fig. 3.11 describes that the proposed algorithm found the large energy of interest tap signal and the less energy of others.
If the weighting vector can minimize multipath signal, it can improve the system performance. In section 4, the BER, PER and other performance are indicated.
23 0 0 0 180 0 90 0 270 1( ) y t 2( ) y t 3( ) y t 4( ) y t ( ) Y t 1 θ W1 2 W 3 W 4 W 2 θ
Fig. 3.10 Weighting calculate
0 0.2 0.4 0.6 0.8 1 1.2 17 45 109 46 93 186 En er gy Fa ct or Angle Power of Reciever Original Power o o o o o o
24
Chapter 4
Simulation
Matlab is used to simulate language. The MIMO-OFDM system based on 3GPP Long-term Evolution (LTE), Spatial Channel Model (SCM) Specification, is used as the reference simulation platform. The major parameters are shown in TABLE IV
TABLE IV Simulation Parameter
Parameter Value
Number of antennas 4Tx and 4Rx
Signal bandwidth 20 MHz
Carrier frequency 2.4 GHz
Number of subcarrier 168
Subcarier modulation 64 QAM
Subframe size 1 ms
Channel Model SCM model_C
Number of taps 6
Equalization Zero-Forcing
FFT size 1024
The proposed algorithm is that estimate AOA and using weighting vector to emphasize interesting signal, minimizing multipath signals. In this simulation platform, all simulation results compared with the worst performance without using digital beamforming technique. If using the proposed algorithm, the beam pattern can be to steer desired estimation of AOA and to diminish multipath. It can improve the performance. The best case is beam pattern to steer perfect AOA.
The criterion of AOA estimation algorithm is that the accuracy of AOA estimation angle. The proposed algorithm of estimation AOA approximates to the acute angle around 2o~5o error. To compare AOA of estimation and idea AOA, it loses few values. The reason is that the power of signal is spreading by 5± , the estimation error of o
25
proposed algorithm has less than 5± of ideal AOA. In the 5° ± range, the power of ° interference signal has been degraded. The AOA of estimation can updating the weighting vector, changing beamforming pattern to receive desired signal and suppress multipath. It can improve the performance and get the clearly and largest power signal. In this thesis, the BER and PER shows the system performance.
In Fig. 4.1, there shows comparison of three cases,idea case, the proposed case and worst case. All of these are simulated in 4 transmit antennas and 4 receive antennas. In this figure, the without beamforming technique, it has worst performance because the received-end gets less energy of signal and suffer from serious multipath effect. By using proposed algorithm, performance has improved obviously. The curves of BER on Fig. 4.2, the proposed algorithm with digital beamforming has to approach the best method within 2 dB. But the result shows that the digital beamforming system has 16 dB better than without digital beamforming system.
Fig. 4.1 SER of digital beamforming technique for 64QAM modulated 4×4 MIMO OFDM systems
26
Fig. 4.2 BER of digital beamforming technique for 64QAM modulated 4×4 MIMO OFDM systems
In Fig 4.3, if energy factor of largest power and second largest power closed, idea beamforming possible doesn’t have better performance. Because the 1st largest power of AOA is similar to 2nd largest power of AOA, the attenuation of multipath is unobvious. For example, assume the ideal beam angle is 93 degree, the 90 degree beam angle after proposed algorithm decision. In some case the proposed algorithm has better performance than ideal beam angle. Fig. 4.4 shows that the BER under the difference of 1st and 2nd is 4o. Fig. 4.5 indicates that the 1st and 2nd have ≤7o interval.
The summary is that the difference of 1st and 2nd is 10≤ o which might the proposed
algorithm has well enough to estimation the best AOA under the serious multipath condition. In Fig. 4.6, if the interval between the 1st of AOA and 2nd of AOA is 10≥ o,
Tap1 Fig. 4.4 tec Tap2 93 1 Fig. Difference chnique for Tap3 71 0.6 4.3 Differen of tap1 and 64QAM m 27 Tap4 97 0.8 nt beam ang d tap2 AOA modulated 4× Tap5 237 0.5 gle effects m A is 4o, BER ×4 MIMO O 5 Tap6 1 0.3 multipath of digital b OFDM syste 6 116 0.2 beamformin em ng
28
Tap1 Tap2 Tap3 Tap4 Tap5 Tap6
93 71 100 237 1 116
1 0.6 0.8 0.5 0.3 0.2
Fig. 4.5 Difference of tap1 and tap2 AOA is 7o, BER of digital beamforming technique for 64QAM modulated 4×4 MIMO OFDM system
Tap1 Tap2 Tap3 Tap4 Tap5 Tap6
93 71 100 237 1 116
29
Fig. 4.6 Difference of tap1 and tap2 AOA is 10o, BER of digital beamforming technique for 64QAM modulated 4×4 MIMO OFDM system
TABLE V Comparison with other algorithms
Ref [4] Ref[5] Ref[6] Proposed
Work
System Type MIMO-OFDM
STBC,BPSK MIMO-OFDM BPSK MOMO-OFDM QPSK MOMO-OFDM 64QAM Perfect Channel Signals have Gaussian waveform Known perfect channel Known perfect channel Random arrive of channel Numbers of Antenna 2×2 4×4 4×4 4×4 FFT Size N/A 128 1024 1024 Fading Channel Rayleigh block fading Frequency selection fading SCM channel SCM channel (6 taps) Performance loss 3 dB < 1 dB 4 dB 2 dB
30
Chapter 5
System Architecture
The received signals pass through the FFT window to acquire the frequency response of training signal. The major component is the register-based correlation at frequency domain in the proposed algorithm architecture. This component is hugely used in the AOA estimation. In Fig. 5.1, the architecture includes three modules; region divider and correlation, coarse search of AOA estimation, fine search of AOA estimation. The function of first module consists of the correlation to find channel impulse response and four values of auto-correlation to determine region. In the second block, the functionality finds AOA of largest power by two auto-correlation values. The future of the third module is that the night values of auto-correlation is used to estimation the best AOA of clear signal. Fig. 5.2 and Fig. 5.3 are detail architecture of cross-correlation and auto-correlation. In Fig. 5.4, the weighting vector is calculated by formula (2) to adjust beam pattern. The proposed algorithm keeps update to find perfect beam angle. TABLE VI lists the cost of the computing architecture complexity. The major component of the computing architecture is the multiplier. The gate count of multiplier is 3.605K by Taiwan Semiconductor Manufacturing Company (TSMC) 0.18-μm one-poly six-metal layer (1P6M) CMOS
library.
TABLE VI Computing architecture complexity
Number of computing architecture Multiplier 868 Accumulator 16
MUX 5 Divider 1
31 . . . . . .
Received Data DataIdea
FFT Data buffer Rt(0) Rt(1) Rt(2) Rt(L-1) Register 1 AOA= 0 degree Register 2 AOA= 90 degree Register 3 AOA= 180 degree Register 4 AOA= 270 degree Comparison (Find largest val ue and secon d lar ge value) Ant enn a Ar ra y Multi plier . . . . Data Buffer EF1_1 EF2_1 EF3_1 EF4_1 Auto-correl ation AOA of possible region 2 AOA of possible region 1 Register 5 AOA Register 6 AOA EF1_1 EF2_1 Co mp ar iso n (F in d la rg es t v alu e ) . . . Data Buffer Mult iplier Auto-correl ation D ivi de r Register 1 AOA Register 2 AOA 2 180o Antenna Array Estimate AOA
AOA of largest power
Register 10 AOA Register 15 AOA Estim ate AOA ( formula (1) ) Register 7 AOA Auto-corr elati on . . . Data Buffer EF1_1 Multi plier An te nn a Ar ray EF9_1 Tap1 Tap2 Control Unit C ross-correl ation Co mp ar ison (F in d lar ges t value )
Fig. 5.1 Architecture of proposed algorithm
1 Q 2 Q 3 Q L Q 1 R 2 R 3 R L R Fig. 5.2 Cross-correlation
32 1 R 2 R 3 R L R Reg_r1 Reg_r2 Reg_r3 Reg_rL Fig. 5.3 Auto-correlation W1 W2 W4 W3
33
Chapter 6
Conclusions
In this paper, the proposed digital beamforming technique is use to improve performance in MIMO-OFDM system. Digital beamforming technique is similar with smart antenna system. The digital beamforming is used to suppress the interference signal for the purpose of degrading multipath effect and promoting the desired signal. Otherwise, the smart system needs higher cost than digital beamforming technique, because it acquires the direction antenna in place of the original architecture. Accordingly, the proposed algorithm calculates the weighting vector to change the beam pattern toward the best received angle; as a result, the method can improve performance.
The future issues are that modifies the proposed algorithm and reduces the complexity. The most important is that the complexity of calculating correlation has needed to reducing, so the hardware implementation issue might be easy and rapid. On the other hand, the accuracy of AOA estimation is another problem that it needs to avoid the effect of channel variance.
34
Bibliography
[1] Frank B. Gross, ”Smart Antennas for Wireless Communication ”, Books, 2005
[2] John Litva and Tiitus Kwok-Yeng Lo, ”Digital Beamforming in Wireless communications”, Books, 1996
[3] A. Mockovèiaková, ” Laplacian distribution of magnetization” , Contributions to Geophysics and Geodesy, 2001
[4] C. Sun and N. C. Karmakar, “Combining Beamforming with MMSE. Alamouti Multiuser
Interference Cancellation Receiver,” Proceedings of the Fourth IEEE International symposium
on ,2004 , Page(s): 254 – 257
[5] Huy Hoang PHAM, Tatsuki TANIGUCHI, Yoshio KARASAWA “ Multiuser MIMO beamforming for single data stream transmission in frequency-selective fading channels”, IEICETRANS.FUNDAMENTALS,VOL.E88-A,NO3 MARCH 2005
[6] Ken LONG, Wei-ling WU “An enhanced multi-antenna solution through beamforming to 3G long-term evolution”, Proceedings of the 2009 International Conference on Networks Security, Wireless Communications and Trusted Computing - Volume 01
[7] 3GPP,TR25.996,”Spatial channel model for Multiple Input Multiple Output(MIMO)
simulations”,2007
[8] 3GPP.TS 36.211,”Physical Channels and Modulation”,2007
[9] Shefeng Tan “Broadband Beamspace DOA Estimation:Frequency-Domain and Time-Domain Processing Approaches”,Hindawi Publishing Corporation EURASIP Journal on Advances in Signal Processing Volume 2007
[10] Yeh-Min Lin ,“The performance analysis of smart antenna for OFDM systems”, NCU Thesis,2006
[11] Erik Dahlman, Stenfan, PArkvall,Johan,Skold,Per Beming,“3G Evolution HS- PA and LTE for Mobile Broadband ”, Book,2007
[12] Hongxia Wang,Chengsheng Pan, “Wideband Direction-of-Arrival Estimation Using Frequency-Domain Processing Approach” Proceedings of IEEE,2008