Using Artificial Neuron Network on the Impact Characteristics Analysis
of Free Overfall Flow
Yao-Ming Hong
1, a, Hong-Ting Lyu
2,b, Yao-Chiang Kan
3,c,
and
Hsueh-Chun Lin
4,d1Department of Design for Sustainable Environment, MingDao University, Taiwan 2Department of Civil Engineering, National Chung-Hsing University, Taiwan
3
Department of Communications Engineering, Yuan Ze University, Taiwan
4
Department of Health Risk Management, China Medical University, Taiwan
a[email protected], b[email protected], c[email protected], d[email protected] (corresponding)
Keywords: artificial neuronal network, free overfall flow, impact force, impact position.
Abstract. This study is to forecast the impact force and impact position of free over-fall flow in the
downstream by using artificial neuron networks (ANN). A simulation procedure for the ANN algorithm was established to train and validate numerical samples with the experimental data. The outcomes of simulation show the ANN method can properly estimate the impact force and position.
Introduction
The maintenance of the dam or weir structure is quite an important program for water resource management. The sudden drop in the river bed due to the structure body such as the weir or dam will induce free overfall flows that will yield high impact force as flushing the channel bed. Many researchers hence devoted experimental studies to this phenomenon in the past years since it probably damages the dam or weir. Many studies discussed the characteristics of free overfall flow such as the end-depth-ratio (EDR), the dimensionless parameter “Drop Number”, or the discharge of the flow for the depth at the end section of drop [1][2][3][4]. Recently, Hong et al. [5] derived the regression and semi-theoretical equations to forecast the force and length of free-falling nappe dropping on an aerated straight-drop spillway. Besides, comparing with traditional regression models, the artificial neuronal network (ANN) has been widely applied in environment forecast by determining the relevant effective factors [6][7]. Thus the expert systems could be developed upon the adaptive network-based interface with the multiple nonlinear and linear analyses and their results were approved by the practical measurement data [8]. This study will implement the ANN method to predict the maximum impact force and position caused by the free overfall flow. Furthermore, laboratory experiment data in our previous study (Hong et al. [5] and hereinafter called Hong’s study) are used for the data training procedure to validate the proposed method.
Experiment Description
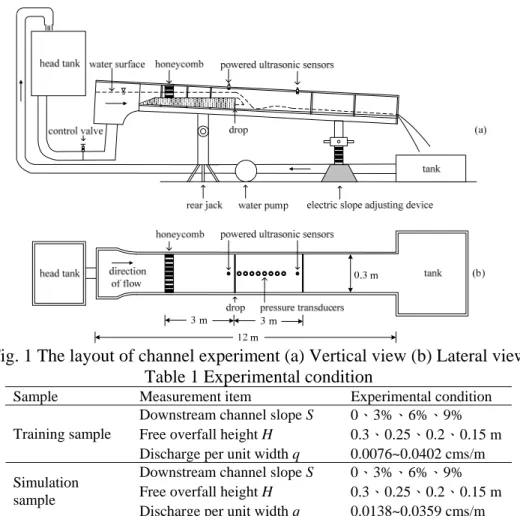
The laboratory experiments are conducted in a rectangular re-circulating water flume by installing a movable channel with the slope from 0% to 9%. As shown in Fig.1, the channel is constructed by glass with the layout dimension of 2m in length, 0.3m in width and 0.4m in height. A set of powered ultrasonic sensors (RPS-401) and eight pressure transducers (KYOWA) are embedded in the channel to measure the water depths and vertical bed pressures distribution, respectively. The characteristics of impact effect can be studied by varying the slope of bed (S=0 to 9%), the height of drop (H=0.15 to 0.30 m) and the drop number (D=2.61×10⁻⁴ to 487.3×10⁻⁴). The discharge of flow per unit width q is ranged from 0.0076 cms/m to 0.0402 cms/m. All design parameters of the experimental condition are displayed in Table 1. Due to Hong’s study, total 64 groups of training data were given for training the model of neural network and regression formulas. In this study, we added 36 groups of experimental data to simulate the proposed model. Two groups of samples are distinguished by various flow rates.
Fig. 1 The layout of channel experiment (a) Vertical view (b) Lateral view Table 1 Experimental condition
Sample Measurement item Experimental condition Downstream channel slope S 0、3%、6%、9% Free overfall height H 0.3、0.25、0.2、0.15 m Training sample
Discharge per unit width q 0.0076~0.0402 cms/m Downstream channel slope S 0、3%、6%、9%
Free overfall height H 0.3、0.25、0.2、0.15 m Simulation
sample
Discharge per unit width q 0.0138~0.0359 cms/m
Let’s define the impact position Lmi as the distance between the dam and the position where the
maximum pressure can be measured by the pressure transducers. The symbol Fmi denotes the
measured impact force which is counted as the total flushing force per unit vertical width. Then, Fmi
can be calculated by the measured impact pressure P on the downstream channel.
(
)(
)
[
]
∑
= + + − + = n i i i i i mi g P P L L F 1 1 1 2 1ρ (1) where Li is the distance between the ith pressure transducers and the dam; ρ is the water density; and gis the gravity.
Dimensional analysis
According to the outcomes of Hong’s study, the semi-theoretical impact position Lti is the function
of the slope of downstream bed (S), the height of drop (H), the discharge per unit width (q) and the gravity acceleration (g). Based on Buckingham’s π theorem, it can return three terms of π; they are π1 =q gH3 , π2 =Lri H =Lri andπ3 =S . Hence, the dimensionless regression impact position Lri can be determined by the function of slope S and drop number D (=q gH3 ).
Similarly, let Ftvi denote the vertical impact force per unit width and be the function of the slope of
downstream bed (S), the height of drop (H), the discharge per unit width (q), the gravity acceleration (g) and the density of fluid (ρ). Due to Buckingham’s π theorem, three terms of π can be obtained; i.e.,
3
1 =q gH
π , π2 =Lvri ρgH2 =Lvri and π3 =S . Hence, the dimensionless regression impact force F can also be the function of S and D. rvi
Based on the dimensional analysis and the empirical equations [9], the coefficient data of the training sample in Table 1 can be trained to establish the regression equations as follows:
(
1.272S)
xp 740 1 Lri . D0163e . = , (R2=0.982) (2a)(
2.243S)
xp 1.472D0496e Frvi = . , (R2=0.972) (2b)Application of Artificial Neuron Network
In this study, the toolbox of Matlab 7.1 is adopted to process the training data and simulation required for the application of artificial neuron network.
A. Data normalization
There are two central tasks as preparing the data: (1) To unify the data into the standard format that can support data mining and other computer-based tools; and (2) To configure the data sets that may lead the best performances of data mining. In general, we can normalize the raw data to reduce influence of the sample range and to speed up convergence of the training process. We hence adopt the minimum-maximum normalization in this study:
( )
i(
v( )
i( )
v( )
i)
(
( )
v( )
i( )
v( )
i)
V' = −min max −min (3)
where, V'
( )
i denotes the dimensionless value of normalization; v( )
i is the measured value; min( )
v( )
iand max
( )
v( )
i stand for the minimum and maximum measured value, respectively. Note that V'( )
i is controlled in the range between 0 and 1 by Eq. (3) . According to the dimensional analysis, it can be clearly observed that the drop number D and the slope of downstream channel S are both the main influence factors with respect to impact force and position. Therefore, by Eq. (3), four data sets should be normalized and they are the drop number D, the slope of downstream channel S, the dimensionless impact position L , and the dimensionless impact force per unit vertical width ri F in rvi which L and ri F are both dimensionless and measured by experiment. rviB. Training conditions of artificial neuron network
Training a neural network model essentially means selecting one model from the set of allowed models that minimizes the cost criterion. There are numerous algorithms available for training neural network models; most of them can be viewed as a straightforward application of optimization theory and statistical estimation. In Matlab software package, there are six conditions should be determined before training the sample as follows.
(1) Neuron network type: Multilayer perceptrons have been applied successfully to solve some different and diverse problems by training the network in a supervised manner with a highly popular algorithm known as the error backpropagation algorithm [10]. The multilayer feed-forward backpropagaton neuron network (FFBPNN) model to process the simulation in this study.
(2) Input ranges: The input range is between 0 and 1 by following the normalization method above. (3)Training function: The Levenberg-Marquardt algorithm is selected as the training function in this study because this algorithm can appear the fastest convergence for training the model of moderate-sized feedforward neural networks up to several hundred weights [11].
(4) Performance function: The mean square error is employed as the performance function. (5)Number of hidden layers: One hidden layer is used in this study. The hidden layer receives the input data and delivers the data to the output layer via the transfer function provided by the toolbox. (6) Properties of hidden layer: The properties of hidden layer include the number of neurons and the transfer function. Too few neurons can lead to under-fitting, and, in contrast, too many neurons can contribute to over-fitting. Appropriate neurons can fit all training points and prevent wild oscillations from the fitting curve [11]. It is observed that the drop number and the slope of channel are requested for the input layer and, therefore, two neurons in the hidden layer are used in this study. Subsequently, we consider a two-layer network, where the first layer is sigmoid and the second layer is linear, for training data to efficiently approximate any function with a finite number of
discontinuities [11]. Herein, the linear transfer and log-sigmoid functions are adopted in the hidden and output layers, respectively. The network diagram is viewable in Fig. 2 after giving the parameters above. In which, iw{1,1} represents the weight to the layer 1; lw{2,1} means the weight to layer 2; b{1} is the bias to layer 1, and b{2} is the bias to layer 2. Therefore, the network is created with a single input (composed of two elements), a log-sigmoid transfer function for the hidden
layer, a linear transfer function to the output layer, and a linear output.
C. The training and simulation of impact characteristics
This approach adopts 64 groups of training sample to train the ANN model. The model contains the input data consisting of the normalized drop number and the downstream slope, and the target data including the measured dimensionless vertical impact force per unit width.
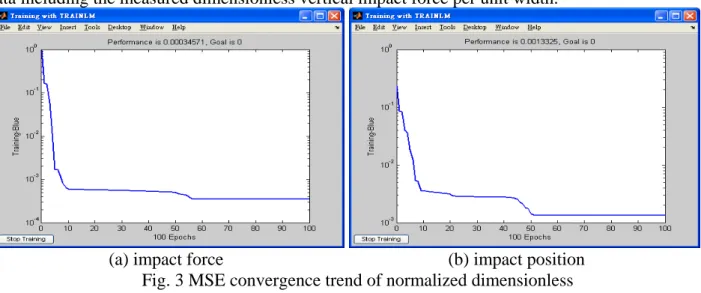
(a) impact force (b) impact position Fig. 3 MSE convergence trend of normalized dimensionless
Fig. 3(a) displays the convergence trend of training data for the dimensionless impact force. The unit of vertical coordinate (Training–Blue) is the mean square error (MSE), and the unit of horizontal coordinate (Epochs) is the training number. After training for five times, the trend of MSE is stable gradually, and MSE is equal to 0.00034 after training for 100 times. Similarly, Fig. 3(b) performs the training diagram of the dimensionless impact position. The unit MSE equals to 0.00133 after training for 100 times. Table 2 shows the weights and bias after executing the training process. These factors are available to simulate the normalized dimensionless impact force and position by inputting normalized dimensionless slope and drop number into the ANN model.
Table 2 Selected factors of ANN method after data training
iw{1,1} b{1} Application
item
normalized
parameter neuron1 neuron2 lw{2,1} neuron1 neuron2 b{2} slope -0.130 -0.379 144.858
Dimensionless
impact force drop number 12.186 -3.116 -0.962 6.249 1.601 -143.771
slope -0.014 -0.947 52.244
Dimensionless
impact position drop number 12.574 -1.880 -0.755 4.571 1.930 -51.019
Impact characteristics comparison
The outcomes of impact characteristics simulated by artificial neuron network are discussed with that by semi-theoretical equation and regression analysis in Hong’s study. The comparison of impact characteristics between various prediction methods can help to find the best one.
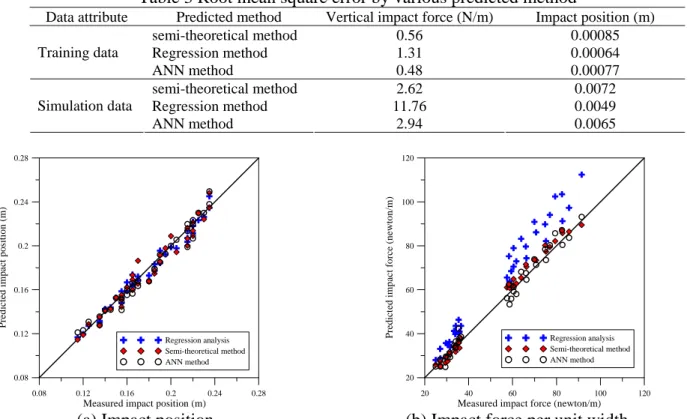
As comparing the impact positions and forces carried out by three methods for the measured values with respect to the various predicted values due to the training data, we found that all of methods for impact positions can obtain satisfactory to fit the measured values. However, the values computed by the regression method display a large difference with respect to the measured values. These training results can be apparently observed in the simulation outcomes shown in Fig. 4(a) and 4(b). In addition, the root-mean-square (RMS) error is working to calculate the difference between measured values and predicted values. Thus the small RMS errors are shown in Table 3 in which all of RMS errors are smaller than 0.001m. Table 3 also presents the smaller RMS errors of semi-theoretical and ANN methods than that of the regression method.
Fig. 4(a) and 4(b) shows the simulation outcomes of impact characteristics. All of the impact characteristics, whether they are impact force or impact position, can be accurately predicted by the ANN method and semi-theoretical method. On the other hand, the regression method can simulate the impact position, but overestimate the impact force with a large RMS error. The RMS error also supports above conclusion.
Table 3 Root mean square error by various predicted method
Data attribute Predicted method Vertical impact force (N/m) Impact position (m)
semi-theoretical method 0.56 0.00085 Regression method 1.31 0.00064 Training data ANN method 0.48 0.00077 semi-theoretical method 2.62 0.0072 Regression method 11.76 0.0049 Simulation data ANN method 2.94 0.0065 0.08 0.12 0.16 0.2 0.24 0.28
Measured impact position (m)
0.08 0.12 0.16 0.2 0.24 0.28 Pr ed ic ted i m p a ct p o siti o n (m ) Regression analysis Semi-theoretical method ANN method 20 40 60 80 100 120
Measured impact force (newton/m)
20 40 60 80 100 120 Predict ed im p ac t fo rce (n e w to n /m ) Regression analysis Semi-theoretical method ANN method
(a) Impact position (b) Impact force per unit width
Fig. 4 Comparison between measured and predicted impact characteristics by simulation outcomes
Conclusion
This study calculates the impact force and impact position of free overfall flows by using the algorithm of artificial neuron network. The experiment data from Hong’s study was recruited for the required training data. Besides, 36 groups of sample are further employed to confirm the feasibility of proposed methods. Multilayer feed-forward backpropagaton neuron network (FFBPNN) model is adopted to process the artificial neuron network model. In which the downstream slope and drop number are considered as the input data while the dimensionless impact position and force are carried out as the target data. The outcomes of simulation approve the semi-theoretical method and ANN method that can provide a useful estimation for the impact force and position. Nevertheless, the regression analysis for the impact force results in overestimation.
Acknowledgement
The authors would like to appreciate the research support from National Science Council of the Republic of China, Taiwan, with the project no. 99-2625-M-451-001.
Reference
[1] Rouse, H., 1936. Discharge characteristics of the free overfall. Civil Engineering 6(4),257-260 (ASCE).
[2] Rand W., 1955. Flow geometry at straight drop spillways. Journal of Hydraulic Engineering, ASCE 81, 1-13.
[3] Ferro, V., 1992. Flow measurement with rectangular free overfall. Journal of Irrigation and Drainage Engineering, 118(6), 956-964.
[4] Chamani, M. R., Beirami, M.K., 2002. Flow characteristics at drop. Journal of Hydraulic Engineering. 128(8), 788-791 (ASCE).
[5] Hong Y.M., Huang H.S., and Wan S., 2010, Drop characteristics of free-falling nappe for aerated straight-drop spillway, Journal of Hydraulic Research, 48(1), 125 - 129.
[6] Finnie, G. R., Wittig G. E. & Desharnais, J-M., 1997. A comparison of software effort estimation techniques: Using function points with neural networks, case-based reasoning and regression models. Journal of Systems and Software, 281-289.
[7] Raikar, R.V., Kumar, D. N., & Dey S., 2004. End depth computation in inverted semicircular channels using ANNs. Flow Measurement and Instrumentation, 15, 285–293.
[8] Baylar, A., Hanbay, D., & Ozpolat, E., 2008. An expert system for predicting aeration performance of weirs by using ANFIS. Expert Systems with Applications, 35, 1214–1222. [9] Chanson, H., 1995. Hydraulic design of stepped cascades, channels, weirs and spillways.
Pergamon, Oxford, UK.
[10] Kantardzic M., 2003. Data mining-concepts, models, methods, and algorithms, IEEE, Wiley-interscience, USA, 196-217.
[11] Howard D., and Mark B., 2004. Neural network toolbox- for use with MATLAB. The MathWorks, Inc.