行政院國家科學委員會專題研究計畫 期中進度報告
定量化溫加工變形組織研究(1/3)
計畫類別: 個別型計畫 計畫編號: NSC91-2216-E-110-021- 執行期間: 91 年 08 月 01 日至 92 年 07 月 31 日 執行單位: 國立中山大學材料科學研究所 計畫主持人: 張志溥 計畫參與人員: 丁仕旋, 林敬量 報告類型: 精簡報告 處理方式: 本計畫可公開查詢中 華 民 國 92 年 5 月 30 日
Quantitative Characterization of Warm Working Structures
計畫編號:NSC 91-2216-E-110-021 執行期限:91 年 8 月 01 日至 92 年 7 月 31 日 主持人:張志溥 國立中山大學材料研究所 計畫參與人員:丁仕旋,林敬量 國立中山大學材料研究所 Abstract:The facility for warm work by plain strain deformation has been set up. We h a v e e s t a b l i s h e d t h e e x p e r i m e ntal procedure for measuring the quantitative metallographical parameters of deformation micro structure, namely subgrain size, subgrain aspect ratio, misorientation angles of subgrain boundaries, in TEM. So far
w e h a v e s t u d i e d t h e d e f o r m a t i o n microstructure s o f t h r e e d e fo r m a t io n temperatures, namely 100oC, 200oC, and 300oC; two strain rates, namely 5x10⁻² and
5x10⁻⁴; and one strain (50% reduction in thickness). Further work is in progress.
Key words: Aluminium, warm working, misorientation, microstructure.
1. Introduction
The deformation microstructures of metals have been intensely studied over the last few decades. In the literature, most researchers studied cold and hot worked microstructures. Surprisingly, very limited information is available about the warm worked microstructures of metals. The reason for this can be understood, since nearly all metal working processes are o p e r at e d in e it he r c o ld o r ho t wo r k temperature range. The aim of this project
is to perform systematic study of warm worked microstructures, hope to understand t he relat io nship bet ween defo rmat io n
temperature and microstructure, and to fill the gap of our knowledge between cold and hot deformation microstructures.
Desp it e t he st udy o f de fo r mat io n structure of metals can go back to several
decades ago, quantitative characterization of deformation microstructures has only been performed over the last few years [e.g.
1-5 ] b y T E M, a nd o n ly c o ld w o r k e d microstructures of aluminium and nickel have been studied in detailed [1-5].
I n o r d e r t o c o m p a r e w i t h t h e de fo r mat io n micro st r uct ur es o f co ld w o r k e d a lu m in iu m, w e c ho o se 1 0 5 0 commercially pure aluminium to be our model material. Ro ll in g ha s b e e n t he most popular way to introduce deformation in the literature, due to its simplicity and its widely applicat ion in the industries. In o r d e r t o c o n t r o l t h e d e f o r m a t i o n temperature accurately, we decided to use
plane strain deformation to simulate rolling process.
2. Experimental
The material used in this work was commercially pure 1050 Al (99.5% pure), the material was homogenized at 893 K for 12 h, and air cooled to room temperature. The init ial grain size of the material is about 300 µm.
Facility for plane strain compression test at elevated temperatures has been set up according to the design of Shi et al. [6],
see fig. 1. This facility is attached to Instron 5582 machine. By this method, we can perform plane strain deformation at any d e s i r e d t e m p e r a t u r e b e l o w oC, 3 0 0 meanwhile t o measure t he st ress-strain
c u r ve d u r ing d e fo r ma t io n. D e t a ile d procedure and specimen shape please refer
to the reference [6]. Teflon sheet has been used as lubricant.
Quant it at ive char act erizat io n o f deformation microstructure is performed by
T E M . We m e a s u r e t h e f o l l o w i n g m e t a l l o g r a p h i c a l p a r a m e t e r s : ( a ) miso r ie nt at io n ang le s o f s u b g r a i n boundaries, (b) equivalent circle diameters of subgrains, i.e. subgrain sizes, and (c) aspect ratios of subgrains. Misorientation measurement is performed by collecting microdiffraction Kikuchi patterns of cells by a Gatan 300W CCD camera attached to a Philips CM200 TEM. Indexing of the Kikuchi patterns, and the calculation of miso r ient at io n ang le o f neig hbo uring s u b g r a i n s a r e p e r fo r me d b y T O C A software.
Thin foils for TEM were first sliced perpendicular to the transverse direction, then mechanically thinned down to about 200µ m t h ic k a nd fin a l l y p o lis he d b y standard twin-jet polishing method using a electrolyte of 25% nitric acid and 75% methanol at 5oC, 10 volt. TEM was carried out using a Philips CM200 microscope operated at 200kV.
3. Results and Discussion
Up to the time this report is written, we have been able to study the specimens of 50% reduction in thickness. Two strain rates have been used, 5x10⁻⁴ and 5x10⁻²,
and three temperatures, 100oC, 200oC, and 300oC have been t est ed. Following are some results.
In order to make TEM foils from the transverse plane, specimen thickness after plane strain deformation needs to be thicker than 3mm, since TEM disc requires 3mm diameter. We have tried several different specimen thicknesses, and found that
u n i fo r m d e fo r ma t io n c o u ld o n l y be
obtained when the thickness was less than 7.5mm. T he spec ime n t hick ne ss was therefore set to be 7.5mm.
Fig. 2 shows the montage of optical micrographs of the specimen that was deformed to 50% reduction in thickness at 300oC, the strain rate was 5x10⁻⁴. The
sect ion plane was perpendicular to the transverse direction. ND here represents compression direction, and is equivalent to the normal direction (ND) in rolling. RD represents the plastic flow direction of the material, and is equivalent to the rolling direction (RD) in rolling. From fig. 2, it can
be s e e n t ha t t he p la s t ic f lo w o f t he specimen is reasonable uniform, therefore
fulfill the plane strain condition.
Fig. 3 shows the TEM micrographs of de fo rmat io n icro st r uct ur es m at t hr ee different testing temperatures, for strain r a t e e q u a l e d -45 x 1 0. F r o m o u r measurements, it was found that subgrain s ize r e ma ined near ly t he sa me w he n deformed below 200oC, and increased significant ly when deformed at 300oC. T a b l e 1 h o w s s t h e m e a s u r e d metallographical parameters for 100oC and
200oC . T h e d a t a fo r 3 0 0oC is being measured but yet to complete. From fig. 3(c) , it is c le a r l y t ha t s u bg r a in s iz e increased significantly at 300oC.
As fo r t he shap e o f su bgra ins, i.e. aspect ratio, it is found that for strain rate equals to 5x10⁻², aspect ratio decreased
with increasing deformation temperature. Although the data for 300 oC has not been measured yet, but from TEM micrographs, it can be clearly seen that subgrain shape became equiaxed. The change o f aspect ratio for strain rate equals to 5x10⁻⁴ is little confusing, since the aspect ratio increased from 2.58 to 2.86, when the deformation temperature increased fro m 100oC t o 200oC, then decreased at 300oC (according to TEM micrographs). The decrease of aspect ratio with increasing deformation temperature is expected, since lamellar dislocation structure (large aspect ratio) has always been found for room temperature
(aspect ration equals to 1) are always found for high temperature deformat ion. The increase of aspect ratio for strain rate equals to 5x10⁻⁴ a t 2 0 0oC is therefore
d ifficu lt t o underst and. One po ss ible explanation of this is that the difference in aspect ratio at 100oC and 200oC is within experimental measuring error. If this is the case, then the data can be interpreted as: the aspect ratios remained the same for both 100oC and 200oC, only at 300 oC, it decreased.
Decreasing the stain rate from 5x10⁻² to
5x10⁻⁴ at both 100oC and 200oC makes the subgrain size increases. This result is reasonable, since the lower the strain rate, the longer the testing time at the elevated temperature.
The mo st impo rt ant dat a fro m t he p r e s e n t p r o j e c t i s t h e m e a s u r e d miso r ient at io n ang les o f t he subgrain boundaries generated during warm working. Fig. 4 shows a typical result from a local area aft er plane st rain de fo rmat io n at 200oC, the strain rate was 5x10⁻². For each
testing condit ion, five local areas were measured; in total, five to six hundreds of subgrain boundaries were measured. From fig. 4, it can be seen that most subgrain boundaries had misorientation angle less than 5 degrees. Subgrain boundaries with higher misor ient ation angles have t he tendency to align along a direction incline to about 40 degrees to the RD. Within the measuring range, about ten micrometers, no high angle (>15o) subgrain boundary was found. EBSD in SEM will be used to detect high angle subgrain boundary, since SEM can measure larger area than TEM.
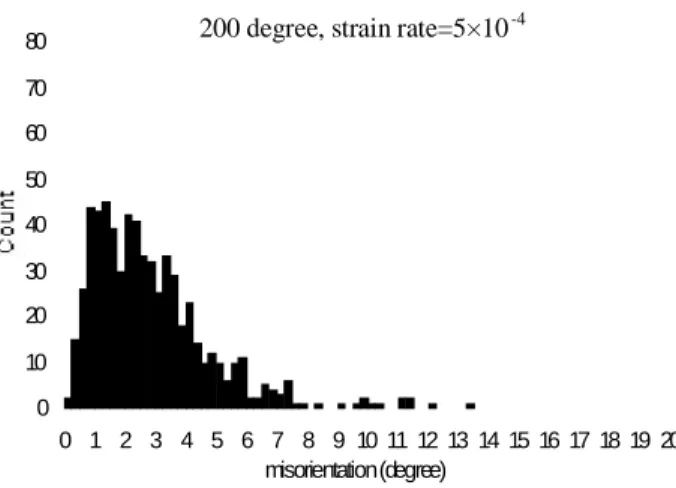
Figs. 5(a) to (d) show the distribution histogram of misorientation angles for two deformation temperatures, and two strain rates. At 100oC, lower strain rate generated larger proportion of boundaries with higher misorientation angles. For example, at 100oC, 23.3% of subgrain boundaries had misorientation angles larger than 5 degrees for strain rate equaled to 5x10⁻⁴, and only
3 % o f s u b g r a i n b o u n d a r i e s h a d misorientation angles larger than 5 degrees
for strain rate equaled to 5x10⁻². At 200oC,
11 . 7 % o f s u b g r a i n b o u n d a r i e s h a d misorientation angles larger than 5 degrees
for strain rate equaled to 5x10⁻⁴, and only
5 . 5 % o f s u b g r a i n b o u n d a r i e s h a d misorientation angles larger than 5 degrees
for strain rate equaled to 5x10⁻². Above
results indicates that lower strain rate generates higher proportion of subgrain boundaries wit h higher misorientation angles. From preliminary results, the same trend holds at 300oC.
4. Conclusions
In t he first 10 mo nt hs o f t his project, we have set up the facility for plain strain deformation within warm working temperature range. We have established the procedure for measuring the quantitative metallographical parameters of deformation micro structure, namely subgrain size, subgrain aspect ratio, misorientation angles of subgrain boundaries, in TEM. So far we h a v e s t u d ie d t h e d e fo r m a t io n micro st ruct ures o f t hree defo rmat io n temperatures, two strain rates, and one strain (50% reduction in thickness). Further works is in progress.
5. Reference
(1) Q. Liu, X. Huang, D. J. Lloyd, and N. Hansen, Acta Mater., 50, 3789, (2002).
(2) D. A. Hughes, Scripta Mater., 47, 697, (2002).
(3) D. A. Hughes, Q. Liu, D. C. Chrzan, and N. Hansen, Acta Mater., 45, 105, (1997).
(4) B. Bay, N. Hansen, D. A. Hughes, and D. Kuhlmann-Wilsdorf, Acta Metall. Mater., 40, 205, (1992).
(5) B . B a y , N . H a n s e n , D . a n d Kuhlmann-Wilsdo rf, Mat er. Sci. Eng., A113, 385, (1989).
(6) H. Shi, A. J. McLaren, C. M. Sellars, R. Shahani, and R. Bolingbroke, Journal of Testing and Evaluation, 25, 61, (1997).
表一:變形量為 50%厚度縮減率之 1050 鋁在不同變形溫度及 應變率下的相關組織參數值 變形溫度 應變率(s-1 ) 次晶粒尺寸(μm) 次晶粒長短軸比 100oC 5×10 -2 5×10⁻⁴ 0.94 1.42 3.20 2.58 200oC 5×10 -2 5×10⁻⁴ 1.07 1.44 2.63 2.86 ( a ) ( b )
Fig. 1: Photos showing the facility for plain strain compression test. The range of the testing temperature is between room temperature and 300oC.
Fig. 2: Montage of optical micrographs showing the deformation structure. The section is perpendicular to the transverse direction.
Fig. 3: TEM micrographs showing the deformation microstructures after 50% reduction. (a) 100oC, (b) 200oC, and
Fig.4: (a) TEM micrograph showing the deformation microstructure. Deformed at
200oC, strain rate was 0.05, 50% reduction in thickness. (b) The schematic diagram of the central area round A in (a). The numbers in the figure indicate the misorientation angles of the boundaries.
0 10 20 30 40 50 60 70 80 0 1 2 3 4 5 6 7 8 9 10 11 12 13 14 15 16 17 18 19 20 misorientation (degree)
100 degree, strain rate=5×10⁻⁴
0 10 20 30 40 50 60 70 80 0 1 2 3 4 5 6 7 8 9 10 11 12 13 14 15 16 17 18 19 20 misorientation (degree)
100 degree, strain rate=5×10⁻²
Fig. 5: Distribution histogram of misorientation angles of subgrain boundaries for different temperatures and strain rates.
0 10 20 30 40 50 60 70 80 0 1 2 3 4 5 6 7 8 9 10 11 12 13 14 15 16 17 18 19 20 misorientation (degree)
200 degree, strain rate=5×10⁻²
0 10 20 30 40 50 60 70 80 0 1 2 3 4 5 6 7 8 9 10 11 12 13 14 15 16 17 18 19 20 misorientation (degree)
200 degree, strain rate=5×10⁻⁴