區分問題解決專家和新手的任務和非任務
特定因素:比較 PISA 2012 前十名東西方
經濟體學生之表現
金松麗
張國祥 薛寶嫦
摘 要
研究目的 本研究旨在利用電腦生成的 log 文檔探索「交通」這道題解難過 程中的任務特定指標變量,然後加上整理自「學生能力國際評估計 劃(PISA)2012」問卷資料的非任務特定變量,檢視區分高表現問 題解決專家和低表現問題解決新手有哪些相對重要的因素。 研究設計/方法/取徑 本研究在 PISA 2012 電子問題解決測試排名前十名的高表現經 濟體的 15 歲學生中,選取參與回答「交通」這一道題的高表現問題 解決專家和低表現問題解決新手,人數合共 2,651 名。接著將學生分 為東方高表現經濟體組和西方高表現經濟體組,分別以教育數據探 勘工具「分類與回歸樹」作為主要的分析技術,找出區分高表現問 題解決專家和低表現問題解決新手的因素,並將影響東方高表現經 濟體和西方高表現經濟體學生表現的因素進行比較。 金松麗(通訊作者),澳門大學教育學院博士生 電子郵件:[email protected] 張國祥,澳門大學教育學院教授 電子郵件:[email protected] 薛寶嫦,澳門大學教育學院助理教授 電子郵件:[email protected] 投稿日期:2016 年 9 月 27 日;修正日期:2017 年 3 月 1 日;接受日期:2017 年 7 月 6 日研究發現或結論 影響東方高表現經濟體和西方高表現經濟體學生表現的因素有 同有異。在東方經濟體中,探索出的影響因素按重要性排序依次為: 找到任務的最佳解決路徑,數學自我效能感,和在學校中完成純數 學任務的體驗。在西方經濟體中,結果依次為:數學自我效能感, 找到任務的最佳解決路徑,熟悉數學概念,和數學中的敬業態度。 研究原創性/價值性 根據研究結果,有助教育工作者在各自的環境中設計基於問題 的學習方案。此外,本研究的分析方法,亦能夠為未來的電子問題 解決研究提供新的思路。 關鍵詞: 問題解決、教育數據探勘、log 文檔、分類與回歸樹、PISA
Contemporary Educational Research QuarterlyVol. 23, No. 1
TASK- AND NON-TASK-SPECIFIC FACTORS
CLASSIFYING PROBLEM-SOLVING EXPERTS
AND NOVICES: COMPARING STUDENTS OF
THE TOP TEN HIGH-PERFORMING EASTERN
AND WESTERN ECONOMIES IN PISA 2012
Songli Jin Kwok-Cheung Cheung Pou-Seong Sit
ABSTRACT
Purpose
The purpose of this study is to make use of the computer- generated log files to derive task-specific indicator variables of problem-solving processes of an exemplary problem task (TRAFFIC) to examine factors of relative importance and thereby classify and differentiate high-performing problem-solving experts from low- performing problem-solving novices. Added to the task-specific indicators are non-task-specific variables collated from questionnaires administered in the Programme for International Student Assessment (PISA) 2012 study.
Design/methodology/approach
The participants are 2,651 fifteen-year-old high-performing problem-solving experts and low-performing problem-solving novices who have responded to the TRAFFIC problem task coming from the top ten high-performing economies in the PISA 2012 digital problem-solving study. The educational data mining tool Classification and Regression Tree (CART) is the main analytic technique used. Factors found for the students of the top ten high- performing Eastern economies are compared with those of high- performing Western economies.
Songli Jin (corresponding author), PhD student, Faculty of Education, University of Macau, Macao, China.
E-mail: [email protected]
Kwok-Cheung Cheung, Professor, Faculty of Education, University of Macau, Macao, China. E-mail: [email protected]
Pou-Seong Sit, Assistant Professor, Faculty of Education, University of Macau, Macao, China. E-mail: [email protected]
Manuscript received: September 27, 2016; Modified: March 1, 2017; Accepted: July 6, 2017
Findings
The factors affecting student performance in Eastern and Western high-performing economies share commonalities and differences. In the Eastern economies, the factors identified in descending order of relative importance are: Discovery of the optimal solution path of the problem task, mathematics self-efficacy, and experience with pure mathematics tasks at school. In the Western economies, the factors identified in descending order of relative importance are: Mathematics self- efficacy, discovery of the optimal solution path of the problem task, familiarity with mathematical concepts, and mathematics work ethics.
Originality/value
Based on the findings, educational practitioners may be informed how to design problem-based learning (PBL) in their respective economies. Furthermore, it is hoped that the methodologies developed are useful in furnishing new ideas to the future studies of digital problem solving.
Keywords: problem solving, educational data mining, log file, classification and regression tree (CART), PISA
Purpose of Study
Problem-solving is one of the core skills of the 21st century, having gained attention from educational researchers seeking to examine its effective processes and behavioral indicators (Scherer & Gustafsson, 2015; Trilling & Fadel, 2009). According to a survey conducted in the United States, problem- solving was one of the top five most important skills in the workplace for new entrants (Casner-Lotto & Barrington, 2006). 70% of employers reported that high school graduates were deficient in problem-solving competence. Admittedly, this is not an isolated case in one country; rather, problem-solving deficiency is emerging as a global issue worthy of educational researchers’ attention.
According to the results of past PISA studies with assessment domains on problem-solving (i.e., PISA 2003 and PISA 2012), many students’ problem-solving competence could not be classified above the baseline level (Organization for Economic Cooperation and Development [OECD], 2004, 2014a). The PISA 2003 study indicated four progressive levels of problem- solving competence: Below level 1, followed by levels 1-3. On average, roughly 50% of 15-year-old students in 30 participating economies were assessed with problem-solving proficiency below level 1 (OECD, 2004). A decade later, PISA 2012 evaluated students’ problem-solving competence around the world a second time indicating seven progressive levels of problem-solving competence: Below level 1, followed by levels 1-6. On average, 20% of the students in 34 participating economies were found proficient below the baseline level (i.e., level 2) (OECD, 2014a). These low- performing problem-solving novices can hardly solve a generally unfamiliar or complex problem. These surmised problem-solving novices are the target students examined in this study.
On the contrary, some students were proficient in solving complex and unfamiliar problems. 18% of students in 2003 were at the highest level (level
3) (OECD, 2004). They tended to consider and manage various conditions,
approach problems systematically, and construct their own representations to solve problems and verify solutions. In 2012, 11% of all students were above
level 4 (OECD, 2014a). These students can think ahead to find an optimal
strategy that addresses all the given constraints. They are regarded as
What makes these students vary significantly in problem-solving performance in PISA 2012? What factors are significant and aid in accurately classifying problem-solving experts versus problem-solving novices? Can educators use these identified factors to help students develop problem- solving competence?
The PISA study is an international large-scale sampled survey that aims to provide valuable information for educational practitioners to improve education by learning from high-performing economies. The PISA 2012 Digital Problem-solving Study (i.e., PISA 2012 DPS), an optional component of the PISA 2012 Study, assessed 15-year-old students’ problem-solving competence by examining computer use at a developmental stage before entering the workplace or higher level of academic study (OECD, 2013). This international study is thus ideal for examining students’ problem-solving characteristics and dispositions on a global scale. The problem-solving database released in 2013 comprises computer-generated log files of four released problem tasks (out of a total of 16 problem tasks, also called PISA 2012 DPS test units), which provide comprehensive information documenting the behavioral actions of each examinee. Although PISA 2015 released data last year, collaborative problem-solving data has not yet been released. Therefore, for the present, no log files of the PISA 2015 problems are available for public analysis. Hence, the present study focuses on the data of PISA 2012 log files of problem tasks released for public scrutiny. Due to the limitations of methodology and tools to analyze the substantial and disorderly log file data, educational researchers, since its public release in 2013, seldom examined these log files in-depth in their research of student problem-solving processes and behaviors (Greiff, Wüstenberg, & Avvisati, 2015).
As a pioneering trial study, this analysis will deploy Educational Data Mining (EDM) to analyze the computer-generated log file data collected in PISA 2012. According to Baker (2010), EDM is an emerging discipline, concerned with developing methods for exploring the unique types of data that come from educational settings, and using those methods to better understand students, and the settings in which they learn. Admittedly, the educational settings in which student learning occurs are highly influenced by national culture and economy. Many researchers contend that differences between
Eastern and Western cultures have a bearing on educational environments, resulting in the differing learning styles and problem-solving approaches of students (see Biggs, 1994; Cai, 1995; Chang et al., 2011; Hess & Azuma, 1991). Particularly, Ho (1991) has explained the cognitive socialization processes of Confucian Heritage Culture commonly found in Eastern countries or economies, e.g., Mainland China, Taiwan, Hong Kong, Macao, Japan, Singapore, and Korea. Differences do exist between schools of Eastern and Western cultures regarding what factors are essential for effective schooling (Biggs, 1994). It is the intention of this study to uncover some of these differences between students of the top ten high-performing Eastern and Western economies when they engage in the problem-solving processes of some exemplary problem tasks as demonstrated in PISA 2012 DPS.
Under this backdrop, the purpose of the present study is to explore task- specific indicators generated from the log files of one released problem task (i.e., TRAFFIC), and use these indicators alongside an array of explanatory variables (the non-task-specific indicators) drawn from the PISA 2012 student, parent and school questionnaires to discern, in descending order of relative importance, what factors are able to classify whether a student is a high-
performing problem-solving expert or a low-performing problem-solving novice, respectively, in the top ten PISA 2012 high-performing Eastern and
Western economies.
Analysis of the Big Log-File Data in PISA 2012 DPS
Factors Affecting Problem-Solving Performance
In response to the need for cross-country comparison of student performance, the OECD launched PISA. The assessment takes place every three years, assessing 15-year-old students’ domain-specific knowledge, skills, and attitudes which are essential for life-long learning. PISA 2012 covered the domains of reading, mathematics, science, and problem-solving. Altogether, 44 economies participated in PISA 2012 DPS, an optional component of PISA 2012 with 65 participating economies. Problem-solving competence is defined by OECD (2013) as follows:
Problem-solving competency is an individual’s capacity to engage in cognitive processing to understand and resolve problem situations where a method of solution is not immediately obvious. It includes the willingness to engage with such situations in order to achieve one’s potential as a constructive and reflective citizen (p. 122).
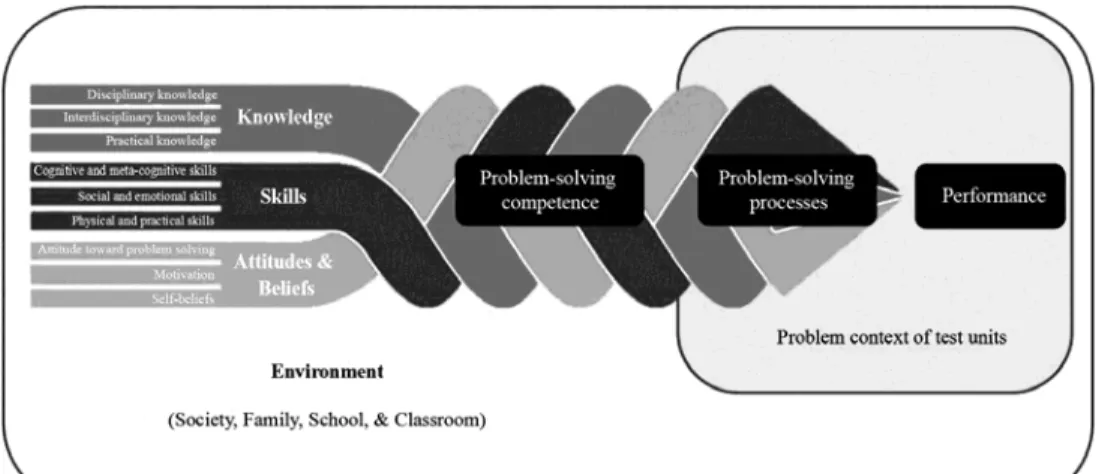
To answer the research question of this study, a conceptual model of
task-specific and non-task-specific factors affecting problem-solving performance is delineated (see Figure 1). This model is adapted from the
research frameworks of OECD’s assessment of global competence (OECD, 2016) and the PISA 2012 Study (OECD, 2013). As seen in Figure 1, there are
student-level personal factors pertaining to their knowledge, skills, attitudes and beliefs, as well as system-level environmental factors (e.g., society, family, school, and classroom) that have a bearing on student problem-solving
competence. This problem-solving competence, when deployed in the contexts of specific problem-solving tasks, such as one of the four exemplary PISA 2012 DPS released test units (i.e., TRAFFIC examined in this study), affects the problem-solving processes resulting in the differing levels of problem-solving performance (i.e., high-performing problem-solving experts versus low-performing problem-solving novices).
Figure 1. Conceptual model of task-specific and non-task-specific factors affecting
Past research shows that environment, knowledge, skills, attitudes and
beliefs do have a bearing on the formation and development of students’
problem-solving competence. For instance, in the schooling environment, external influences such as access to tools or teacher classroom management style influence students’ problem-solving competence (OECD, 2013, 2014a). Additionally, Peter, Judith, and Robyn (2009) found that there are many important environmental factors that can help students solve unfamiliar problems, e.g., classroom resources, organization and climate, interpersonal interactions and relationships, social and cultural contexts, family expectations, and school organization.
Knowledge and problem-solving skills, such as the use of metacognitive strategies, are influential factors differentiating between problem-solving experts and novices (Brand-Gruwel, Wopereis, & Vermetten, 2005; Elio & Scharf, 1990; Mayer, 1998; Smith & Good, 1984). Additionally, Brand- Gruwel et al. (2005) found that problem-solving experts read tasks and activate their relevant prior knowledge more often than novices. In Smith and Good’s (1984) study, 32 problem-solving strategies used by successful problem solvers are identified. These strategies must be fostered in problem- solving novices. It is noteworthy that Goos and Galbraith (1996) remarked that the use of metacognitive strategies is highly correlated with student mathematical problem-solving performance.
Former research conducted in the past few decades reveals that students’ attitudes and beliefs influence their problem-solving competence as well. Put simply, belief is the state of mind in which a person thinks something is true or not true. According to Mayer (1998), a student’s feelings and beliefs about his/her interest and ability to solve the problems assigned to them (e.g., interest, self-efficacy, and attributions) have significant influence on his/her problem-solving performance. Additionally, Peter et al. (2009) emphasized that students’ motivation and expectations of their futures can influence their problem-solving competence. Besides these psychological dispositions, attitudes can also correlate and predict student performance in problem- solving (Nicolaidou & Philippou, 2003). Aiken (1980) has long conceptualized attitude as a “learned predisposition to respond positively or negatively to certain objects, situations, concepts, or persons” (p. 2), and
Neale (1969) has defined attitude towards mathematics as an aggregated measure of “a liking or disliking of mathematics, a tendency to engage in or avoid mathematical activities, a belief that one is good or bad at mathematics, and a belief that mathematics is useful or useless” (p. 632). Recently, Scherer and Gustafsson (2015) pointed out that student openness and perseverance in problem-solving are promising indicators of student willingness to engage in problem-solving.
The overall PISA 2012 assessment framework, on which the PISA 2012 DPS is based, examines hundreds of variables potentially affecting student performance in digital problem-solving. These variables are conceptualized at three levels: Student, parent/family, and school (OECD, 2013). The sampled survey data are collected using various questionnaires that are specifically designed for the students, their parents, and the schools. However, due to the complexity of the data, very few studies have examined these variables simultaneously to explore patterns and relationships with student digital problem-solving performance. This is mainly due to the lack of versatile methodologies and tools available to analyze the immense computer-generated log file data. In PISA 2012 DPS, students’ problem-solving behavioral processes are documented in the task-specific log files, including response
time, number of clicks, content of clicks, access sequences, and so on (OECD,
2014b). This crude, disordered data needs to be pre-processed before usage in data analyses packages.
Educational Data Mining of Big Data Using CART
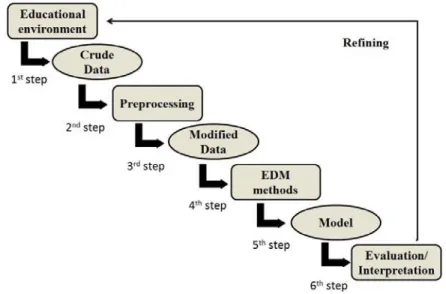
Knowledge Discovery in Database (KDD), often called data mining, is a technique of discovering patterns of knowledge from very large quantities of data big data (Han, Kamber, & Pei, 2011). Big data have five primary features commonly referred to as the 5Vs: Volume, variety, velocity, value, and veracity (Chiou, 2015; De Mauro, Greco, & Grimaldi, 2015). Big datasets include vast amounts of data collected from various sources and updated speedily. This data must be readily explored with proper tools to obtain veracious and valuable information for model building and decision making. Bousbia and Belamri (2014) proposed an educational data mining application process (see Figure 2), which is based on the models of Sachin and Vijay (2012), and Romero and Ventura (2013).
Figure 2. The educational data mining application process (Adapted from: Bousbia &
Belamri, 2014, p. 12)
The educational data mining application process is a stepwise process. The first step is to collect the crude data from the educational environment, the forms of which are often disorganized numbers and words. Hence, preprocessing into well-organized data, recognizable by statistical software, is required. However, it still cannot be used and must be modified further into several analyzable task-specific indicators (e.g., those of TRAFFIC examined in this study in accordance with the task design and the associated coding guide). Then, researchers can use these indicators to conduct data mining with appropriate analytical tools to discern noteworthy patterns and even models inherent in the data. Finally, researchers need to evaluate and interpret the analytical results. The outcomes of the EDM will be used to improve the educational environment. The PISA 2012 DPS log files can be downloaded at OECD’s official PISA website. It is somewhat organized data which should be modified into analyzable indicators for the mining of reliable and valuable knowledge (i.e., the 4th step of the process in Figure 2).
In recent years, the number of published research articles related to educational data mining has increased, mainly focusing on behavior modeling, performance modeling, and student assessment (Peña-Ayala, 2014; Romero &
Ventura, 2007, 2010). For example, Sanzana, Garrido and Poblete (2015) used the data mining technique of Classification and Regression Tree (CART) to examine students’ academic performance in mathematics. Similarly, Alivernini and Manganelli (2015) studied students’ science performance across the 25 countries participating in PISA 2006, again using CART as a data-mining tool.
In the research literature, some researchers have attempted to use the big data generated by computer delivery platforms to explore students’ problem- solving competence. For instance, Lee (2015) transformed the data collected from an interactive computer testing system into analyzable indicators: Number of times of opportunities to learn, correction duration time, error duration time, and number of hint requests. In another study which used the same database as the present study, Greiff et al. (2015) examined the PISA 2012 DPS log files to explore students’ problem-solving competence across the 43 participating economies. The researchers found that students’ problem- solving performance is related to whether the sampled students have applied the optimal strategy called “Vary-One-Thing-at-A-Time” (i.e., VOTAT) in the problem-solving process. Of note is that the analysis methodologies used in these pioneer studies can only explore a very limited number of variables. If we want to study the question of what variables and indicators affect students’ problem-solving performance, we should seek to use data mining techniques that can deal with the substantial and chaotic big data with relative ease.
The aim of the present study is to find out what variables (student, parent/family, and school) and task-specific indicators (problem-solving process variables pertaining to a selected problem-solving task: TRAFFIC) may affect students’ problem-solving performance. The data is drawn from the PISA 2012 DPS database, and the analyses are based on the educational data mining technique CART to be elucidated in the ensuing sections of this paper.
Methodology
Data Source and Participants
The participants are 2,651 fifteen-year-old high-performing problem-
solving experts and low-performing problem-solving novices who have
performing economies in the PISA 2012 DPS. The participants comprise 1,075 students from seven Eastern economies (i.e., Singapore, Korea, Japan, Macao, Hong Kong, Shanghai, and Taiwan) and 1,576 students from three Western economies (Canada, Australia, and Finland). Because the performance of students in these top ten economies has more referential and learning value than other PISA 2012 participating economies, and the number of students in the top ten high-performing Eastern and Western economies who have responded to the TRAFFIC problem task are of comparable magnitudes (i.e., 1,075 compared to 1,576 student log files to be analyzed), the sample sizes are sufficient to conduct the EDM procedure from a big data perspective.
In PISA 2012, each student was randomly assigned one of the 24 digital test forms containing clusters of problem-solving, mathematics and/or reading test units delivered on computer-based platforms, which took students approximately 40 minutes to complete. Hence, no sampled student has the chance to respond to all 16 digital problem tasks (test units), and depending on the test form assigned, a typical student has the chance to respond to 2-5 problem tasks during the 40 minute test session.
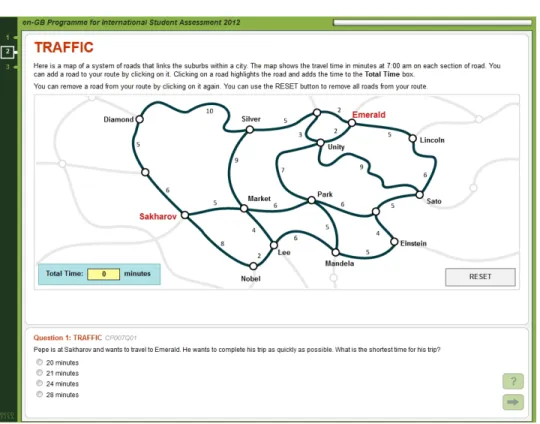
As a trial study, based on the contents of the four PISA 2012 DPS released problem tasks from which the student log files are available for public scrutiny, a good start is to select a digital problem-solving task (or its sub-task such as TRAFFIC examined in this study; see Figure 3 for the item stimulus and the four-option multiple-choice question) that is capable of exhibiting the most basic feature of the digital problem-solving processes, i.e.,
there is an optimal problem-solving path as envisaged in the test design and the associated coding guides.
According to PISA 2012 DPS framework (OECD, 2013), TRAFFIC requires students to demonstrate their abilities in planning and executing, which are two of the four key steps of the problem-solving process (i.e.,
understanding, planning, executing, and evaluating). According to the
description of the competence of a level 5 or 6 student in the PISA 2012 DPS, the ability to discern the optimal strategy to solve a problem is the key characteristic of a high-performing problem-solving expert. Hence, this study chooses problem tasks with a problem-solving strategy to find the optimal solution path, with the conviction that it is thereby possible to classify experts and novices to the greatest extent.
Figure 3. PISA 2012 digital problem-solving task: TRAFFIC (Source: http://erasq.acer.edu.au/)
In a nutshell, computer-generated log files of TRAFFIC, as well as student responses in the student, parent, and school questionnaires, form the corpus of data analyzed in this study.
In TRAFFIC, examinees need to click the lines connecting locations to select the roads, and then the computer will calculate the total travelling time in minutes. The examinee may choose many possible paths, e.g., Sakharov- Market-Silver-Emerald, the total travelling time of which is 21 minutes. This study analyzes all six possible paths with a total travelling time less than 30 minutes. The shortest route is Sakharov-Market-Park-Unity-Emerald, which requires 20 minutes travelling time.
Every behavioral step of the examinee is documented in computer- generated log files. The TRAFFIC log file contains seven distinct columns: Country, School ID, Student ID, Event (student’s behavior), Time (how many
seconds duration), Event-number (the number of steps), and Event-value (changes visualized on the screen). The present study compiled and explored four task-specific indicators from the log files of TRAFFIC: (1) Response time
for solving a problem task, (2) Total number of steps for solving a problem task, (3) Discovery of the possible paths of the problem task (Yes/No), and (4) Discovery of the optimal solution path of the problem task (Yes/No). These
four indicators are the outcomes at the step 4 of the EDM application process (see Figure 2).
Variables
In this study, the dependent variable of CART is a dichotomous variable (Problem-solving expert versus Problem-solving novice). The two groups of students are classified by problem-solving proficiency levels, which are delineated from the students’ PISA 2012 digital problem-solving scores. A problem-solving expert is a student with a high proficiency level above 4; and the problem-solving novice is a student with a low proficiency level below 2. The independent variables of CART are data collected from questionnaires at the student, parent/family, and school levels (see Table 1). For details of these variables, readers are encouraged to consult the PISA 2012 Assessment and
Analytical Framework (OECD, 2013) and the PISA 2012 Technical Report
(OECD, 2014b). Among these 91 variables listed, four are task-specific indicator variables of TRAFFIC that are extracted and organized from the digital problem-solving log files.
Method
This study employed the EDM technique CART to analyze the large number of variables and big data. A traditional classification and regression method can hardly analyze a large quantity of variables with complex relationships amongst variables simultaneously. However, CART, as a frequently-used method of data mining, can manage complex big data. It has several advantages compared with other classification and regression methods. Firstly, CART can analyze hundreds of independent variables, nominal, ordinal or continuous, which belong to different levels of measurement. Secondly, no assumptionismaderegardingtheunderlyingdistribution of the
Table 1
Selected Variables from the PISA 2012 Database for Addressing the Research Question
Variable type Classification Variable label Personal Student
background
Gender
Grade repetition in earlier grades
Environment Family background Index of economic, social and cultural status Immigration status
Family structure Wealth
Cultural possessions Home educational resources Parent background Educational level of father
Educational level of mother Highest parental education in years Highest educational level of parents Highest parental occupational status Classroom & instruction Teacher behavior: formative assessment
Teacher behavior: student orientation Teacher behavior: teacher-directed instruction Teacher support
Disciplinary climate
Ability grouping for mathematics classes Mathematics teacher's classroom management Mathematics teacher's support
Cognitive activation in mathematics lessons Teacher student relations
Teacher focus
Teacher participation/autonomy Teacher morale
Schooling & staffing conditions of school
Class size
Extracurricular creative activities at school Mathematics extracurricular activities at school Mathematics extension course types offered Quality of physical infrastructure
Quality of school educational resources Proportion of girls at school
Proportion of certified teachers Proportion of mathematics teachers
Proportion of teachers with university degrees Mathematics teacher-student ratio
Student-teacher ratio
Student-related factors affecting school climate Teacher-related factors affecting school climate Shortage of teaching staff
School policy & leadership
Public or private School autonomy School ownership Total school enrollment
School selectivity/student admission policies Use of assessment
Framing and communicating the school’s goals and curricular development
Instructional leadership
Promoting instructional improvements and professional development
Teacher participation in leadership Index of school responsibility for resource allocation
Index of school responsibility for curriculum and assessment
ICT availability Limitations of the computer as a tool for school learning
ICT availability at school
Ratio of computers for education and number of students
Ratio of computers connected to the web and number of computers
Computer as a tool for school learning ICT availability at home
ICT resources ICT entertainment use
ICT use at home for school-related tasks Time of computer use (minutes) Use of ICT in mathematic lessons Use of ICT at school
Knowledge Disciplinary knowledge Familiarity with mathematical concepts Experiences & learning
time
Experience with applied mathematics tasks at school
Experience with pure mathematics tasks at school
Test language learning time (minutes per week) Mathematics learning time (minutes per week) Science learning time (minutes per week) Out-of-school study time
Skills Task-specific variables from the log files of problem task TRAFFIC
Response time for solving a problem task Total number of steps for solving a problem task Discovery of the possible paths of the problem task (Yes/No)
Discovery of the optimal solution path of the problem task (Yes/No)
Variable type Classification Variable label
Attitudes Schooling/Problem- solving attitudes
Openness for problem solving Perseverance
Attitude towards school: Learning outcomes Attitude towards school: Learning activities Mathematics learning
dispositions
Mathematics behavior Mathematics intentions
Instrumental motivation for mathematics Mathematics interest
Mathematics work ethics Subjective norms in mathematics Beliefs Schooling Sense of belonging to school
Mathematics learning dispositions
Mathematics anxiety
Attributions to failure in mathematics Mathematics self-efficacy
Mathematics self-concept
assumed values of the independent variables. Thirdly, the analyses are not affected by multi-collinearity between independent variables. Fourthly, CART uses sophisticated methods to compensate for missing data. Lastly, the results are relatively simple for non-statisticians to interpret (Allore, Tinetti, Araujo, Hardy, & Peduzzi, 2005; Breiman, Friedman, Olshen, & Stone, 1998; Lewis, 2000; Strobl, Malley, & Tutz, 2009).
The Gini index is the statistical criterion for CART to terminate the iterative partitioning process. The stopping principle underlying the index is to reduce the impurity of the target sample (the parent node) by dividing the subjects into two subgroups (the children nodes) based on a certain independent variable (Strobl, Boulesteix, & Augustin, 2007). A minor impurity means great homogeneity of the subgroups. In the case of this study, a maximally pure node will only consist of students who are problem-solving experts, or only students who are problem-solving novices. The independent variable which can produce the most homogeneous children nodes is automatically selected by CART as the most influential partitioning variable. Subsequently, each child node will be divided into two subgroups by the same means. At this step, the child node turns into a parent node, and the newly-produced subgroups become children nodes. With the continuation of
the partition process, the students are progressively classified into smaller yet more homogeneous sub-groups. The process continues until the reduction of the impurity becomes lower than a predetermined criterion (Gini index .001), or the number of students in the subgroup is lower than a certain threshold (set at 50 in this study) (Strobl et al., 2009).
The tree models, one for the problem-solving expert and novice students of the seven Eastern economies (1,075 students), and the other for the three Western economies (1,576 students) who have responded to the TRAFFIC problem-solving task, were developed on a training sample that was randomly selected from the whole sample, with a sampling fraction of 60%. The results were subsequently validated on a test sample, which was randomly selected from the whole sample with a sampling fraction of 40%. Finally, the accuracy of the two tree models was estimated using cross-validation techniques (Breiman et al., 1998).
Results
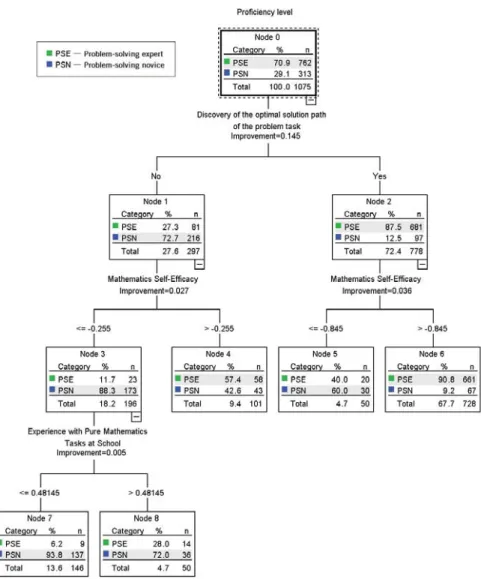
Figure 4 shows the classification tree produced by CART exploring the problem-solving model of TRAFFIC for the problem-solving expert and novice students of the seven high-performing Eastern economies. It has 5 terminal nodes (subgroups): Node 4, node 5, node 6, node 7, and node 8. Students in node 4 and node 6 are predicted as problem-solving experts; whereas students in node 5, node 7, and node 8 are predicted as problem- solving novices. The overall percentage of correct prediction is 86%.
Amongst the 91 variables analyzed by CART, the most important factor is the problem-solving strategy of finding the optimal solution path to the destination. If student finds the optimal solution, the probability to be a problem-solving expert goes up from 70.9% to 87.5% (node 2). However, if the student does not have the ability to find the optimal solution, the probability of becoming a problem-solving expert decreases drastically from 70.9% to 27.3% (node 1).
Mathematics self-efficacy is also an important factor for students of the top-performing Eastern economies. In the literature, the term self-efficacy is used to describe an individual’s belief that through one’s actions, one can
Figure 4. Results of the CART analysis of the Eastern economies
produce desired effects. This in turn is a powerful incentive to persevere in the face of difficulties (Bandura, 1977a). Mathematics self-efficacy refers to an individual’s conviction that one can successfully perform mathematics tasks at designated levels of performance (Schunk, 1991). In the PISA study, mathematics self-efficacy assessed students’ confidence about performing the following mathematics tasks: Solving an equation like 3x 5 17; calculating
how much cheaper a TV would be after a 30% discount; understanding graphs presented in newspapers; and so on. For students who have the problem- solving strategy to find the optimal solution path (on the right-hand side of the classification tree), and if mathematics self-efficacy is higher than 0.845 (at the 20th percentile of the construct), the percentage of problem-solving experts goes up from 87.5% to 90.8% (node 6); and if mathematics self-efficacy is equal or lower than 0.845, the percentage of problem-solving experts decreases drastically from 87.5% to 40.0% (node 5). For students who do not have the problem-solving strategy to find the optimal path (on the left-hand side of the tree), and if mathematics self-efficacy is higher than 0.255 (at the 60th percentile), the percentage of problem-solving experts increases visibly from 27.3% to 57.4% (node 4); and if mathematics self-efficacy is equal or lower than 0.255, the percentage of problem-solving experts decreases from 27.3% to 11.7% (node 3).
However, the percentage of problem-solving experts in node 3 can be improved by having more student experiences with pure mathematics tasks at school. This factor inquires about the frequency of student experiences with pure mathematics tasks such as 6x2 5 29 at school. If the score of the factor is higher than 0.481 (at the 40th percentile), the percentage of problem- solving experts increases from 11.7% to 28.0% (node 8); but if it is equal or lower than 0.481, the percentage of problem-solving experts decreases from 11.7% to 6.2% (node 7).
Figure 5 shows the classification tree of the problem-solving model of TRAFFIC for the problem-solving expert and novice students of the three top- performing Western economies. This tree has 6 terminal nodes (subgroups): Node 3, node 5, node 6, node 7, node 9 and node 10. Students in node 6 and node 10 will be predicted as problem-solving experts; while students in node 3, node 5, node 7 and node 9 will be predicted as problem-solving novices. The overall percentage of correct prediction is 87%.
Amongst the 91 variables analyzed by CART, the most important factor is mathematics self-efficacy. If an individual’s mathematics self-efficacy is higher than 0.145 (at the 60th percentile of the construct), the percentage of problem- solving experts increases visibly from 43.7% to 77.8% (node 2); and if students’ mathematics self-efficacy is equal or lower than 0.145, the percentage of problem-solving experts decreases from 43.7% to 17.7% (node 1).
The second important factor analyzed by CART is the strategy of finding the optimal solution path to the destination. For students whose mathematics self-efficacy is higher than 0.145 (on the right-hand side of the tree), and if one has the ability to conceive the optimal solution, the probability to be a problem-solving expert increases a bit from 77.8% to 89.3% (node 6); but if one does not have the ability to find the optimal solution path, the probability to be a problem-solving expert decreases noticeably from 77.8% to 27.6% (node 5). Likewise, for students whose mathematics self-efficacy is equal or lower than 0.145 (on the left-hand side of the tree), if one has the ability to find the optimal solution path, the probability to be a problem-solving expert increases from 17.7% to 37.3% (node 4); but if one does not have the ability to find the optimal solution path, the probability to be a problem-solving expert decreases from 17.7% to a near-zero 1.8% (node 3).
Nevertheless, the percentage of problem-solving experts on the left branch can be improved. For students in node 4, if they are familiar with mathematical concepts such as exponential function, divisor, or linear
equation, i.e., with score higher than 0.58 (at the 30th percentile), the probability of being problem-solving experts increases noticeably from 37.3% to 53.2% (node 8); but if they are not familiar with mathematical concepts, i.e., with score equal or lower than 0.58, the probability of being problem-solving experts decreases visibly from 37.3% to 5.9% (node 7).
Furthermore, for students in node 8, having a higher mathematics work ethics can also improve the percentage of problem-solving experts. In PISA 2012, mathematics work ethics refers to the extent with which students agree with the following statements: I work hard on my mathematics homework; I
study hard for mathematics quizzes; I pay attention in mathematics class; I keep my mathematics work well organized; and so on. For students in node 8,
if the score of mathematics work ethics is higher than 0.127 (at the 40th percentile), the probability of their being problem-solving experts goes up a bit from 53.2% to 63.5% (node 10); but if the score of mathematics work ethics is equal to or lower than 0.127, the probability of their being problem- solving experts decreases from 53.2% to 31.4% (node 9).
Comparing the two problem-solving tree models of TRAFFIC between Eastern and Western economies, we can observe that: (1) the factors having the strongest influence classifying whether a student is a problem-solving
expert or a problem-solving novice in both Eastern and Western economies are essentially at the student-level; (2) The strategy of finding the optimal solution path has the strongest influence on classifying whether a student is a problem-solving expert or a problem-solving novice in the seven top- performing Eastern economies; however, the most important factor in classifying a student as a problem-solving expert or a problem-solving novice is mathematics self-efficacy in the three high-performing Western economies; (3) Besides the two factors of finding the optimal solution path and mathematics self-efficacy, students’ problem-solving proficiency is also affected by student experiences with pure mathematics tasks at school in the Eastern economies, and by familiarity with mathematical concepts, as well as mathematics work ethics, in the Western economies.
Discussions
Factors Classifying Whether a Student is a Problem-Solving Expert or Novice in High-Performing Eastern and Western Economies
This study adopted an exploratory approach to find out the most important factors that classify whether a student is a problem-solving expert or a problem-solving novice, respectively, in the top ten high-performing Eastern and Western economies. The factors identified can be classified into three categories: (1) knowledge (i.e., experience with pure mathematics tasks
at school, familiarity with mathematical concepts); (2) problem-solving skills
(i.e., discovery of the optimal solution path of the problem task); (3) attitudes and beliefs (i.e., mathematics self-efficacy, mathematics work ethics). Student problem-solving competence is affected by factors listed in these three categories, whether in Eastern or Western economies. All listed factors are student-level factors.
Students’ knowledge, skills, attitudes and beliefs have significant bearings on their problem-solving competence. Many researchers assert that disciplinary knowledge plays an important role in solving problems (Brand-Gruwel et al., 2005; Elio & Scharf, 1990; Mayer, 1998). The study results of Brand-Gruwel et al. (2005) reveal that problem-solving experts activate their prior knowledge more often than problem-solving novices,
which is consistent with the findings of the present study. Students who are familiar with disciplinary knowledge, or have more experience with tasks related to this knowledge, will have a greater possibility to become a problem-solving expert.
Additionally, researchers have found that the crucial difference between problem-solving experts and novices are how they organize knowledge (Chi, Feltovich, & Glaser, 1981; Larkin, McDermott, D. P. Simon, & H. A. Simon, 1980) and how they use knowledge during problem solving (Elio & Scharf, 1990). Amongst the many problem-solving skills, the ability to find the optimal solution path is especially essential for an individual to become a problem- solving expert (Slack & Stewart, 1990). Based on the log file data of a problem-solving task other than TRAFFIC in PISA 2012 DPS, Greiff et al. (2015) found that students’ problem-solving performance is related to whether or not they have applied the optimal strategy of VOTAT. In retrospect, three decades ago, Smith and Good (1984) identified 32 problem-solving strategies that problem-solving experts and novices used differently. For instance, the researchers observed that successful problem solvers tend to break the problem into smaller parts, and then solve the parts step by step; compare the work done in various parts of the problem for consistency; and then consider one variable at a time, and so on.
The present study finds that attitude plays a substantial role in classifying one’s level of problem-solving proficiency. The Framework of Singapore
School Mathematics Curriculum, devised by one of the high-performing
Eastern economies examined in the present study, suggests that attitudes toward mathematical problem-solving include beliefs, interests, appreciation, confidence, and perseverance (Kaur & Har, 2009). Additionally, according to Aiken (1980), attitude is a learned predisposition to respond positively or negatively to certain objects, situations, concepts, or persons. Mandler (1989) has further argued that a negative attitude is the result of frequent failures, or interruptions of planned actions when solving mathematical problems. Repeated emotional reactions result in the development of a relatively permanent schema about mathematics, which will affect the formation of a student’s mathematics self-efficacy. Hence, one’s mathematics self-efficacy is very important when one is engaged in solving a mathematical problem, such
as the TRAFFIC problem in this study. Finally, Nicolaidou and Philippou’s study (2003) showed that attitudes and self-efficacy correlate to predict achievement in problem-solving; moreover, self-efficacy is a more powerful predictor than attitude.
In PISA 2012, mathematics work ethics refers to how hardworking and conscientious a student is while learning mathematics. Most people believe hard work, or learning conscientiously, is one of the most important factors to improve one’s performance. In the research literature, hard work and conscientious learning do have some positive influence on one’s academic performance. In Poropat’s (2009) research, academic performance was found to correlate positively and significantly with conscientiousness. Likewise, the results of Cooper, Robinson, and Patall (2006) found generally consistent evidence for a positive influence of homework on achievement. Nevertheless, no research has yet proven that work ethics is the most important factor classifying whether a student is high-performing or low-performing. In this study, mathematics work ethics is found to affect students’ level of problem- solving proficiency, but not as much as mathematics self-efficacy, problem- solving strategies, or familiarity with mathematical concepts.
Relative Importance of Factors Identified Between Eastern and Western Economies
In both Eastern and Western economies, whether a student is a problem- solving expert or a novice is affected by one’s possession of disciplinary knowledge, task-specific problem-solving skills, and favorable student attitudes and beliefs. However, differences still exist between students of Eastern and Western economies:
(1) Possession of task-specific problem-solving skills is the most important factor in the Eastern economies, while the exhibition of mathematics self-efficacy is the most important factor in the Western economies. This may be due to cultural differences in classroom practices of the Eastern and Western educational systems schools in Eastern economies focus more on knowledge acquisition and skills training, whereas schools in Western economies put more emphasis on student cognitive and psychological development. Eastern students, especially those associated
with the Confucian heritage culture, have been reported to have a stronger preference for high-level and meaning-based learning strategies. They also have more time to discuss problem-solving strategies in class than Western students (Biggs, 1994). These help students perform better when solving problems.
Klassen (2004) reviewed several studies comparing students’ self- efficacy between Eastern and Western countries, and found that for the most part, Eastern students’ self-efficacy is lower than Western students. Moreover, self-efficacy is shown to be a strong predictor of student performance in Western, but not in Eastern education systems. This finding is consistent with the findings of the present study.
(2) Mathematics work ethics affects a student’s level of problem-solving proficiency in the Western economies more than in Eastern economies. A plausible explanation to this unexpected finding is that students in the Eastern economies generally are quite hard-working, and are accustomed to attribute their success to effort, whereas students in the Western economies tend to attribute their success to ability (Biggs, 1994; Hess & Azuma, 1991). Because most of the students of the high-performing Eastern economies are generally hard-working, the factor of mathematics work ethics does not stand out to be a decisive factor to classify problem-solving experts and novices in the present study. For the students of the high-performing Western economies, although students can increase self-efficacy and hence performance by believing that academic success hinges upon confidence in one’s own ability, their problem-solving performance can also be improved considerably by adopting a growth mindset of which hard work and conscientiousness are essential components (Boaler, 2013; Dweck, 2006).
Conclusions and Recommendations
Based on the PISA 2012 digital problem-solving assessment log files, as well as responses to the student, parent and school questionnaires, the present study used the data mining technique of classification and regression tree (CART) to discern which factors classify whether a student is a high- performing problem-solving expert or low-performing novice in the two
groups of students of the top ten high-performing Eastern and Western economies. The results showed that: (1) in the seven Eastern economies, amongst the 91 variables under examination, three factors that are found to have major influence in determining students’ problem-solving proficiency levels are: Discovery of the optimal solution path of the problem task,
Mathematics self-efficacy, and Experience with pure mathematics tasks at school; (2) in the three Western economies, the factors which have influence
in classifying students’ problem-solving proficiency levels are: Mathematics
self-efficacy, Discovery of the optimal solution path of the problem task, Familiarity with mathematical concepts, and Mathematics work ethics. All of
the factors identified are student-level variables.
With regard to the factors identified, there are some subtle differences between the high-performing Eastern and Western economies. Firstly,
Discovery of the optimal solution path of the problem task has the strongest
influence in classifying whether a student is a problem-solving expert or a problem-solving novice in the Eastern economies, while Mathematics self-
efficacy has a greater influence in the Western economies. In addition, besides
the factors of Discovery of the optimal solution path of the problem task, and
Mathematics self-efficacy, student problem-solving proficiency is also
affected by Experience with pure mathematics tasks at school in Eastern economies, and Familiarity with mathematical concepts and Mathematics
work ethics in Western economies. The implication is that teachers should
design problem-based learning based on these findings, with due attention paid to helping students organize and acquire essential knowledge, learn the task-specific problem-solving strategies, and develop self-efficacy and work ethics purposefully.
Educators have long argued that the traditional mode of teaching with a focus on knowledge acquisition is not beneficial for students to develop integrative competence, such as the digital problem-solving competence in this study (Blank, 1982). One viable approach for contemporary teaching is to emphasize the cultivation of students’ positive learning attitudes and beliefs. According to the results of this study, teachers should not only focus on disciplinary knowledge and skills, but also attitudes and beliefs. In the Eastern cultural context, enhancing students’ task-specific problem-solving skills is more effective in raising student problem-solving competence, while in the
Western cultural context, helping students to develop self-efficacy is more efficient to improve student problem-solving ability. Increasing student mathematics work ethics also has a moderate positive effect on student problem-solving performance in the high-performing Western economies.
Among the many factors related to student attitudes and beliefs, self- efficacy is confirmed in this study to have the strongest influence on students’ digital problem-solving competence. Therefore, how can teachers develop students’ self-efficacy? According to Bandura’s (1977b) social learning theory, an individual’s self-efficacy may come from four main informational sources: (1) An individual’s performance accomplishment provides the most influential efficacy because it is based on personal mastery experiences; (2) vicarious experiences of observing others succeed through their efforts; (3) verbal persuasions in order to cope with circumstances successfully; and (4) states of physiological arousal from which people judge their level of anxiety and vulnerability to stress. In school environments, teachers can provide more opportunities for students to master problem-solving tasks that are appropriately set at their ability levels. Collaborative learning is also an effective way to help students gain successful experience from others, and meanwhile develop their own self-efficacy.
References
Aiken, L. R. (1980). Attitude measurement and research. New Directions for Testing
and Measurement, 7, 1-24.
Alivernini, F., & Manganelli, S. (2015). Country, school and students factors associated with extreme levels of science literacy across 25 countries.
International Journal of Science Education, 37(12), 1992-2012.
doi:10.1080/09500693.2015.1060648
Allore, H., Tinetti, M. E., Araujo, K. L., Hardy, S., & Peduzzi, P. (2005). A case study found that a regression tree outperformed multiple linear regression in predicting the relationship between impairments and social and productive activities scores.
Journal of Clinical Epidemiology, 58(2), 154-161.
doi:10.1016/j.jclinepi.2004.09.001
Baker, R. S. J. D. (2010). Data mining. In P. Peterson, E. Baker, & B. McGaw (Eds.),
International encyclopedia of education (3rd ed., Vol. 7, pp. 112-118). Oxford,
England: Academic Press.
Bandura, A. (1977a). Self-efficacy: Toward a unifying theory of behavioral change.
Psychological Review, 84(2), 191-215. doi:10.1037/0033-295X.84.2.191
Bandura, A. (1977b). Social learning theory. New York, NY: General Learning Press. Biggs, J. (1994). What are effective schools? Lessons from East and West. The
Australian Educational Researcher, 21(1), 19-39.
Blank, W. E. (1982). The competency-based approach to education and training. In Deakin University Course Development Centre (Ed.), A collection of readings
related to competency-based training (pp. 3-27). Victoria, Australia: Deakin
University.
Boaler, J. (2013). Ability and mathematics: The mindset resolution that is reshaping education. FORUM, 55(1), 143-152.
Bousbia, N., & Belamri, I. (2014). Which contribution does EDM provide to computer-based learning environments? In A. Peña-Ayala (Ed.), Educational
data mining (pp. 3-28). Cham, Switzerland: Springer.
Brand-Gruwel, S., Wopereis, I., & Vermetten, Y. (2005). Information problem solving by experts and novices: Analysis of a complex cognitive skill. Computers in
Human Behavior, 21(3), 487-508. doi:10.1016/j.chb.2004.10.005
Breiman, L., Friedman, J., Olshen, R., & Stone, C. (1998). Classification and
regression trees. Boca Raton, FL: CRC Press.
Cai, J. (1995). A cognitive analysis of US and Chinese students’ mathematical performance on tasks involving computation, simple problem solving, and complex problem solving. Journal for Research in Mathematics Education,
Monograph, i-151. doi:10.2307/749940
Casner-Lotto, J., & Barrington, L. (2006). Are they really ready to work? Employers’
perspectives on the basic knowledge and applied skills of new entrants to the 21st century workforce. Washington, DC: Conference Board.
Chang, L., Mak, M. C., Li, T., Wu, B. P., Chen, B. B., & Lu, H. J. (2011). Cultural adaptations to environmental variability: An evolutionary account of East-West differences. Educational Psychology Review, 23(1), 99-129.
doi:10.1007/s10648-010-9149-0
Chi, M. T. H., Feltovich, P. J., & Glaser, R. (1981). Categorization and representation of physics problems by experts and novices. Cognitive Science, 5(2), 121-152. doi:10.1207/s15516709cog0502_2
Chiou, H. J. (2015, December). From small data to big data: The role of
psychometrics in data science. Paper presented at the 2015 Global Chinese
Conference on Educational Information and Assessment & Chinese Association of Psychological Testing 2015 Annual Conference, Taichung, Taiwan.
Cooper, H., Robinson, J. C., & Patall, E. A. (2006). Does homework improve academic achievement? A synthesis of research, 1987-2003. Review of
Educational Research, 76(1), 1-62. doi:10.3102/00346543076001001
De Mauro, A., Greco, M., & Grimaldi, M. (2015). What is big data? A consensual definition and a review of key research topics. Proceedings of the AIP
Conference, 1644(1), 97-104. doi:10.1063/1.4907823
Dweck, C. S. (2006). Mindset: The new psychology of success. New York, NY: Balantine Books.
Elio, R., & Scharf, P. B. (1990). Modeling novice-to-expert shifts in problem-solving strategy and knowledge organization. Cognitive Science, 14(4), 579-639. doi:10.1207/s15516709cog1404_4
Goos, M., & Galbraith, P. (1996). Do it this way! Metacognitive strategies in collaborative mathematical problem solving. Educational Studies in Mathematics,
30(3), 229-260. doi:10.1007/BF00304567
Greiff, S., Wüstenberg, S., & Avvisati, F. (2015). Computer-generated log-file analyses as a window into students’ minds? A showcase study based on the PISA 2012 assessment of problem solving. Computers & Education, 91, 92-105. doi:10.1007/BF00304567
Han, J., Kamber, M., & Pei, J. (2011). Data mining: Concepts and techniques. Waltham, MA: Morgan Kaufmann Publishers.
Hess, R. D., & Azuma, M. (1991). Cultural support for schooling: Contrasts between Japan and the United States. Educational Researcher, 20(9), 2-8. doi:10.3102/0013189X020009002
Ho, D. Y. F. (1991, June-July). Cognitive socialization in Confucian heritage cultures. Presented at the Workshop on Continuities and Discontinuities in the Cognitive Socialization of Minority Children, Department of Health and Human Services, Washington, DC.
Kaur, B., & Har, B. Y. (2009). Mathematical problem solving in Singapore schools. In B. Kaur, Y. B. Har, & M. Kapur (Eds.), Mathematical problem solving:
Yearbook 2009, Association of Mathematics Educators (pp. 3-13). Singapore:
Klassen, R. M. (2004). Optimism and realism: A review of self-efficacy from a cross-cultural perspective. International Journal of Psychology, 39(3), 205-230. doi:10.1080/00207590344000330
Larkin, J. H., McDermott, J., Simon, D. P., & Simon, H. A. (1980). Models of competence in solving physics problems. Cognitive Science, 4(4), 317-345. doi:10.1207/s15516709cog0404_1
Lee, Y. J. (2015). Analyzing log files to predict students’ problem solving performance in a computer-based physics tutor. Journal of Educational
Technology & Society, 18(2), 225-236.
Lewis, R. J. (2000). An introduction to classification and regression tree (CART)
analysis. Paper presented at the 2000 Annual Meeting of the Society for
Academic Emergency Medicine, San Francisco, California.
Mandler, G. (1989). Affect and learning: Causes and consequences of emotional interactions. In D. B. McLeod & V. M. Adams (Eds.), Affect and mathematical
problem-solving: A new perspective (pp. 3-19). New York, NY: Springer-Verlag.
Mayer, R. E. (1998). Cognitive, metacognitive, and motivational aspects of problem solving. Instructional Science, 26(1-2), 49-63. doi:10.1023/A:1003088013286 Neale, D. C. (1969). The role of attitudes in learning mathematics. The Arithmetic
Teacher, 16(8), 631-640.
Nicolaidou, M., & Philippou, G. (2003). Attitudes towards mathematics, self-efficacy and achievement in problem solving. In M. A. Mariotti (Ed.), European research
in mathematics education III. Pisa, Italy: University of Pisa.
Organization for Economic Cooperation and Development (2004). Problem solving for
tomorrow’s world: First measures of cross-curricular competencies from PISA 2003. Paris, France: Author.
Organization for Economic Cooperation and Development (2013). PISA 2012
assessment and analytical framework: Mathematics, reading, science, problem solving and financial literacy. Paris, France: Author.
Organization for Economic Cooperation and Development (2014a). PISA 2012 results:
Creative problem solving: Students’ skills in tackling real-life problems (Vol. 5).
Paris, France: Author.
Organization for Economic Cooperation and Development (2014b). PISA 2012
technical report. Paris, France: Author.
Organization for Economic Cooperation and Development (2016). Global competence
for an inclusive world. Paris, France: Author.
Peña-Ayala, A. (2014). Educational data mining: A survey and a data mining-based analysis of recent works. Expert Systems with Applications, 41(4), 1432-1462. doi:10.1016/j.eswa.2013.08.042
Peter S., Judith M., & Robyn J. (2009). Tasks and pedagogies that facilitate mathematical problem solving. In B. Kaur, Y. B. Har, & M. Kapur (Eds.),
Mathematical problem solving: Yearbook 2009, Association of Mathematics Educators (pp. 17-42). Singapore: World Scientific.
Poropat, A. E. (2009). A meta-analysis of the five-factor model of personality and academic performance. Psychological Bulletin, 135(2), 322-338.
Romero, C., & Ventura, S. (2007). Educational data mining: A survey from 1995 to 2005. Expert Systems with Applications, 33(1), 135-146.
doi:10.1016/j.eswa.2006.04.005
Romero, C., & Ventura, S. (2010). Educational data mining: A review of the state of the art. IEEE Transactions on Systems, Man, and Cybernetics, Part C
(Applications and Reviews), 40(6), 601-618. doi:10.1109/TSMCC.2010.2053532
Romero, C., & Ventura, S. (2013). Data mining in education. Wiley Interdisciplinary
Reviews Data Mining and Knowledge Discovery, 3(1), 12-27.
doi:10.1002/widm.1075
Sachin, R. B., & Vijay, M. S. (2012). A survey and future vision of data mining in
educational field. Proceedings of the 2012 Second International Conference on
Advanced Computing & Communication Technologies, 96-100. doi:10.1109/ACCT.2012.14
Sanzana, M. B., Garrido, S. S., & Poblete, C. M. (2015). Profiles of Chilean students according to academic performance in mathematics: An exploratory study using classification trees and random forests. Studies in Educational Evaluation, 44, 50-59. doi:10.1016/j.stueduc.2015.01.002
Scherer, R., & Gustafsson, J. E. (2015). The relations among openness, perseverance, and performance in creative problem solving: A substantive-methodological approach. Thinking Skills and Creativity, 18, 4-17. doi:10.1016/j.tsc.2015.04.004 Schunk, D. H. (1991). Self-efficacy and academic motivation. Education Psychology,
26, 207-231. doi:10.1080/00461520.1991.9653133
Slack, S. J., & Stewart, J. (1990). High school students’ problem‐solving performance on realistic genetics problems. Journal of Research in Science Teaching, 27(1), 55-67. doi:10.1002/tea.3660270106
Smith, M. U., & Good, R. (1984). Problem solving and classical genetics: Successful versus unsuccessful performance. Journal of Research in Science Teaching,
21(9), 895-912. doi:10.1002/tea.3660210905
Strobl, C., Boulesteix, A. L., & Augustin, T. (2007). Unbiased split selection for classification trees based on the Gini index. Computational Statistics & Data
Analysis, 52(1), 483-501. doi:10.1016/j.csda.2006.12.030
Strobl, C., Malley, J., & Tutz, G. (2009). An introduction to recursive partitioning: Rationale, application, and characteristics of classification and regression trees, bagging, and random forests. Psychological Methods, 14(4), 323-348. doi:10.1037/a0016973
Trilling, B., & Fadel, C. (2009). 21st century skills: Learning for life in our times. San Francisco, CA: Jossey-Bass.