The
new england
journal
of
medicine
established in 1812 january 4, 2007 vol. 356 no. 1
A Five-Gene Signature and Clinical Outcome
in Non–Small-Cell Lung Cancer
Hsuan-Yu Chen, M.Sc., Sung-Liang Yu, Ph.D., Chun-Houh Chen, Ph.D., Gee-Chen Chang, M.D., Ph.D., Chih-Yi Chen, M.D., Ang Yuan, M.D., Ph.D., Chiou-Ling Cheng, M.Sc., Chien-Hsun Wang, M.Sc., Harn-Jing Terng, Ph.D., Shu-Fang Kao, M.Sc., Wing-Kai Chan, M.D., Han-Ni Li, M.Sc., Chun-Chi Liu, M.Sc.,
Sher Singh, Ph.D., Wei J. Chen, M.D., Sc.D., Jeremy J.W. Chen, Ph.D., and Pan-Chyr Yang, M.D., Ph.D.
A B S T R A C T
From National Taiwan University College of Public Health (H.-Y.C., W.J.C.), Nation-al Taiwan University College of Medicine (H.-Y.C., S.-L.Y., C.-L.C., C.-H.W., S.-F.K., H.-N.L., S.S., W.J.C., J.J.W.C., P.-C.Y.), Aca-demia Sinica (C.-H.C, P.-C.Y.), National Taiwan University Hospital (A.Y., W.-K.C., P.-C.Y.), and Advpharma (H.-J.T.) — all in Taipei, Taiwan; and Taichung Veterans General Hospital (G.-C.C., C.-Y.C.) and Na-tional Chung-Hsing University (G.-C.C., C.-C.L., J.J.W.C.) — both in Taichung, Tai-wan. Address reprint requests to Dr. Yang at the Department of Internal Medicine, National Taiwan University Hospital, No. 7, Chung-Shan S. Rd., Taipei, Taiwan 100, or at [email protected].
Drs. W.J. Chen, J.J.W. Chen, and P.C. Yang contributed equally to this article. N Engl J Med 2007;356:11-20.
Copyright © 2007 Massachusetts Medical Society.
Background
Current staging methods are inadequate for predicting the outcome of treatment of non–small-cell lung cancer (NSCLC). We developed a five-gene signature that is closely associated with survival of patients with NSCLC.
Methods
We used computer-generated random numbers to assign 185 frozen specimens for microarray analysis, real-time reverse-transcriptase polymerase chain reaction (RT-PCR) analysis, or both. We studied gene expression in frozen specimens of lung-cancer tissue from 125 randomly selected patients who had undergone surgical resec-tion of NSCLC and evaluated the associaresec-tion between the level of expression and survival. We used risk scores and decision-tree analysis to develop a gene-expres-sion model for the prediction of the outcome of treatment of NSCLC. For validation, we used randomly assigned specimens from 60 other patients.
Results
Sixteen genes that correlated with survival among patients with NSCLC were identi-fied by analyzing microarray data and risk scores. We selected five genes (DUSP6, MMD,
STAT1, ERBB3, and LCK) for RT-PCR and decision-tree analysis. The five-gene
signa-ture was an independent predictor of relapse-free and overall survival. We validated the model with data from an independent cohort of 60 patients with NSCLC and with a set of published microarray data from 86 patients with NSCLC.
Conclusions
Our five-gene signature is closely associated with relapse-free and overall survival among patients with NSCLC.
L
ung cancer — predominantly non– small-cell lung cancer (NSCLC) — is the most common cause of death from cancer worldwide.1The relapse rate among patients with early-stage NSCLC is 40% within 5 years after po-tentially curative treatment.2
The current staging system for NSCLC is inadequate for predicting the outcome of treatment.
Gene-expression profiling (see Glossary) by means of microarrays3,4
and reverse-transcriptase polymerase chain reaction (RT-PCR)5,6
is useful for classifying tumors and formulating a prognosis for patients with various types of cancer,7-9
in-cluding lung cancer.10-16
The use of microarrays in clinical practice is limited, however, by the large number of genes used in gene profiling,17 the need for complicated methods, and the lack of both reproducibility and independent valida-tion. The genes selected for profiling in studies of lung cancer have varied considerably; only a few genes have been consistently included.10-13 Moreover, gene-expression profiles can vary ac-cording to the microarray platform and the ana-lytic strategy used.6
The RT-PCR method can be applied to paraffin-embedded pathological specimens and is repro-ducible and applicable in clinical practice. How-ever, RT-PCR can be used to analyze only a small number of genes.17
In a previous study, our group performed microarray analysis of cell lines derived from specimens of invasive NSCLC and identified 672 genes associated with invasive activity.18
We also identified genes (CRMP-1 and HLJ1) that are associated with clinical outcome of patients with NSCLC.19,20
A recent study showed that the results of RT-PCR analysis of eight genes correlated with
the outcomes of patients with adenocarcinoma of the lung.5
In the current study, we examined gene expres-sion in 125 surgical specimens of NSCLC, using microarrays and real-time RT-PCR in order to iden-tify a gene signature that is correlated with the clinical outcome.
M e t h o d s
Patients and Tissue Specimens
We used computer-generated random numbers to assign specimens from 185 consecutive patients for microarray analysis. We studied frozen speci-mens of lung-cancer tissue from 125 randomly se-lected patients who underwent surgical resection of NSCLC at the Taichung Veterans General Hospi-tal between December 1999 and December 2003. Of these 125 specimens, 60 were adenocarcinomas, 52 were squamous-cell carcinomas, and 13 were other types of cancer. We validated the five-gene risk-prediction model using an independent cohort of 60 randomly selected patients who underwent surgical resection of NSCLC at the Taichung Vet-erans General Hospital between November 1999 and December 2003. The patients had not received adjuvant chemotherapy. The study was approved by the institutional review board of the hospital. Written informed consent was obtained from all patients.
Microarray Analysis of Complementary DNA The 672 genes associated with invasive activity, identified in a previous study by our group,18 were rearrayed in duplicate on a nylon membrane. We isolated 4 μg of total RNA from each specimen,
Glossary.
Decision tree: A statistical tool for predicting which patient belongs to which specific class (e.g., good or poor clinical outcome) on the basis of feature information (gene-expression levels), with the use of a recursive-partitioning pro-cess and tree-based classification rules.
Gene-expression profiling: Determination of the level of expression of thousands of genes simultaneously by DNA microarray or real-time RT-PCR.
High-risk gene signature: Aberrant expression of a panel of genes in tissue that signifies a high risk of an adverse out-come (relapse or death in patients with cancer).
Independent cohort: An independent group of patients having clinical characteristics similar to those of an original group of patients in a study. The independent cohort is used to confirm the findings of the original study. Risk gene: A gene for which altered expression in the tissue of interest is associated with an increased risk of an
ad-verse clinical outcome (relapse or death in patients with cancer).
Risk score: A score that predicts the likelihood of an individual patient’s survival on the basis of statistical analysis of risk factors (the expression levels of risk genes) associated with survival.
amplified it using an amplification kit (Ambion), and labeled it with digoxigenin during reverse tran-scription.21 The details of target preparation, hy-bridization, color development, image analysis, and spot quantification have been described previ-ously.18,21,22
RT-PCR Analysis
To validate the levels of expression of genes found on microarray analysis, RT-PCR was performed on 16 genes and a control gene for TATA-box–bind-ing protein (TBP), with the use of specific TaqMan probes and primer sets; the transcripts were am-plified with reagent (TaqMan One-Step RT-PCR Master Mix Reagent, Applied Biosystems) and a sequence detection system (ABI Prism 7900HT, Applied Biosystems). Gene expression was quan-tified in relation to the expression of TBP with the use of sequence detector software and the relative quantification method (Applied Biosystems) (for details, see the Methods section of the Supplemen-tary Appendix, available with the full text of this
article at www.nejm.org). We chose TBP as the in-ternal control for real-time RT-PCR because it is invariant in clinical cancer specimens.23
Statistical Analysis
The 125 specimens were randomly assigned to ei-ther the training set or the testing set (see Table 1 of the Supplementary Appendix). The average in-tensity for each gene in the microarray was as-sessed. To reduce variation among microarrays, the intensity values for samples in each microarray were rescaled by means of a quantile normaliza-tion method.24 To reduce background noise, back-ground intensity values of less than 3000 were as-signed the value of 3000.22 Each intensity value was then log-transformed to a base-2 scale. Genes with coefficients of variation of less than 3% were excluded from further analyses. Finally, the gene-expression intensity values were transformed to ordinal coding values, according to the ranking of the level of gene expression among the 485 genes in 125 patients (60,625 observations). The Table 1. Hazard Ratios for Death from Any Cause for the 125 Patients with NSCLC and Results of Validation
of the 16-Gene Signature.*
Gene UniGene Number Hazard Ratio P Value†
Correlation Coefficient for Microarray Results vs. Real-Time RT-PCR Results P Value‡ ERBB3 Hs.118681 1.73 0.03 0.59 <0.001 LCK Hs.470627 0.43 0.02 0.55 <0.001 DUSP6 Hs.298654 2.12 0.01 0.46 <0.001 STAT1 Hs.470943 0.56 0.02 0.40 <0.001 MMD Hs.463483 2.50 0.04 0.27 0.006 CPEB4 Hs.127126 1.80 0.02 0.16 0.12 RNF4 Hs.66394 1.91 0.02 0.13 0.18 STAT2 Hs.530595 1.80 0.03 0.15 0.12 NF1 Hs.113577 1.60 0.04 −0.15 0.12 FRAP1 Hs.338207 0.46 0.04 −0.12 0.24 DLG2 Hs.503453 3.75 0.004 −0.09 0.37 IRF4 Hs.401013 1.68 0.03 0.06 0.57 ANXA5 Hs.480653 0.34 0.004 0.06 0.57 HMMR Hs.72550 1.67 0.04 −0.03 0.79 HGF Hs.396530 1.66 0.03 0.02 0.82 ZNF264 Hs.515634 1.73 0.01 0.01 0.95
* The hazard ratios are reported for the high-risk signature versus the low-risk signature, as determined by microarray analysis. The first five genes shown were selected for the prediction of survival and used in the decision-tree analysis. † P values for the hazard ratios were estimated by univariate Cox regression analysis of the microarray data.
intensity value was coded as 1 for expression levels ranked as at or below the 25th percentile of the total gene expression, 2 for levels above the 25th and at or below the 50th percentiles, 3 for levels above the 50th and at or below the 75th percen-tiles, and 4 for levels above the 75th percentile.
Hazard ratios from univariate Cox regression analysis were used to determine which genes were associated with death from any cause or recur-rence of cancer. Protective genes were defined as those associated with a hazard ratio for death of less than 1; risk genes were defined as those as-sociated with a hazard ratio for death of more than 1. We used univariate Cox proportional-haz-ards regression analysis to evaluate the association between survival and the level of expression of each gene from microarray analysis.25 For genes that were significantly correlated with survival, we used a linear combination of the gene-expression coding values weighted by the regression coeffi-cients to calculate a risk score for each patient.6,10
16-Gene Signature
Risk scores were calculated for 16 genes. A patient’s risk score was calculated as the sum of the levels of expression of each gene, as measured by micro-array analysis, multiplied by the corresponding re-gression coefficients (see the Methods section of the Supplementary Appendix). Patients were clas-sified as having a high-risk gene signature or a low-risk gene signature, with the 50th percentile (median) of the risk score as the threshold value (median, 4.9; range, 1.3 to 21.9). The median risk score was chosen as the threshold value to reflect the fact that almost half of patients with early-stage NSCLC relapse within 5 years after poten-tially curative surgery2 and also in order to elimi-nate the effect of extreme values in the training cohort by ensuring that there were equal numbers of patients in the high-risk and low-risk groups. The risk scores and the threshold value derived from the training cohort were not reestimated but were applied directly to the testing cohort. Five-Gene Signature
The levels of expression of the 16 genes were confirmed by RT-PCR and indexed by Spearman’s rank-correlation test.26 From these 16 genes, we further identified five genes that were significant-ly associated with survival. The levels of expres-sion of these five genes, as measured by RT-PCR, were used to construct the recursive-partitioning
nomic) was then used to classify patients as hav-ing a high-risk gene signature or a low-risk gene signature on the basis of the decision tree.
Our rationale for using a decision tree based on RT-PCR rather than on microarray analysis was practicality. RT-PCR uses a small number of genes to capture the relevant covariate structure, especially the complex interaction and nonlinear-ity of levels of gene expression.28 In our univari-ate-splitting tree, only one of the five genes was used to make a splitting decision at each inter-mediate node. To avoid overfitting, we used a pruning method called minimum error (see the Methods section and Fig. 1 of the Supplementary Appendix).
The Kaplan–Meier method was used to esti-mate overall survival and relapse-free survival. Differences in survival between the high-risk group and the low-risk group were analyzed with the log-rank test. Multivariate Cox proportional-hazards regression analysis with stepwise se-lection was used to evaluate independent prog-nostic factors associated with survival, and the five-gene signature, age, sex, tumor stage, and histologic characteristics were used as covari-ates. A P value of less than 0.05 was considered to indicate statistical significance, and all tests were two-tailed.
We also studied an independent cohort of 60 patients who underwent surgical resection of NSCLC at the Taichung Veterans General Hospi-tal between November 1999 and December 2003. This cohort was used to validate our five-gene risk-prediction model.
To further validate our model, we applied it to microarray data from 86 patients with NSCLC, re-ported by Beer et al.10 (available at http://dot.ped. med.umich.edu:2000/ourimage/pub/Lung/index. html). The five genes (and their corresponding Affymetrix probe sets) were DUSP6 (X93920_at),
MMD (X85750_at), STAT1 (M97936_at), ERBB3
(S61953_at), and LCK (M26692_s_at); the control gene was TBP (X54993_s_at). To make the levels of gene expression from the microarrays and from RT-PCR comparable, we log-transformed the mi-croarray data to a base-2 scale after assigning a value of 1.1 to intensity values of less than 1.1. After log transformation, the levels of expression of the five genes were divided by the level of ex-pression of the control gene TBP in order to calcu-late the relative level of expression. We applied the decision-tree model to these relative levels of
ex-NSCLC.10 Because the maximum follow-up time for the survival analysis in our study was 62 months, we used the 5-year survival data for the 86 patients.
R e s u l t s
The 16 -Gene Signature and Survival
On microarray analysis of tumors from the 125 patients, 485 of 672 genes had a coefficient of variation greater than 3% and were thus includ-ed in the analyses. Hazard ratios from the
uni-variate Cox regression analysis showed that the levels of expression of 16 genes correlated with death from any cause: 4 were protective genes (associated with a hazard ratio of less than 1) and 12 were risk genes (associated with a hazard ratio of more than 1 (Table 1).
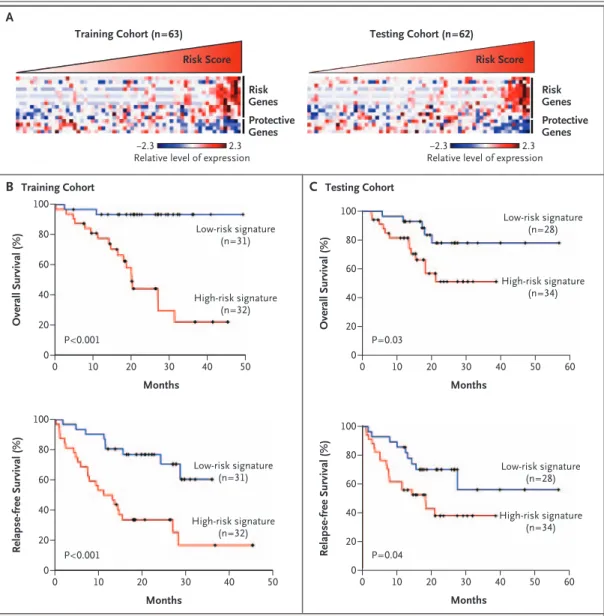
Table 1 of the Supplementary Appendix lists the characteristics of the 125 patients in the first analysis. Among the 63 patients in the training cohort, tumors with high risk scores expressed risk genes, whereas tumors with low risk scores expressed protective genes (Fig. 1A). Patients with
Overall Survival (%) 80 60 20 40 0 0 10 20 30 40 50 Months Low-risk signature (n=31) High-risk signature (n=32) 100 P<0.001 A B Training Cohort Relapse-free Survival (%) 80 60 20 40 0 0 10 20 30 40 50 Months Low-risk signature (n=31) High-risk signature (n=32) 100 P<0.001 C Testing Cohort Relapse-free Survival (%) 80 60 20 40 0 0 10 20 30 40 50 Overall Survival (%) 80 60 20 40 0 0 10 20 30 40 50 Months Low-risk signature (n=28) High-risk signature (n=34) 100 P=0.03 60 60 Months Low-risk signature (n=28) High-risk signature (n=34) 100 P=0.04 −2.3 2.3 Risk Genes Risk Score Training Cohort (n=63) Risk Score Testing Cohort (n=62) Protective Genes −2.3 2.3 Risk Genes Protective Genes
Relative level of expression Relative level of expression
Figure 1. The 16-Gene Signature and Survival of 125 Patients with NSCLC.
Panel A shows the gene-expression profiles of the tumor specimens (according to the color scale shown); each col-umn represents an individual patient. The magnitude of the corresponding risk scores is represented by the slope of the red triangle. Also shown are Kaplan–Meier estimates of overall and relapse-free survival according to the 16-gene microarray signature in the training cohort (Panel B) and the testing cohort (Panel C).
a high-risk 16-gene signature had a lower median overall survival than those with a low-risk 16-gene signature (20 months vs. not reached) (Fig. 1B). Tumors with a high-risk gene signature were as-sociated with a lower median relapse-free survival than tumors with a low-risk gene signature (12 months vs. not reached) (Fig. 1B). The median duration of follow-up in the training cohort was 20 months.
Results in the testing cohort were similar to those in the training cohort. Among the 62 pa-tients, tumors with high risk scores expressed risk genes, whereas tumors with low risk scores ex-pressed protective genes (Fig. 1A). Patients with a high-risk 16-gene signature had a lower me-dian overall survival than those with a low-risk gene signature (Fig. 1C). Tumors with a high-risk gene signature were associated with a lower me-dian relapse-free survival than tumors with a low-risk gene signature (18 months vs. not reached) (Fig. 1C). The median duration of follow-up in the testing cohort was 18 months. Our entire micro-array data set is available online (www.ncbi.nlm. nih.gov/projects/geo/) under the data series acces-sion number GSE4882.
The Five-Gene Signature and Survival
There was a significant correlation between the results of microarray and RT-PCR analyses for the gene-expression data for 5 of the 16 genes in 101 of the 125 tumor specimens (Table 1). These five genes were for dual-specificity phosphatase 6 (DUSP6), monocyte-to-macrophage differentiation-associated protein (MMD), signal transducer and activator of transcription 1 (STAT1), v-erb-b2 avian erythroblastic leukemia viral oncogene homo-log 3 (ERBB3), and lymphocyte-specific protein ty-rosine kinase (LCK).
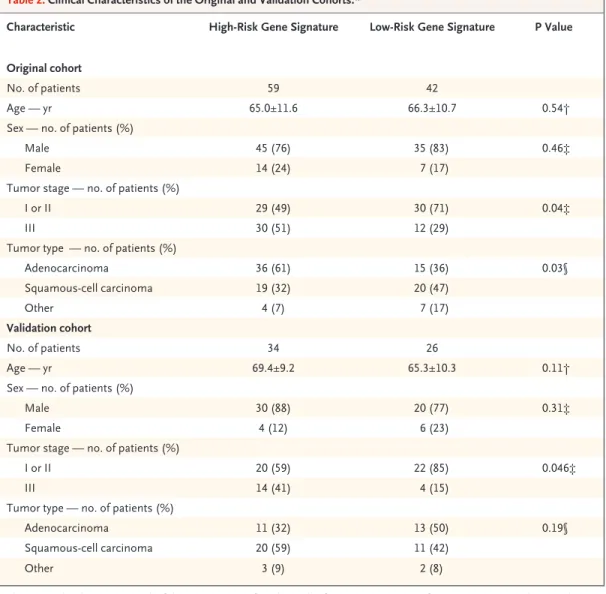
We identified 59 patients with high-risk gene signatures and 42 with low-risk gene signatures, according to gene expression as measured with RT-PCR and decision-tree analysis (see Fig. 1 of the Supplementary Appendix). The structure of the decision tree was based on the threshold of expres-sion of each of the five genes, as automatically determined according to a recursive-partition algo-rithm. The use of this algorithm resulted in the most accurate separation of patients with a high-risk signature from those with a low-high-risk signa-ture. Table 2 summarizes the clinical character-istics of the 101 patients, hereafter called the original cohort, according to their five-gene
sig-natures. The five-gene signature was strongly as-sociated with overall survival (sensitivity, 98%; specificity, 93%; positive predictive value, 95%; negative predictive value, 98%; and overall accu-racy, 96%).
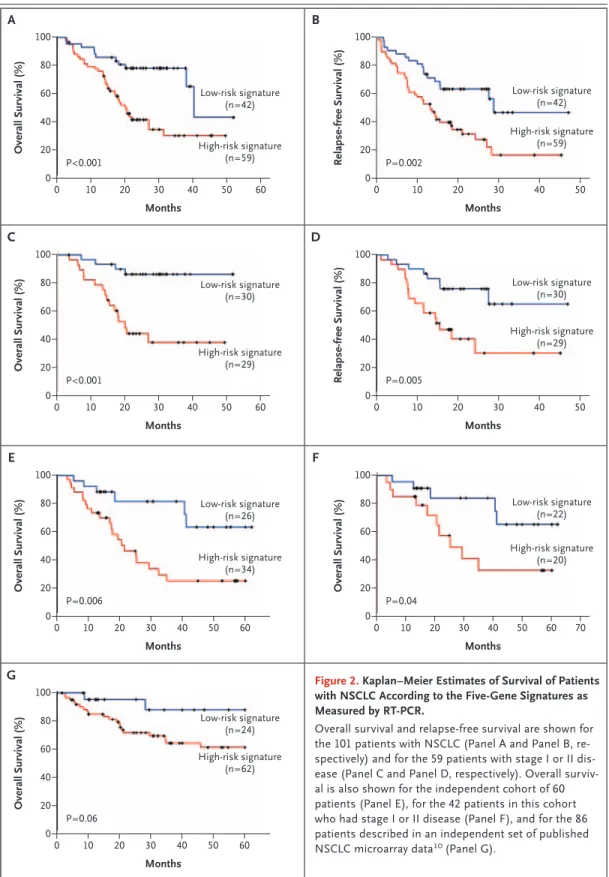
The median follow-up of the 101 patients was 20 months. The patients with a high-risk gene signature had a shorter median overall survival than the patients with a low-risk gene signature (20 months vs. 40 months, P<0.001 by the log-rank test) (Fig. 2A). The high-risk gene signature was associated with a median relapse-free survival of 13 months, whereas the low-risk gene signature was associated with a median relapse-free sur-vival of 29 months (P = 0.002 by the log-rank test) (Fig. 2B).
According to Cox multivariate regression anal-ysis, the high-risk five-gene signature, tumor stage III, and older age were significantly associ-ated with death from any cause among the 101 patients (Table 3), and the high-risk five-gene sig-nature and tumor stage III were significantly as-sociated with recurrence of cancer as well (hazard ratio for the high-risk signature vs. the low-risk signature, 1.92; 95% confidence interval [CI], 1.06 to 3.46; P = 0.03; hazard ratio for stage III vs. stage I or II disease, 2.28; 95% CI, 1.33 to 3.91; P = 0.003). In a subgroup analysis of 59 patients with stage I or II disease, those with a high-risk gene signa-ture had a shorter overall survival and a shorter relapse-free survival than those with a low-risk gene signature (Fig. 2C and 2D, respectively). Validation of the Five-Gene Signature
The clinical characteristics of the 60 patients in the validation cohort are listed in Table 2. The median duration of follow-up was 17 months. Patients with a high-risk gene signature had a shorter median overall survival than those with a low-risk gene sig-nature (21 months vs. not reached) (Fig. 2E). Ac-cording to Cox multivariate regression analysis, the five-gene signature was significantly associated with overall survival (Table 3).
We analyzed the five-gene signatures in tumor specimens obtained from patients in the valida-tion cohort with stage I or stage II disease both together and separately. Among patients with stage I or II disease combined, those with a high-risk gene signature had a shorter overall survival than those with a low-risk gene signature (Fig. 2F). Among patients with stage I disease, low-risk gene signatures were associated with a longer
overall survival than were high-risk gene signa-tures (P = 0.02 by the log-rank test). Among pa-tients with stage II disease, overall survival did not differ significantly between those with high-risk and those with low-risk gene signatures, prob-ably owing to the small number of patients.
We also validated the five-gene signature in an independent set of microarray data from 86 pa-tients from a Western population with NSCLC.10 Table 2 of the Supplementary Appendix lists the clinical characteristics of these 86 patients accord-ing to their five-gene signatures. The patients with high-risk gene signatures had a shorter overall
survival than did those with low-risk gene signa-tures (Fig. 2G) (P =0.06 by the log-rank test). Ac-cording to Cox multivariate regression analysis, the high-risk five-gene signature and tumor stage III were significantly associated with death from any cause (Table 3).
D i s c u s s i o n
NSCLC is a heterogeneous disease. Even in patients with similar clinical and pathological features, the outcome varies: some are cured, whereas in others, the cancer recurs. Staging systems for lung can-Table 2. Clinical Characteristics of the Original and Validation Cohorts.*
Characteristic High-Risk Gene Signature Low-Risk Gene Signature P Value
Original cohort
No. of patients 59 42
Age — yr 65.0±11.6 66.3±10.7 0.54†
Sex — no. of patients (%)
Male 45 (76) 35 (83) 0.46‡
Female 14 (24) 7 (17)
Tumor stage — no. of patients (%)
I or II 29 (49) 30 (71) 0.04‡
III 30 (51) 12 (29)
Tumor type — no. of patients (%)
Adenocarcinoma 36 (61) 15 (36) 0.03§ Squamous-cell carcinoma 19 (32) 20 (47) Other 4 (7) 7 (17) Validation cohort No. of patients 34 26 Age — yr 69.4±9.2 65.3±10.3 0.11†
Sex — no. of patients (%)
Male 30 (88) 20 (77) 0.31‡
Female 4 (12) 6 (23)
Tumor stage — no. of patients (%)
I or II 20 (59) 22 (85) 0.046‡
III 14 (41) 4 (15)
Tumor type — no. of patients (%)
Adenocarcinoma 11 (32) 13 (50) 0.19§
Squamous-cell carcinoma 20 (59) 11 (42)
Other 3 (9) 2 (8)
* The original cohort consisted of the 101 patients for whom the five-gene signatures from microarray analysis and RT-PCR analysis were significantly correlated. Plus–minus values are means ±SD.
† The P value was calculated by the t-test. ‡ The P value was calculated by Fisher’s exact test. § The P value was calculated by the chi-square test.
Overall Survival (%) 80 60 20 40 0 0 10 20 30 40 50 Months Low-risk signature (n=30) High-risk signature (n=29) 100 P<0.001 A C Relapse-free Survival (%) 80 60 20 40 0 0 10 20 30 40 50 Months Low-risk signature (n=30) High-risk signature (n=29) 100 P=0.005 Overall Survival (%) 80 60 20 40 0 0 10 20 30 40 50 Months Low-risk signature (n=26) High-risk signature (n=34) 100 P=0.006 E B D F Overall Survival (%) 80 60 20 40 0 0 10 20 30 40 50 60 60 60 70 60 Months Low-risk signature (n=22) High-risk signature (n=20) 100 P=0.04 Overall Survival (%) 80 60 20 40 0 0 10 20 30 40 50 Months Low-risk signature (n=42) High-risk signature (n=59) 100 P<0.001 Relapse-free Survival (%) 80 60 20 40 0 0 10 20 30 40 50 Months Low-risk signature (n=42) High-risk signature (n=59) 100 P=0.002 Overall Survival (%) 80 60 20 40 0 0 10 20 30 40 50 Months Low-risk signature (n=24) High-risk signature (n=62) 100 P=0.06 G 60
Figure 2. Kaplan–Meier Estimates of Survival of Patients with NSCLC According to the Five-Gene Signatures as Measured by RT-PCR.
Overall survival and relapse-free survival are shown for the 101 patients with NSCLC (Panel A and Panel B, re-spectively) and for the 59 patients with stage I or II dis-ease (Panel C and Panel D, respectively). Overall surviv-al is surviv-also shown for the independent cohort of 60 patients (Panel E), for the 42 patients in this cohort who had stage I or II disease (Panel F), and for the 86 patients described in an independent set of published NSCLC microarray data10
cer that are based on clinical and pathological find-ings may have reached their limit of usefulness for predicting outcomes, but molecular methods add value. Gene-expression profiling with the use of microarrays3,4 or PCR5,6 has been shown to esti-mate the prognosis for patients with lung cancer accurately.10-16 However, the use of microarrays in clinical practice is limited by the large number of genes in the analysis,17 complicated methods, lack of reproducibility and independent validation of the results, and the need for fresh-frozen tissue.17 RT-PCR involving a small number of genes may be a more clinically useful method. It allows for ac-curate and reproducible quantification of results for RNA obtained from small amounts of paraf-fin-embedded specimens.17,31 The results of RT-PCR performed on 8 genes, selected from a total of 45, have recently been shown to correlate with the outcomes of lung adenocarcinoma.5
We identified an RT-PCR–based five-gene sig-nature (including DUSP6, MMD, STAT1, ERBB3, and
LCK) using risk scores based on microarray and
decision-tree analyses of 125 frozen tumor spec-imens from patients with NSCLC. The specspec-imens were randomly divided into a training set (63 specimens) and a testing set (62 specimens). The presence of a high-risk five-gene signature in the NSCLC tumors was associated with an increased risk of recurrence and decreased overall survival.
Our selection of genes in the microarray train-ing set was validated in the microarray testtrain-ing set, and the patterns of gene expression found on mi-croarray analysis were validated by RT-PCR. Our results were also validated in an independent co-hort of 60 patients who were treated at the Tai-chung Veterans General Hospital. These results in our Chinese patients were also validated with the use of a set of published NSCLC microarray data from patients from a Western population with NSCLC. Thus, we believe that the data we obtained using the five-gene signature are reliable.
The identification of five genes that are close-ly associated with the outcomes in patients with NSCLC has clinical implications. Cisplatin-based adjuvant chemotherapy is effective in some pa-tients with NSCLC.32 We propose that patients who have tumors with a high-risk gene signature could benefit from this type of adjuvant therapy, whereas those with a low-risk gene signature could be spared what may be unnecessary treatment.
Prospective, large-scale, multicenter studies are necessary to test this idea.
The identification of five genes that can pre-dict the clinical outcome in patients with NSCLC may reveal targets for the development of thera-py for lung cancer. STAT1 causes arrested growth and apoptosis in many types of cancer cells by inducing the expression of p21WAF1
and cas-pase.33,34
MMD is preferentially expressed in ma-ture macrophages.35
Our group has shown that macrophage activation promotes cancer metas-tasis,22
although the function of the MMD pro-tein is unknown. DUSP6 inactivates extracellu-lar signal-regulated kinase 2 (ERK2) (also known as mitogen-activated protein kinase 1 [MAPK1]), resulting in tumor suppression and apoptosis.36 ERBB3, a member of the epidermal growth fac-tor recepfac-tor family of tyrosine kinases, can short-en cell survival.37
LCK, a member of the Src fam-ily of protein tyrosine kinases, is expressed mainly in T cells and is one of the first signaling mol-ecules downstream of the T-cell receptor. It plays a key role not only in the differentiation and activation of T cells but also in the induction of apoptosis.38
In addition, LCK is expressed in many cancers and regulates the mobility of cancer cells.39,40
In conclusion, the five-gene expression signa-ture we identified is closely associated with the
Table 3. Hazard Ratios for Death from Any Cause Among Patients with NSCLC, According to Multivariate Cox Regression Analysis.*
Variable Hazard Ratio (95% CI) P Value
Original cohort
High-risk five-gene signature 2.82 (1.38–5.78) 0.005
Tumor stage III 2.13 (1.16–3.93) 0.02
Older age 1.06 (1.03–1.09) <0.001
Validation cohort
High-risk five-gene signature 3.36 (1.35–8.35) 0.009 Validation microarray data set
High-risk five-gene signature 4.36 (1.01–18.76) 0.048 Tumor stage III 7.50 (3.18–17.66) <0.001 * Variables were selected with a stepwise selection method. The equation used
to identify the high-risk five-gene signature is given in the Supplementary Appendix. There were 101 patients in the original cohort (those for whom the five-gene signatures from microarray analysis and RT-PCR analysis were sig-nificantly correlated), 60 in the validation cohort, and 86 in the validation data set. CI denotes confidence interval.
clinical outcome in patients with surgically re-sected NSCLC. This signature could be useful in stratifying patients according to risk in trials of adjuvant treatment of the disease.
Supported by grants from the National Research Program for Genomic Medicine of the National Science Council of the Re-public of China (NSC94-3112-B002-013-Y) and from Advpharma. Dr. Terng reports being an employee of Advpharma. No other potential conflict of interest relevant to this article was reported.
Refe renc e s
Jemal A, Siegel R, Ward E, et al. Cancer statistics, 2006. CA Cancer J Clin 2006; 56:106-30.
Hoffman PC, Mauer AM, Vokes EE. Lung cancer. Lancet 2000;355:479-85. [Er-ratum, Lancet 2000;355:1280.]
Hoheisel JD. Microarray technology: beyond transcript profiling and genotype analysis. Nat Rev Genet 2006;7:200-10.
Schena M, Shalon D, Davis RW, Brown PO. Quantitative monitoring of gene ex-pression patterns with a complementary DNA microarray. Science 1995;270:467-70.
Endoh H, Tomida S, Yatabe Y, et al. Prognostic model of pulmonary adenocar-cinoma by expression profiling of eight genes as determined by quantitative real-time reverse transcriptase polymerase chain reaction. J Clin Oncol 2004;22:811-9.
Lossos IS, Czerwinski DK, Alizadeh AA, et al. Prediction of survival in diffuse large-B-cell lymphoma based on the ex-pression of six genes. N Engl J Med 2004; 350:1828-37.
Ramaswamy S, Ross KN, Lander ES, Golub TR. A molecular signature of me-tastasis in primary solid tumors. Nat Gen-et 2003;33:49-54.
Golub TR, Slonim DK, Tamayo P, et al. Molecular classification of cancer: class discovery and class prediction by gene ex-pression monitoring. Science 1999;286: 531-7.
Ludwig JA, Weinstein JN. Biomarkers in cancer staging, prognosis and treat-ment selection. Nat Rev Cancer 2005;5: 845-56.
Beer DG, Kardia SL, Huang CC, et al. Gene-expression profiles predict survival of patients with lung adenocarcinoma. Nat Med 2002;8:816-24.
Bhattacharjee A, Richards WG, Staunton J, et al. Classification of human lung carcinomas by mRNA expression profiling reveals distinct adenocarcinoma subclasses. Proc Natl Acad Sci U S A 2001; 98:13790-5.
Garber ME, Troyanskaya OG, Schlu-ens K, et al. Diversity of gene expression in adenocarcinoma of the lung. Proc Natl Acad Sci U S A 2001;98:13784-9. [Erratum, Proc Natl Acad Sci U S A 2002;99:1098.]
Wigle DA, Jurisica I, Radulovich N, et al. Molecular profiling of non-small cell lung cancer and correlation with disease-free survival. Cancer Res 2002;62:3005-8.
Gordon GJ, Jensen RV, Hsiao LL, et al. Translation of microarray data into clini-cally relevant cancer diagnostic tests us-ing gene expression ratios in lung cancer
1. 2. 3. 4. 5. 6. 7. 8. 9. 10. 11. 12. 13. 14.
and mesothelioma. Cancer Res 2002;62: 4963-7.
Granville CA, Dennis PA. An overview of lung cancer genomics and proteomics. Am J Respir Cell Mol Biol 2005;32:169-76.
Tsao MS, Sakurada A, Cutz JC, et al. Erlotinib in lung cancer — molecular and clinical predictors of outcome. N Engl J Med 2005;353:133-44.
Ramaswamy S. Translating cancer ge-nomics into clinical oncology. N Engl J Med 2004;350:1814-6.
Chen JJ, Peck K, Hong TM, et al. Glob-al anGlob-alysis of gene expression in invasion by a lung cancer model. Cancer Res 2001; 61:5223-30.
Shih JY, Yang SC, Hong TM, et al. Collapsin response mediator protein-1 and the invasion and metastasis of cancer cells. J Natl Cancer Inst 2001;93:1392-400.
Wang CC, Tsai MF, Hong TM, et al. The transcriptional factor YY1 upregu-lates the novel invasion suppressor HLJ1 expression and inhibits cancer cell inva-sion. Oncogene 2005;24:4081-93.
Chen JJ, Wu R, Yang PC, et al. Profil-ing expression patterns and isolatProfil-ing dif-ferentially expressed genes by cDNA micro-array system with colorimetry detection. Genomics 1998;51:313-24.
Chen JJ, Lin YC, Yao PL, et al. Tumor-associated macrophages: the double-edged sword in cancer progression. J Clin Oncol 2005;23:953-64.
Bieche I, Onody P, Laurendeau I, et al. Real-time reverse transcription-PCR assay for future management of ERBB2-based clinical applications. Clin Chem 1999;45: 1148-56.
Bolstad BM, Irizarry RA, Astrand M, Speed TP. A comparison of normalization methods for high density oligonucleotide array data based on variance and bias. Bioinformatics 2003;19:185-93.
Cox DR. Regression models and life-tables. J R Stat Soc [B] 1972;34:187-220.
Rosner R. Fundamentals of biostatis-tics. 5th ed. Pacific Grove, CA: Duxbury, 2000.
Zhang H, Yu CY, Singer B, Xiong M. Recursive partitioning for tumor classifi-cation with gene expression microarray data. Proc Natl Acad Sci U S A 2001;98: 6730-5.
Koziol JA, Zhang JY, Casiano CA, et al. Recursive partitioning as an approach to selection of immune markers for tumor diagnosis. Clin Cancer Res 2003;9:5120-6.
Shafer JC, Agrawal R, Mehta M. SPRINT: a scalable parallel classifier for
15. 16. 17. 18. 19. 20. 21. 22. 23. 24. 25. 26. 27. 28. 29.
data mining. In: Proceedings of the 22nd International Conference on Very Large Databases, Bombay, India, September 3–6, 1996.
Avadis user manual. Bangalore, India: Strand Genomic Pvt. Ltd., 2004.
Bast RC Jr, Hortobagyi GN. Individu-alized care for patients with cancer — a work in progress. N Engl J Med 2004; 351:2865-7.
Arriagada R, Bergman B, Dunant A, et al. Cisplatin-based adjuvant chemother-apy in patients with completely resected non–small-cell lung cancer. N Engl J Med 2004;350:351-60.
Yu H, Jove R. The STATs of cancer — new molecular targets come of age. Nat Rev Cancer 2004;4:97-105.
Kumar A, Commane M, Flickinger TW, Horvath CM, Stark GR. Defective TNF-alpha-induced apoptosis in STAT1-null cells due to low constitutive levels of caspases. Science 1997;278:1630-2.
Rehli M, Krause SW, Schwarzfischer L, Kreutz M, Andreesen R. Molecular cloning of a novel macrophage matura-tion-associated transcript encoding a pro-tein with several potential transmembrane domains. Biochem Biophys Res Commun 1995;217:661-7.
Furukawa T, Sunamura M, Motoi F, Matsuno S, Horii A. Potential tumor sup-pressive pathway involving DUSP6/MKP-3 in pancreatic cancer. Am J Pathol 2003; 162:1807-15.
Muller-Tidow C, Diederichs S, Bulk E, et al. Identification of metastasis-associ-ated receptor tyrosine kinases in non-small cell lung cancer. Cancer Res 2005; 65:1778-82.
Zamoyska R, Basson A, Filby A, Leg-name G, Lovatt M, Seddon B. The influ-ence of the src-family kinases, Lck and Fyn, on T cell differentiation, survival and activation. Immunol Rev 2003;191:107-18.
Mahabeleshwar GH, Das R, Kundu GC. Tyrosine kinase, p56lck-induced cell motility, and urokinase-type plasmino-gen activator secretion involve activation of epidermal growth factor receptor/ex-tracellular signal regulated kinase path-ways. J Biol Chem 2004;279:9733-42.
Mahabeleshwar GH, Kundu GC. Tyro-sine kinase p56lck regulates cell motility and nuclear factor kappaB-mediated se-cretion of urokinase type plasminogen activator through tyrosine phosphoryla-tion of IkappaBalpha following hypoxia/ reoxygenation. J Biol Chem 2003;278: 52598-612.
Copyright © 2007 Massachusetts Medical Society.
30. 31. 32. 33. 34. 35. 36. 37. 38. 39. 40.