www.elsevier.com / locate / chromb
A
nalysis of secretory immunoglobulin A in human saliva by
laser-induced fluorescence capillary electrophoresis
a ,
*
a a aCheng-Ming Liu
, Kuo-Hua Tung , Tsui-Hua Chang , Chen-Chin Chien ,
b
Mao-Hsiung Yen
a
Institute of Biomedical Technology, Taipei Medical University, 250 Wu-Shin Street, Taipei, Taiwan b
Department of Pharmacology, National Defense Medical Center, 161, Section 6, Min-Chuang East Road, Taipei, Taiwan Received 14 October 2002; received in revised form 28 February 2003; accepted 13 March 2003
Abstract
The utility of capillary electrophoresis (CE) has been demonstrated for the analysis of secretory immunoglobulin A (sIgA) in human saliva. The amount of sIgA in saliva correlates with immune status. For detecting salivary sIgA, laser-induced fluorescence was conducted in this report for signal amplification. sIgA and anti-sIgA antibody were labeled with cyanine fluorescence (Cy5) for competitive immunoassay and non-competitive analysis, respectively. Cy5 was excited by He–Ne laser with a wavelength of 635 nm, with maximum emission at 670 nm. Migration time during electrophoresis depended on whether sIgA–Cy5 was mixed with antibody or anti-sIgA–Cy5 mixed with sIgA to form Ag–Ab complex. The results indicated that CE competitive immunoassay was effective for analyzing serum sIgA, but not for salivary sIgA. However, salivary sIgA can be analyzed by complex formation assay. The peak area of the complex was proportional to the amount of sIgA added. A standard linear regression curve was generated using purified sIgA. From this standard curve, the amount of sIgA from saliva of either normal or immunocompromised patients can be calculated from the Ag–Ab complex peak area. 2003 Elsevier Science B.V. All rights reserved.
Keywords: Immunoglobulin A
1
. Introduction external mucosal secretions such as oral, respiratory,
and intestinal cavities, and is often characterized as a Saliva is secreted from three pairs of glands in the component of the immune system ‘‘first-line de-buccal cavity. The parotid gland is the major source fense’’ against pathogenic microorganisms, viruses, of saliva, secreting more than 70% of total saliva. and bacteria[1].The sIgA molecule is a dimeric IgA The composition of saliva includes proteins, carbo- which contains two units of IgA. The two units of hydrates, hormones and antibodies, especially secret- IgA are conjugated by a J chain to form sIgA, which ory immunoglobulin A (sIgA). Secretory immuno- then migrates to the surface of oral and respiratory globulin A is the dominant immunoglobulin in mucosa. The dimeric structure confers a higher resistance to the enzymes which are abundant in the mucus. The amount of sIgA secreted is related with *Corresponding author. Tel.: 1886-2-2736-1661x3321x104;
age. At birth, levels of sIgA are undetectable, but
fax: 1886-2-2732-4510.
E-mail address: cheng-m@tmu.edu.tw(C.-M. Liu). there is a consistent increase until age 7. Levels
1570-0232 / 03 / $ – see front matter 2003 Elsevier Science B.V. All rights reserved. doi:10.1016 / S1570-0232(03)00249-6
remain constant through adolescence to mid-life, and purified secondary antibody were purchased from then decline during old age. No gender differences in Chemicon (Temecula, CA, USA). Cy5 bisfunctional sIgA levels have been reported. Several investigators dye PA25000 and Sephadex PD-10 columns (G-25) have reported that levels of sIgA are not directly were purchased from Amersham Pharmacia (Piscata-reflected to serum levels of sIgA [2–5]. Low levels way, NJ, USA).
of sIgA are considered a risk factor for upper
respiratory infections in children and the elderly 2 .2. Apparatus [2–4]. In addition, lower levels of sIgA have been
reported to increase risk for periodontal disease and LIF detection was performed on a P/ACE system caries [6,7]. Other investigators have found that Model 2100 equipped with a He–Ne laser detector lower levels of sIgA may link academic stress and (Beckman Instruments, Fullerton, CA, USA) con-emotional stress [8,9]. The current methods used to trolled by System Gold software (San Ramon, CA, assess the amount of sIgA in saliva are either USA). Laser was generated from a 635 Laser Mod-radioimmunodiffusion or enzyme-linked immuno- ule (Beckman Instruments) and connected with sorbent assay (ELISA). These methods are inaccu- capillary cartridge by fiberoptic cable. When fluores-rate and the processes are cumbersome. In this cent (Cy5) passed the detection window, it can be report, the capillary electrophoresis (CE) equipped excited to induce emission. The emission light was with laser-induced fluorescence (LIF) was used to collected and through a long-pass filter (.675 nm). assess the amount of sIgA in saliva. Advantages of Capillary columns were purchased from Polymicro CE with respect to other analytical techniques, Technologies (Phoenix, AZ, USA). The dimensions including minimal required sample volume, rapid of capillary were 27 cm350 mm I.D. without analysis, higher resolution, and low cost, have made coating. The field strength for electrophoresis was this technique ideal for analysis of a number of 555 V/ cm. The sample was injected by positive endogenous and exogenous substances present in pressure (0.5 p.s.i. for 10 s; 1 p.s.i.56894.76 Pa). biological fluids. The different modes of CE have
been coupled to different detection techniques, such 2 .3. Buffer solution as UV absorbance, electrochemical, mass
spec-trometry and LIF in order to detect different natural Boric acid based buffer (isoelectric point, pI5 and molecular size-separated analytes. In this report, 9.24) was used for LIF analysis. The buffer was analyses were performed by preparing purified prepared by adding 4.63 g of boric acid dissolved in human sIgA or anti-human sIgA labeled with a 450 ml of degassed deionized distilled water. After bisfunctional dye, for competitive immunoassay or completely dissolving, 0.5 g of CHAPS was added complex formation assay respectively. The quantita- and the pH brought to 8.5 by adding NaOH (0.2 M ). tive analyses were applied to either healthy control The final solution was then adjusted to a total or patients suffering from recent influenza or in the volume of 500 ml, containing 150 mM boric acid,
recovery period. 1% CHAPS, pH 8.5. The solution was used as the
running buffer after passing through a 0.45-mm filter membrane. 2 . Experimental 2 .4. Sample pretreatment 2 .1. Materials
Each saliva sample was placed on ice immediately Boric acid, acetic acid, sodium hydroxide, CHAPS after collection in the morning from a donor who (3-[3-cholamidopropyl dimethylammoniol]-1-prop- was fasting overnight. The sample from each donor anesulfonate), goat anti-human IgA, phosphoric acid, was divided into two groups. One group was imme-sodium carbonate and imme-sodium hydrogencarbonate diately acidified to pH 4.5 with 2 M acetic acid, then were purchased form Sigma (St. Louis, MO, USA). boiled for 2.5 min to halt proteolytic degradation. Purified human secretory IgA was purchased from The sample was then left on ice for 20 min, ICN (Irvine, CA, USA) and Cy5 conjugated affinity centrifuged for 30 min at 13 000 rpm in a Kubota
5200 rotor (Tokyo, Japan). The supernatant fraction ate solution (0.1 M, pH 9.3). By adding 0.5 mg of was subjected to CE analysis. The other group was Cy5 and completely mixing, the mixture was incu-analyzed directly after centrifugation (30 min at bated at room temperature for 60 min. For removing
13 000 rpm). the unbound Cy5, the mixture was then passed
through a Sephadex PD-10 column chased by 0.15 M 2
.5. Running conditions phosphate-buffered saline (PBS). The conjugate was
collected and identified by CE. This Cy5 labeled The newly installed capillary was rinsed with 0.2 sIgA was used for CE immunocompetitive analysis.
M NaOH for 20 min and followed by rinsing with The same processes were used for anti-IgA antibody distilled–deionized water (2D H O) for 30 min, and2 labeling. The labeled antibody was ready for the then was equilibrated by running buffer for another non-competitive analysis.
60 min. Sample was injected by positive pressure injection (0.5 p.s.i.) for 10 s. The electrophoretic
field strength was fixed at 555 V/ cm and the current 3 . Results and discussion was 10 mA. Between each run, the capillary was
regenerated with 0.2 M NaOH, 2D H O and running2 3 .1. Optimization of the running buffer pH for
buffer for 10 min each. antigen –antibody formation
2
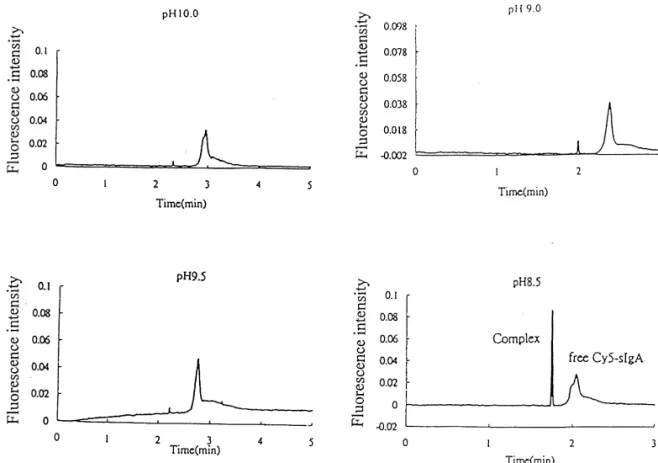
.6. Fluorescence labeling To verify the optimal running buffer, the conju-gated sIgA–Cy5 was mixed with antibody and A total of 5 mg of purified sIgA was dissolved in incubated for 30 min. The mixture was subjected for 1 ml of sodium carbonate, sodium hydrogencarbon- the capillary electrophoresis. The pH of running
Fig. 1. The pH boric acid based buffer (150 mM boric acid with 1% CHAPS) was adjusted to 10.0, 9.5, 9.0 and 8.5 for the Ag–Ab complex formation. The results showed that the optimal pH for complex formed is 8.5 (bottom right).
buffer was adjusted from the pH 8.5 up to pH 10.0 However, the aggregation did not form particles by 1 M NaOH. The results, shown inFig. 1,indicate large enough to block the capillary and the migration that maximal Ag–Ab formation occurred at running time. The relative standard deviation (RSD) of buffer pH 8.5. For improving the resolution, several migration time of the complex is 0.68% which is zwitterions were tested. We found that 1% of fairly consistent.
CHAPS with 150 mM boric acid at pH 8.5 provided
the best resolution for separating sIgA–Cy5 and 3 .2. On-column immunocompetitive analysis for Ag–Ab complex. Under the experimental conditions, sIgA
we noted that the higher pH, the lower the
inter-action between antigen and antibody. The sharp peak In this experiment, a set amount of anti-sIgA was showed in the electropherogram seemed to indicate added into the solution containing Cy5 conjugated that the Ag–Ab may have a tendency to aggregate. sIgA (Cy5–sIgA). The results showed that when
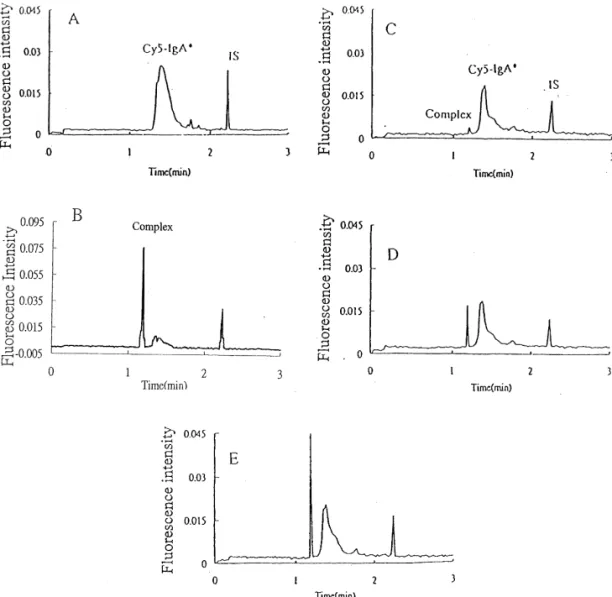
Fig. 2. Immunocompetitive assay: (A) Cy5–sIgA (20 mg / 20 ml) alone, (B) (A) mixed with 10 mg / 10 ml anti-sIgA, (C) (B) mixed with 3.15
mg / 20 ml sIgA, (D) (B) mixed with 2.22 mg / 20 ml sIgA, (E) (B) mixed with 1.18 mg / 20 ml sIgA. The peak area of Ag–Ab complex is
23
inverted proportional to the amount of sIgA added. I.S. represented the internal standard which is free Cy5 (10 mg / ml) mixed with
10 ml of anti-sIgA (1 mg / ml) was added to 20 ml Cy5–sIgA, it induced the maximal amount of complex. A sharp and high complex peak with a minimal broad Cy5–sIgA peak are shown in the electropherogram (Fig. 2B). The mixture was used for generating the standard curve for the quantitative immunocompetitive assay by adding various amounts of purified anti-sIgA into it. To standardize
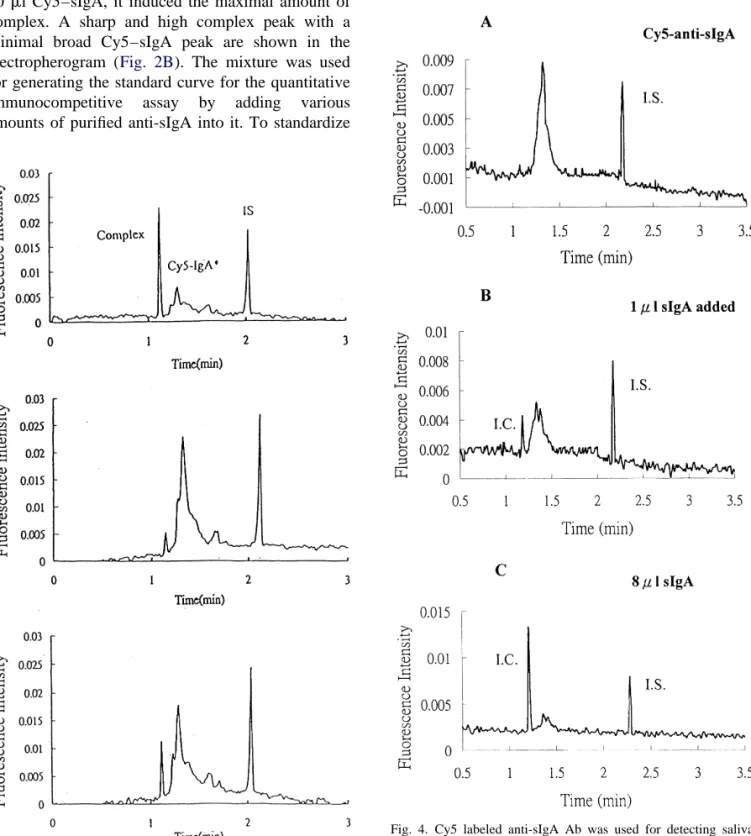
Fig. 4. Cy5 labeled anti-sIgA Ab was used for detecting saliva sIgA. When sIgA was added with Cy5 labeled Ab, a narrowed Fig. 3. Analysis of serum IgA by immunocompetitive assay. The sharp peak complex appeared (migration time around 1.2 min) in upper panel is the assay mixture which contains 20 ml Cy5–sIgA ahead of Cy5–anti-sIgA peak and the peak area is proportional to and 25 ml anti-sIgA Ab. Middle panel is 53 diluted serum was the amount of diluted sIgA was added. (A) Cy5–anti-sIgA alone added in the assay mixture. Bottom panel is 103 diluted serum with 40 ml of PBS, (B) Cy5–anti-sIgA with 1 ml sIgA in 39 ml of was added in the assay mixture. PBS, (C) Cy5–anti-sIgA with 8 ml sIgA in 32 ml of PBS.
the peak height and area, a fixed amount of free Cy5 3
(1 ml of 10 diluted Cy5) was added. Fig. 2C–E, shows that the complex peaks are inversely related with the amount of purified sIgA added into the mixture (C: 3.15 mg / 20 ml, D: 2.22 mg / 20 ml, E: 1.18 mg / 20 ml). The linear regression curve showed
2
that the R 50.9789, slope520.0105 and intercept5 1.7744. This assay mixture was used for assessing salivary sIgA, however, the amount of sIgA seemed insufficient to form complexes, even as excess amounts of saliva were added. The same method was used for assessing serum sIgA. We found that the amount of sIgA in serum was enough to form complexes even in 103 diluted with PBS (Fig. 3). The antibody used in this experiment is anti-a chain. Anti-a chain not only binds with sIgA but also with IgA monomers. The concentration of serum IgA ranged from 0.1 to 1 mg / ml. In saliva however, it was only about 100-fold less than in serum. There-fore, the failure to detect salivary sIgA may be due to lack of sensitivity with this method. An alternative way to do the immunoassay in capillary electro-phoresis is to label anti-sIgA antibody (Cy5–anti-sIgA) and then adding saliva containing sIgA. When sIgA is bound with Cy5–anti-sIgA, it migrates at a different speed, and the peak can be distinguished from the electropherogram. Fig. 4 shows that the Cy5–anti-sIgA alone mixed with 40 ml PBS (A), Cy5–anti-sIgA mixed with 1 ml (1 mg / ml) purified sIgA in 39 ml PBS, (B) to make the total volume of 60 ml and gradually increased the amount of sIgA from 2 to 4 and 8 ml (only 1 and 8 ml are shown in the figure), all samples were spiked with 4 ml of free Cy5 (1:2000 dilution) as an internal standard. The results showed that the complex formation is propor-tional to the amount of sIgA was added. The labeling procedures were followed identically as labeling to sIgA. However, the efficiency of labeling seemed inferior to the prior trial. The fluorescence intensity of the conjugate was less than 0.01 unit (arbitrary units) which cause a fluctuated baseline because of the small amount of conjugate. However, the small
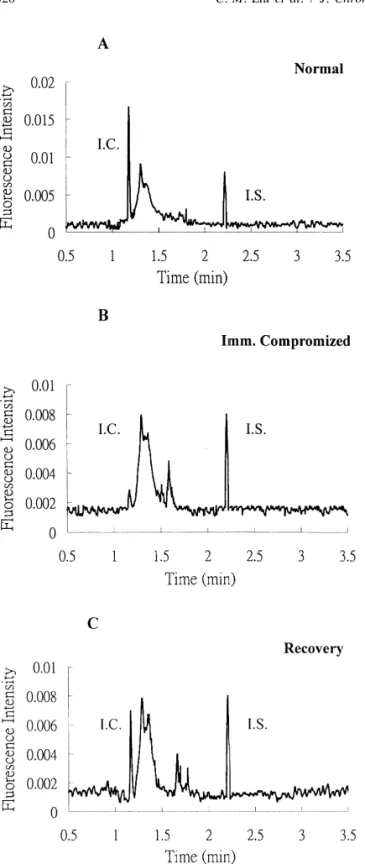
Fig. 5. Analysis of salivary sIgA by Ag–Ab formation assay. amount of conjugate may improve the sensitivity of
Three saliva samples, which include (A) normal healthy person, the assay. For generating the standard curve, the (B) immunocompromised patient (viral infected), and (C) person concentration of added sIgA ranged from 1 to 8 recovered from viral infection. The peak area of I.C. appeared an
mg / ml, which is the range of normal sIgA content in
attenuated at the electropherogram from the immunocompromised
saliva. The peak area of complex and the internal
patient saliva sample compared with either normal or recovered
T able 1
Three saliva samples from different immunity status were assessed by complex formation assay
a b a /b5y x (Concentration)
Normal stage 0.3788 0.26845 1.411063513 9.059654157
Immnocompromized patient 0.03066 0.27003 0.11354294 20.195128818
Recovery stage 0.38298 0.26914 1.422976889 9.144628312
The ratio of I.C. peak and I.S. peak and the concentration of salivary sIgA were calculated from linear regression curve ( y50.1402x1 0.1409).
ratio was calculated. The linear regression between labeled antibody to detect saliva sIgA resulted in sIgA concentration vs. peak area ratio of complex / excellent sensitivity, and may provide the oppor-Cy5 was calculated as the correlation coefficient tunity for clinical use.
2
R 50.9953, slope50.1402 and intercept520.1409.
From this equation, the amount of sIgA in saliva was
assessed from a healthy individual, a person in early A cknowledgements stage of the common cold, and a person who has
recovered from a cold. The analysis was performed C.M.L. thanks the NSC for financial support by the same protocol as to generate the calibration through grant 90-2320-B-038-041.
cureve, 40 ml of saliva was mixed with 20 ml Cy5 labeled antibody plus 4 ml of free Cy5 as an internal
standard. The electropherograms are shown inFig. 5. R eferences The top panel represents saliva from healthy
in-dividual, the middle panel from a person at an early [1] T .B. Tomasi, New Engl. J. Med. 7 (1972) 500.
[2] H . Ben-Aryeh, M. Fisher, R. Szargel, D. Laufer, Arch. Oral
stage of common cold, and the bottom panel from a
Biol. 35 (1990) 929.
person who just recovered from the common cold.
[3] D .J. Smith, M.A. Taubman, J.L. Ebersole, J. Dent. Res. 66
The concentration of sIgA were calculated from the (1987) 451.
linear regression equation. The results are shown in [4] M .T. Ventura, Allergol. Immunopathol. (Madr.) 19 (1991) Table 1.The saliva sIgA in the healthy individual is 183.
[5] J . Kugler, M. Hess, D. Haake, J. Clin. Immunol. 12 (1992)
9.06 mg / ml, the immunocompromised patient is
45.
20.195 mg / ml, the reason is due to the high
[6] R .I. Gregory, D.E. Kim, J.C. Kindle, L.C. Hobbs, D.R.
interception value from the linear regression equation Lloyd, J. Periodontal. Res. 27 (1992) 176.
and the person who recovered from the common cold [7] M .S. Ruan, Chung-Hua-Kou-Chiang-Hsueh-Tsa-Chin 25
was 9.15 mg / ml. Nevertheless, the complex peak (1990) 158.
[8] J .B. Jemmott 3rd, K. Magiloire, J. Pers. Soc. Psychol. 55
still appeared in the electropherogram of the sample
(1988) 803.
which sIgA concentration may lower than 1 mg / ml.
[9] J . Kugler, Psychother. Psychosomat. Med. Psychol. 41
These results indicate that saliva sIgA significantly (1991) 232.
changes depending on differing status in immunity, [10] D . Schmalzing, W. Nashabeh, X.W. Yao, R. Mhatre, F.E.
and also indicate that this method is sensitive for Regnier, N.B. Afeyan, M. Fuchs, Anal. Chem. 67 (1995) 606.
detecting these changes. Possible clinical
applica-[11] F .T. Chen, S.L. Pentoney Jr., J. Chromatogr. A 680 (1994)
tions of this assay include prevention of respiratory
425.
tract infections or shortening duration of illness by [12] L . Tao, R.T. Kennedy, Anal. Chem. 68 (1996) 3899. assessing current immunity status. [13] Y .C. Wang, P. Su hang, X.X. Zhang, W.B. Chang, Anal.
Capillary based on-column immunocompetitive Chem. 73 (2001) 5616.
[14] A .L. Feed, J.D. Cooper, M.I. Davies, S.M. Lunte, J.
Neuro-assay has been applied to many trace analytes, such
sci. Methods. 109 (2001) 23.
as hormones [13], digoxin [10–12],
neurotransmit-[15] E . Ban, H.S. Nam, Y.S. Yoo, J. Chromatogr. A 924 (2001)
ters [14] and recombinant proteins [15]. In this 337. report, we found that using a small amount of Cy5