國 立 交 通 大 學
電子工程學系 電子研究所碩士班
碩
士
論
文
偏好膚色修正技術之研究
A Study of
Preferred Skin Color Reproduction
研 究 生:洪啟軒
指導教授:王聖智 博士
偏好膚色修正技術之研究
A Study of Preferred Skin Color Reproduction
研 究 生:洪啟軒 Student:Chi-Hsuan Hung
指導教授:王聖智博士 Advisor:Dr. Sheng-Jyh Wang
國 立 交 通 大 學
電子工程學系 電子研究所碩士班
碩 士 論 文
A Thesis
Submitted to Department of Electronics Engineering & Institute of Electronics College of Electrical and Computer Engineering
National Chiao Tung University in partial Fulfillment of the Requirements
for the Degree of Master in
Electronics Engineering June 2007
Hsinchu, Taiwan, Republic of China
偏好膚色修正技術之研究
研究生:洪啟軒 指導教授:王聖智 博士
國立交通大學
電子工程學系 電子研究所碩士班
摘要
在本文中,我們提出一套偏好膚色修正系統,能夠針對使用者的
需要,對膚色做出適當調整。它利用了類神經網路來實現膚色偵測,
不但準確而且快速。並且根據我們所設計的偏好膚色實驗,能夠定義
出使用者對於不同光源狀況下所偏好的膚色。另一方面,我們也提出
了一套利用模糊歸屬函數來根據影像亮度對膚色做分類的方法,應用
在偏好膚色修正系統中。根據實驗結果,我們可以發現此系統對於不
同人種的膚色偵測效果都很準確,而且在膚色調整的時候也不會產生
瑕疵。
A Study of Preferred Skin Color Reproduction
Student: Chi-Hsuan Hung Advisor: Dr. Sheng-Jyh Wang
Department of Electronics Engineering, Institute of Electronics
National Chiao Tung University
Abstract
In this thesis, we propose a system of preferred skin color
reproduction, which can adjust the skin color based on users’ preference.
There are three main function blocks in this system: skin color detection,
preferred skin color definition, and skin color correction. First, we adopt
neural network to detect skin color in an efficient way. A fuzzy logic
method is proposed to classify the detected skin color. Second, users’
preferred skin color on different lightness is defined through a deliberate
experiment. Based on the conclusion of the experiment, the proposed
system can properly modify the detected skin color to achieve users’
preference without producing boundary artifacts.
誌謝
這兩年的研究所生活,讓我學習到了很多,在此要特別感謝我的指導
教授 王聖智老師,除了在學術上悉心教導外,同時也是我們學習待
人處事的典範。感謝實驗室的全體夥伴以及幫我做實驗的各位好朋友
們,因為你們在生活和課業上的協助,這篇論文才得以完成。最後要
感謝我親愛的家人,由於你們的支持,我才能夠在研究的路上勇往直
前,奮戰不懈。
Content
Chap 1 Overview...1
1.1 Introduction...1
1.2 Preferred skin color reproduction ...1
Chap 2 Background ...3
2.1 Skin color characteristics ...3
2.2 Skin color detection ...5
2.2.1 Non-parametric methods...5
2.2.1.1 Thresholding ...6
2.2.1.2 Skin probability map...8
2.2.1.3 Histogram Lookup Table ...9
2.2.1.4 Neural network...12
2.2.2 Parametric methods...13
2.2.2.1 Unimodal Gaussian...13
2.2.2.2 Multiple Gaussian (Mixture of Gaussian)...15
2.2.2.3 Elliptical boundary model...16
2.3 Preferred skin color definition ...19
2.4 Color transformation...21
2.4.1 Reinhard’s Color transfer...21
2.4.2 Affine transform...23
2.4.3 Distribution mapping ...25
Chap 3 Proposed methods ...27
3.1 Neural network-based skin color detection...28
3.2 Preferred skin color experiment...29
3.2.1 Experimental settings...29
3.2.2 Experimental methods ...31
3.2.3 Experimental results...33
3.2.4 Summary of Experiment ...40
3.3 Intensity-based skin color classification ...41
3.4 Similarity-based skin color adjustment...44
3.5 System Overview ...45
Chap 4 Experimental Results ...46
Chap 5 Conclusions...51
List of Figures
Figure 1-1 Example of skin color detection...1
Figure 1-2 Results of preferred skin color reproduction...2
Figure 2-1 Distribution of sky blue, grass green and human skin color on (u’, v’) color plane [5] ...3
Figure 2-2 Physical view of skin [1]...3
Figure 2-3 Skin color of different country’s people at varying color temperatures [1] .4 Figure 2-4 Skin labeled image ...5
Figure 2-5 Skin and non-skin color distribution at RG, RB and GB color planes [3] ...6
Figure 2-6 Skin color detection results [11]...7
Figure 2-7 Skin color distribution in the RGB color space [3]...8
Figure 2-8 Equiprobability contours representation [4]...9
Figure 2-9 Equiprobability contour model of skin and non-skin color [4]...9
Figure 2-10 Receiver Operating Characteristics (ROC) Curve [4] ...10
Figure 2-11 ROC curve of some existing methods [4] ... 11
Figure 2-12 Skin color detection results [4] ... 11
Figure 2-13 Multilayer neural network [14] ...12
Figure 2-14 Skin color detection results of multilayer neural network [14]...12
Figure 2-15 3D and 2D views of skin color distribution ...13
Figure 2-16 Skin color detection results based on unimodal Gaussian distribution [6] ...14
Figure 2-17 Multiple Gaussian model [6]...15
Figure 2-18 Skin color detection results through Multiple Gaussian model with EM [6]...16
Figure 2-19 Skin color distribution in different color spaces [8]...16
Figure 2-20 ROC curves of unimodal Gaussian model, multiple Gaussian and elliptical model...17
Figure 2-21 Test patterns [9] ...19
Figure 2-22 Cube-selection method [9] ...20
Figure 2-23 Color transfer between images [10] ...21
Figure 2-24 Results of color transfer [10]...22
Figure 2-25 Preferred skin color transformation [2]...23
Figure 2-26 Illustration of artifacts elimination [2] ...23
Figure 2-27 Reproduction results through affine transform and artifacts elimination [2]...24
Figure 2-28 Mapping between two 2D probability distributions [13]...25
Figure 2-30 Results of atmosphere transformation through distribution mapping [13]
...26
Figure 3-1 Flow chart of preferred skin color reproduction ...27
Figure 3-2 Multilayer neural network [15] ...28
Figure 3-3 Preferred skin color experimental settings...29
Figure 3-4 Test patterns...30
Figure 3-5 Graphic User Interface ...31
Figure 3-6 Hand-labeled skin color mask ...31
Figure 3-7 Illustration of the mask passed smoothed via a 5-by-5 averaging kernel ..32
Figure 3-8 Example of a user’s preferred skin color image...32
Figure 3-9 Selected skin color region (red square)...32
Figure 3-10 Preferred skin color distribution of the outdoor Asian female image ...33
Figure 3-11 Preferred skin color distribution of the indoor without flashlight image .34 Figure 3-12 Preferred skin color distribution of the outdoor Caucasian female image ...35
Figure 3-13 Preferred skin color distribution of the indoor with flashlight Caucasian female image...36
Figure 3-14 Preferred skin color distribution of the outdoor Black female image. ...37
Figure 3-15 Preferred skin color distribution of the indoor without flashlight Black female image...38
Figure 3-16 Human skin color distribution [17] ...41
Figure 3-17 Skin color of different human races under different sunlight conditions [18]...41
Figure 3-18 The distribution of different skin color on HS and SV color planes. ...42
Figure 3-19 Fuzzy membership function of skin color classification...43
Figure 3-20 Example of skin color classification ...43
Figure 3-21 Skin color detection results and skin color adjustment artifacts ...44
Figure 3-22 Skin color detection results through fuzzy logic neural network...44
Figure 3-23 Preferred skin color reproduction system ...45
Figure 4-1 Experimental results of Caucasian male ...46
Figure 4-2 Experimental results of Caucasian female ...47
Figure 4-3 Experimental results of multiple Caucasians ...47
Figure 4-4 Experiment results of Asian male ...48
Figure 4-5 Experimental results of Asian female ...48
Figure 4-6 Experimental results of Black female ...49
Figure 4-7 Experimental results of another Black female ...49
Figure 4-8 Experimental results of multiple human race...50
Table 2-1 SA (skin acceptance) and FA (false alarm) percentage under different
constraints [3]...6 Table 2-2 Detection performance of thresholding and SPM [3]...8 Table 1-3 Detection performance of unimodal Gaussian model, multiple Gaussian and
elliptical model...18 Table 3-1 Preferred skin color results of all test patterns...39 Table 3-2 Mean of original skin color and preferred skin color ...40
Chap 1 Overview
1.1 Introduction
Nowadays, images of high quality are highly demanded. We usually prefer colorful and natural images. An important factor that may affect the colorfulness of the perceptual quality is “memory color”. In daily life, three major types of memory colors are human’s skin color, grass’es green color, and sky’s blue color. An image is usually perceived to have better quality when the skin color, grass color, or sky color in the image is well reproduced. In this thesis, we mainly focus on the reproduction of human’s skin color.
On the other hand, images or videos may be displayed on different kinds of display panels, like cathode ray tube (CRT) or liquid crystal display (LCD). Different panels may have very different color characteristics and a color correction step is required to ensure the display panel is well calibrated. The purpose of color calibration is to build the mapping between the source color space and the target color space. Through the mapping relationship between color spaces, we can adjust human’s skin color to users’ preferred skin color and correctly display the corrected colors on the display panels.
1.2 Preferred skin color reproduction
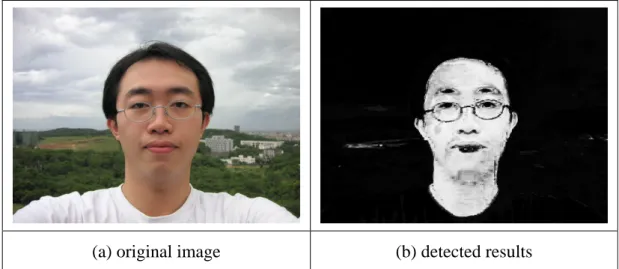
In preferred skin color reproduction, we find the skin color in an image and adjust the color to users’ preferred skin color without much change on the background colors. In Figure 1-1, we show an example of skin color detection.
(a) original image (b) detected results
Then, according to the skin color probability of a pixel, skin-like colors are adjusted to achieve user’s preference and the image quality can be improved, as shown in Figure 1-2. In this thesis, we’ll focus on how to find user’s preferred skin color and how to adjust the detected skin color.
(a) original image (b) corrected image
Chap 2 Background
2.1 Skin color characteristics
Among the colors perceived by human eyes, memory colors, like sky blue, grass green, and human skin, play an important role on image quality. Especially, skin color affects the most. To make skin color more natural, we have to understand the skin color characteristics in the color space. In Figure 2-1, we illustrate the distribution of the memory colors on the (u’, v’) color plane [5].
grass skin sky orange blue green grass skin sky grass skin sky orange blue green
Figure 2-1 Distribution of sky blue, grass green and human skin color on (u’, v’) color plane [5]
Human skin color is mainly affected by two factors, human race and environmental lightness. These two factors will be introduced in following sections.
1. Human race:
Human race can be roughly classified into three major kinds, Caucasian, Mongolian and Black. Due to the distribution of melanin in the epidermis of different man kinds, skin colors are different. On the other hand, the distribution of hemoglobin in the dermis of different man kinds is almost the same. This is why skin color tends to be red, as shown in Figure 2-2[1] .
(melanin)
(hemoglobin) (melanin)
(hemoglobin)
2. Environmental lightness
Almost every object shows different colors at varying color temperatures, so does skin color. Figure 2-3[1] illustrates this phenomenon, in which the x-axis denotes the normalized R and the y-axis denotes normalized G, as defined in Equation 2-1.
B G R G g B G R R r + + = + + = Equation 2-1
Figure 2-3 Skin color of different country’s people at varying color temperatures [1]
As mentioned above, skin color varies for different human races and also at different environmental lightness conditions. Since the detection accuracy will have large influence on the performance of skin color correction, these two factors must be considered if we want to raise the accuracy of skin color detection. Considering the detection accuracy, some existing methods will be discussed in the next section.
2.2 Skin color detection
Here, we classified the existing skin color detection methods into two categories. The first category is called non-parametric methods. This kind of approaches requires large labeled database to establish the skin color distribution in the color space so that the accuracy of skin color detection can be raised. In contrast to the first category, the second category utilizes some specific probability distribution models, like Gaussian distribution. This kind of approaches, as called parametric methods, needs fewer data to build the skin color model. These two kinds of approaches will be discussed respectively in the following sections
2.2.1 Non-parametric methods
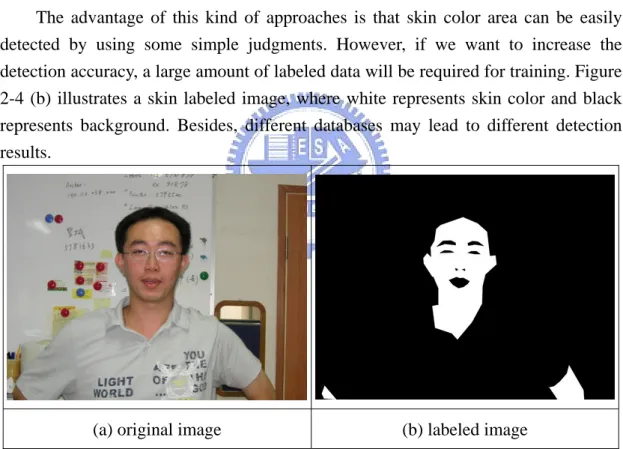
The advantage of this kind of approaches is that skin color area can be easily detected by using some simple judgments. However, if we want to increase the detection accuracy, a large amount of labeled data will be required for training. Figure 2-4 (b) illustrates a skin labeled image, where white represents skin color and black represents background. Besides, different databases may lead to different detection results.
(a) original image (b) labeled image
2.2.1.1 Thresholding
This kind of approaches utilizes a large amount of labeled training data, and constructs a statistical model to detect skin color. However, the detection performance will be different if we use different color spaces for training. We will introduce some existing methods in the following paragraphs.
Jason Brand [3] proposed a method, which adopts a simple threshold to detect skin. Figure 2-5 shows the skin and non-skin distribution on RG, RB and GB planes. It is obvious that the R/G ratio of every skin pixel is larger than 1, so is the R/B ratio or G/B ratio. Therefore, a pixel which is consistent of this characteristic will be classified as skin color.
R/ R/ Gratio Bratio G/Bratio R/ R/ Gratio Bratio G/Bratio Skin Non-skin
Figure 2-5 Skin and non-skin color distribution at RG, RB and GB color planes [3]
Jason Brand [3] also compared the detection accuracy under different constraints, as show in Table 2-1. We can see that the classifier using R/G ratio has better performance than that using R/B ratio or G/B ratio. Apparently, the detection performance using three conditions is much better than that using only one condition, as demonstrated in the fourth row of Table 2-1.
Table 2-1 SA (skin acceptance) and FA (false alarm) percentage under different constraints [3]
Training Set Test Set
SA FA SA FA R/G 95.4% 36.3% 94.7% 35.6% R/B 95.3% 41.7% 94.7% 41.1% G/B 95.1% 71.5% 95.0% 69.5% R/G + R/B + G/B 95.0% 33.1% 94.7% 32.3% Non-skin Skin Non-skin Skin
The above method adopts the RGB color space for training, but we may consider some other color spaces. For example, Zheng[11] utilizes the GLHS[12] color space to construct the skin color model. Equation2-2 illustrates the skin color characteristics. In this equation s’(c) and l’(c) represents the saturation difference and lightness difference, respectively. The details can be found in [11]
90 12 . 0 ) ( 005 . 0 27 . 0 ) ( ' 15 . 0 25 . 0 ) ( ' 065 . 0 ≥ ≤ ≤ ≤ ≤ − ≤ ≤ R c h c l c s Equation2-2
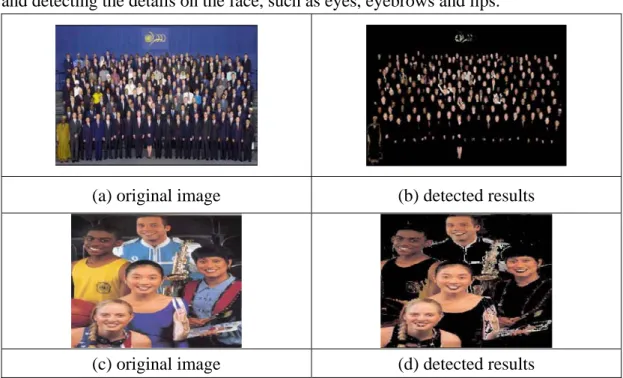
In Figure 2-6, original images are in the left column while the detection results are in the right column. As demonstrated in the results, this method detects skin more accurately than the previous method. Eyes, eyebrows and lips are eliminated from the face area.
(a) original image (b) detected results
(c) original image (d) detected results
(e) original image (f) detected results
2.2.1.2 Skin probability map
Skin probability map (SPM) was proposed by Jason Brand [3] which also utilizes a large amount of data in the RGB color space for training, as shown in Figure 2-7. This approach detects skin color based on Bayesian’s Rule, as expressed in Equation 2-3.
skin
given
occuring,
X
pixel
of
y
probabilit
:
S)
|
P(X
P(S)
P(X)
S)
|
P(X
X)
|
P(S
=
⋅
skin
given
occuring,
X
pixel
of
y
probabilit
:
S)
|
P(X
P(S)
P(X)
S)
|
P(X
X)
|
P(S
=
⋅
Equation 2-3Figure 2-7 Skin color distribution in the RGB color space [3]
Table 2-2 illustrates the detection performance of thresholding and SPM. Considering the skin acceptance (SA), thresholding and SPM have almost the same performance. However, the false alarm of SPM is less than that of thresholding. The reason why SPM has better performance is that it utilizes more information about skin color.
Table 2-2 Detection performance of thresholding and SPM [3]
Training Set Test Set
SA FA SA FA R/G + R/B + G/B 95.0% 33.1% 94.7% 32.3%
2.2.1.3 Histogram Lookup Table
Compared to the above methods, Rehg [4] adopts a statistical model, called histogram lookup table. This model needs a larger amount of data for training, but adopts easier constraints to detect skin color. To reduce the size of histogram, color will be quantized. Both skin color and non-skin color model will be constructed, as shown in Figure 2-8 (a). Through the direction of green-magenta axis, data will be cumulated to produce an equiprobability contour, as illustrated in Figure 2-8.
3-D full color histogram Surface plot of the marginal densitySurface plot of the marginal densitySurface plot of the marginal density
3-D full color histogram Surface plot of the marginal density Equiprobability contoursEquiprobability contours 3-D full color histogram Surface plot of the marginal densitySurface plot of the marginal densitySurface plot of the marginal density
3-D full color histogram Surface plot of the marginal density Equiprobability contoursEquiprobability contours
(c) Equiprobability contours (b) Surface plot of the marginal density
(a) 3-D full color histogram
Figure 2-8 Equiprobability contours representation [4]
Through this statistical model, the equiprobability contour model of skin and non-skin color can be constructed by skin and non-skin color images respectively, as shown in Figure 2-9. Equation 2-4 and Equation 2-5 can also be retrieved. From Figure 2-9, it is obviously that the skin color contour tends to be red, but the non-skin color contour keeps gray.
Skin color model Non-skin color model Skin color model Non-skin color model Skin color model Non-skin color model
Equation 2-5 Equation 2-4
Figure 2-9 Equiprobability contour model of skin and non-skin color [4]
s[rgb]:the counts of a color in skin color model
n[rgb]:the counts of a color in non-skin color model
Ts:the total counts of skin color in skin color model
By dividing Equation 2-4 by Equation 2-5, we can have Equation 2-6. Therefore, as theta is decided, a pixel with the value of Equation 2-6 larger than theta will be classified as a “skin” pixel.
Equation 2-6 θ > ) | ( ) | ( skin rgb p skin rgb p ﹁
For example, when theta equals one, p(rgb|skin) is larger than p(rgb|﹁skin). It means the probability of this color in the skin color model is larger than the probability in the non-skin color model. Therefore, this color will be classified as skin color.
Rehg [4] also mentioned that through the receiver operating characteristics (ROC) curve, as illustrated in Figure 2-10, theta can be decided by the required detection accuracy. In ROC curve, x-axis represents the false alarm rate, which is the rate a non-skin color pixel being correctly classified as non-skin color. On the other hand, the rate which a skin color pixel is correctly classified as skin color is called correction detection rate. It is represented by the y-axis of the ROC curve. Therefore, we can evaluate the performance of detection methods through the ROC curve.
Receiver Operating Characteristic Curve (ROC Curve)
Receiver Operating Characteristic Curve (ROC Curve)
Figure 2-10 Receiver Operating Characteristics (ROC) Curve [4]
Besides, Rehg [4] discussed the quantization number and training data size, which affect the skin detection performance. Comparison of histogram model and Gaussian mixture model is also mentioned. In the following section, Gaussian mixture model will be briefly introduced.
Figure 2-11 shows that the histogram model performs the best when we take quantization number as 32 and use all the training data.
Figure 2-11 ROC curve of some existing methods [4]
Using the best approach mentioned above, Figure 2-12 shows the skin detection results, in which black color represents skin color while white color represents non-skin color. Since this approach only utilizes the color information, some skin color-like areas are falsely detected.
2.2.1.4 Neural network
Although neural network is classified into this category, it only requires some representative training data to achieve desired performance and its performance is almost compatible to histogram lookup table. Therefore, in this thesis, we adopt multilayer neural network for skin color detection in our proposed system.
The approach proposed by Seow [14] is illustrated in Figure 2-13. There are three main layers in neural network: input layer, hidden layer and output layer. Considering the learning algorithm, error back-propagation learning is used. Minimizing the squared error between the output value and the target value, the weights of all neurons are updated sequentially from the output layer back to the input layer. Equation 2-7 and Equation 2-8 demonstrate this learning algorithm.
Equation 2-8
Equation 2-7
Figure 2-13 Multilayer neural network [14]
Figure 2-14 shows two skin color detection results. It can be seen that multilayer neural network has great performance on detecting skin colors from multiple races and detecting the details on the face, such as eyes, eyebrows and lips.
(a) original image (b) detected results
(c) original image (d) detected results
2.2.2 Parametric methods
Compared to the first category, this kind of approaches only requires a small amount of data for training. Based on some predefined probability models, theses methods can be used on skin color detection. However, more computations will be needed to achieve the same detection performance utilizing this kind of non-parametric methods. Besides, since the skin color distribution changes in different color spaces, detection performance may vary in different color spaces if using only a simple probability model.
2.2.2.1 Unimodal Gaussian
Figure 2-15 shows the 3D and 2D views of the skin color distribution in the YCbCr color space. These distributions are similar to a Gaussian distribution. Thus, if the mean and covariance matrix of Gaussian is decided, the model of skin color distribution can be constructed.
3D view of skin color distribution 2D view of skin color distribution 3D view of skin color distribution 2D view of skin color distribution
Cb
Cr
Cr Cb
Figure 2-15 3D and 2D views of skin color distribution
Equation 2-9 [6] expresses the Gaussian distribution function, where the mean vector μ represents the center of skin color distribution and the covariance matrix represents the range of skin color distribution. Hence, the conditional probability demonstrates the probability of a pixel being skin color. The probability increases as the value of (Cb, Cr) approaches the red area, as shown in the right figure of Σ ) | (x S p r Figure 2-15.
{
}
) ( ) ( )] ( [ 2 / )] ( [ exp | | ) 2 ( ) | ( 1 2 2 2 / 1 1 μ μ π r r r r r r r − Σ − = − Σ = − − − x x x d x d S x p t Equation 2-9As illustrated in Figure 2-16 [6] the false alarm rate when using a unimodal Gaussian distribution was still too high.
(a) original image (b) detected results
(c) original image (d) detected results
(e) original image (f) detected results
(g) original image (h) detected results
2.2.2.2 Multiple Gaussian (Mixture of Gaussian)
Since the detection accuracy based on a unimodal Gaussian model was not satisfactory, the multiple Gaussian model with expectation-maximization algorithm has been proposed to enhance the performance. The multiple Gaussian model is an improvement of the unimodal Gaussian model. The combination of two or more Gaussian distributions with different weights may construct the skin color model more accurately, as shown in Figure 2-17[6]
P(X)
Figure 2-17 Multiple Gaussian model [6]
In this example, the linear combination of three Gaussian distributions, as expressed in Equation 1-10 can roughly fit the target distribution.
) ; ; ( ) ; ; ( ) ; ; ( ) (X =w1g X μ1 Λ1 +w2g X μ2 Λ2 +w3g X μ3 Λ3 P
To enhance the detection accuracy, expectation-maximization algorithm can be adopted to update the mean and covariance matrix of each Gaussian distribution, as expressed in Equation 2-11, Equation 2-12 and Equation 2-13. However, computation complexity may greatly increase in the training stage.
∑
= = N i g i new l p l x N w 1 ) , / ( 1 θ∑
∑
= = = N i g i N i g i i new l x l p x l p x 1 1 ) , / ( ) , / ( θ θ μ∑
∑
= = − − = Λ N i g i T new l i new l i N i g i new l x l p u x u x x l p 1 1 ) , / ( ) )( ( ) , / ( θ θ X g(x;μ1;Λ1) g(x;μ3;Λ3) g(x;μ2;Λ2) Equation 2-10 Equation 2-12 Equation 2-13 Equation 2-11Figure 2-18 [6] illustrates the skin color detection results. Compared to the unimodal Gaussian model, the multiple Gaussian model performs much better.
(a) original image (b) detected results
(c) original image (d) detected results
Figure 2-18 S lts through M ith EM [6]
.2.2.3 Elliptical boundary model
plified version of the unimodal Gaussian mod
kin color detection resu ultiple Gaussian model w
2
Elliptical boundary model is a sim
el. However, this model requires more training data to estimate the center and range of the ellipse. It is obviously that the skin color distribution can be well contained in an ellipse, as illustrated in Figure 2-19 [8]
(a) r-g color space (b) CIE-u*v* color space
Fi stribution in
After the m can be detected
throu
E gure 2-19 Skin color di different color spaces [8]
ean and covariance matrix are estimated, skin color gh Equation 1-14. ] [ ] [ ) ( = −ψ Λ1 −ψ Φ − X X X T quation 2-14
θ
< Φ( X)
Then, a threshold theta is to be decided. When means the pixel X belongs to skin color; otherwise, the pixel is classified as background. As mentioned
befo ion detec
mentioned in [8] as lust
re, the decision of theta affects the rates of correct tion and false alarm. When theta increases, performance is enhanced, and vice versa.
The ROC curve comparisons of unimodal Gaussian model, multiple Gaussian model, and elliptical model in six different color spaces are also
il rated in Figure 2-20. The comparisons indicate that the elliptical model has the best performance in these color spaces, but the unimodal Gaussian model performs the worst. 1 1 0 0.5 0.5 1 1 1 0 0.5 0.5 1 1 0 0.5 0.5 1 0 0.5 0.5 1 1 0.5 1 0 0.5 0 0.5 1 0.5
(a) r-g color space (b) CIE-a*b* color space
1 1 0 0.5 0.5 1 1 0 0.5 0.5 1 1 0 0.5 0.5 1 1 0 0.5 0.5 1 1 0 0.5 0.5 1 1 0 0.5 0.5
(c) CIE-xy color space (d) CIE-u*v* color space
1 1 0 0.5 0.5 1 1 0 0.5 0.5 1 1 0 0.5 0.5 1 1 0 0.5 0.5 1 1 0 0.5 0.5 1 1 0 0.5 0.5
(e) Cb-Cr color space (f) I-Q color space
Figure 2-20 ROC curves of unimodal Gaussian model, multiple Gaussian and elliptical model
In Table 2-3 [8] skin det false detection (FD) is used to ev
able 2-3 Detection performance of unimodal Gaussian model, multiple Gaussian and elliptical model
ection (SD) is fixed and the
aluate the performance. From the results, elliptical model also performs better than unimodal Gaussian model and multiple Gaussian model, as illustrated in Figure 2-20. However, compared to SPM or Histogram Lookup Table in the first category, these three approaches are a little worse in performance
T
2.3 Preferred skin color definition
references have to be defined. As m
o different races, environmental illum
Before preferred skin color reproduction, users’ p
entioned above, skin color varies with respect to different human races and different lightness. Hence, users’ preference may alter a lot in different conditions. Moreover, there are so many factors that may affect users’ preferred skin color, like users’ background (race, culture, gender, age, etc.), image lightness, environmental illumination, and color space, etc. In this thesis, we try to estimate users’ preferred skin color based on a few psychological experiments
To find the influence of skin color with respect t
ination and background lightness, some test patterns are needed. For example, Figure 2-21 shows the eight test patterns selected by Kuang [9]. Given these test patterns, skin color adjustment can be performed in a fixed color space. Adjusted images are then compared by users and the most preferred image can be selected. However, this straightforward approach requires a great amount of comparisons. As the number of test patterns increases, the number of comparisons grows rapidly and may even cause asthenopia.
(a) Asian-dark (b) Asian-medium (c) Asian-light
(d) Caucasian-indoor-flash (e) Caucasian-indoor (f) Caucasian-outdoor
(g) Indian-lady (h) Kid
To solve this problem, K ple and fast approach called cube
uang [9] proposed a sim
-selection method, as illustrated in Figure 2-22. Besides, this method also considers the large experimental deviation caused by these users who are not familiar with image processing.
Figure 2-22 Cube-selection method [9]
This method contains 14 comparisons in three rounds. In the first round, combined adjustment of hue and chroma is compared 4 times, and then the adjustment of lightness is compared. In the second round, comparisons similar to that of the first round are used, but the adjustment scale is halved to increase the selection accuracy. In the last round, only the combined adjustment of hue and chroma is compared. With this approach, only 14 comparisons are needed to select one user’s preference for each image.
2.4 Color transformation
color transformation is the last step and also area is detected and preferred skin color is defin
s Color transfer
d to transfer color between two images, In preferred skin color reproduction,
the most important step. After skin color
ed, a poor color transform may cause discontinuous artifacts in the corrected image. In the following sections, we will introduce some commonly used color transformations.
Reinhard’
2.4.1
Reinhard [10] proposed a simple metho as shown in Figure 2-23.
(a) source image (b) target image (c) adjusted image
Figure 2-23 Color transfer between images [10]
This approach only calculates the mean (l,α,β ) and covariance matrix ) f the source image and target image. According to the above color information, target
rs will be tran sed
(σl,σα,σβ o
color can be estimated, and the original colo sferred to new colors ba on Equation 2-15. t s s s t t s s s t t s s l s l t l l l l σ σ − + = ( ) ˆ β β β σ σ β α α α σ σ α β β α α + − = + − = ) ( ˆ ) ( ˆ
However, the color information is not processed in the RGB color space, but in the
lαβ color space defined by Reinhard [10] The reason is because the RGB color space is highly correlated. To improve the performance of color transformation, a less correlated color space is perferred. Equation 2-16 expresses the definition of the lαβ
Equation 2-15
⎥ ⎥ ⎥ ⎦ ⎤ ⎢ ⎢ ⎢ ⎣ ⎡ ⎥ ⎥ ⎥ ⎦ ⎤ ⎢ ⎢ ⎢ ⎣ ⎡ = ⎥ ⎥ ⎥ ⎦ ⎤ ⎢ ⎢ ⎢ ⎣ ⎡ ⎥ ⎥ ⎥ ⎤ ⎢ ⎢ ⎡ = ⎥ ⎥ ⎤ ⎢ ⎢ ⎡ ⎥ ⎥ ⎤ ⎢ ⎢ ⎡ ⎥ ⎥ ⎤ ⎢ ⎢ ⎡ = ⎥ ⎥ ⎤ ⎢ ⎢ ⎡ log M' L' , 0782 . 0 7244 . 0 1967 . 0 0402 . 0 5783 . 0 3811 . 0 M L G R M L ⎦ ⎢⎣ ⎥⎦ ⎢⎣ ⎥⎦ ⎢⎣ ⎥⎦ ⎢⎣ ⎥⎦ ⎢⎣ ' ' ' 2 / 1 0 0 0 6 / 1 0 0 0 3 / 1 S' 8444 . 0 1288 . 0 0241 . 0 S M L l S B S β α
Hence, color space transformation has to be done before and after color transfer to achieve desired results, as presented in Figure 2-24. In the first row tion image is transferred into a high saturation image. In the second row, the atmosphere of
, a low satura
a forest image is transferred into market atmosphere. In the third row, the actual image is transferred into a picture-like image.
(a) source image (b) target image (c) adjusted image
(d) source image (e) target image (f) adjusted image
(g) source image (h) target image (i) adjusted image
Figure 2-24 Results of color transfer [10]
2.4.2 Affine transform
Affine transform consists of three operations, translation, scaling and rotation. Color transformation can be implemented by combinations of these three operations. Kim [2] adopts affine transform for color transformation, as illustrated in Figure 2-25 where x-axis and y-axis represent u’ and v’, respectively. The blue triangles indicate the original skin colors while the red triangles indicate the preferred skin colors. Through affine transform, the outer ellipse is transformed to the inner ellipse, and the preferred skin colors are reproduced.
Figure 2-25 Preferred skin color transformation [2]
However, this approach may cause some artifacts around discontinuous areas. Therefore, Kim [2] proposed a method to diminish these artifacts, as illustrated in Figure 2-26 [2] In this approach, the adjustment factor is decided according to the distance between a color and the skin color center (
REF c
1 0P
P ). In other words, if the skin color similarity of a color decreases, the adjustment factor is reduced.
Figure 2-27 shows the skin color reproduction results of two different races, Asian in the first row and Caucasian in the second row. In these results, it can be seen that reddish skin color becomes yellowish.
(a) original image (b) Reproduced image
(c) original image (d) Reproduced image
2.4.3 Distribution mapping
Pitie [13] proposed a method on the mapping of N-dimensional probability distribution. Figure 2-28 illustrates an example of mapping between two 2D probability distributions. This method will rotate the original distribution on every dimension until the KL distance is minimized. This approach is actually an application of affine transform. The original distribution can be transformed to well fit the target distribution and the artifacts in the image can be reduced. However, computational complexity grows rapidly when the data dimension increases.
Some results of color transformations are shown in Figure 2-29. In the first row, one scene is transformed into another scene. In the second row, the color of daytime is mapped to the color of nighttime. In the third row, it is a mapping between two lightness conditions. In the results, the desired color transformation is achieved and image artifacts are apparent. However, the computational complexity is very heavy.
(a) source image (b) target image (c) adjusted image
(d) Source image (e) Target image (f) Transformed image
(g) source iamge (h) target image (i) adjusted image
Figure 2-29 Color transformed results [13]
Besides, this method can also be used for atmosphere transformation, as presented in Figure 2-30. In the middle column, image atmosphere is transformed into 70’s air. In the right column, a club atmosphere is produced.
(a) source image (b) adjusted image (c) adjusted image
(d) atmosphere of 70’s (e) club atmosphere
Chap 3 Proposed methods
This chapter introduces our proposed preferred skin color reproduction, including skin color detection, preferred skin color definition and skin color correction. Figure 3-1 shows the flow chart of preferred skin color reproduction. This system detects skin color regions first, and then the colors of detected regions will be corrected according to users’ preference. These three processes will be discussed in the following sections.
User
Preferred
skin color
distribution
Skin color
detection
Skin color
correction
Input image
Output image
User
Preferred
skin color
distribution
Skin color
detection
Skin color
correction
Input image
Output image
3.1 Neural network-based skin color detection
As mentioned before, there are two categories of skin color detection approaches. One category requires a large amount of data to construct the skin color distribution model. The other category utilizes a more complicated skin color model for detection but with smaller database. In this thesis, a multilayer neural network is adopted to detect skin color, as illustrated in Figure 3-2. In this figure, a 4-layer neural network is used, in which the input is the RGB values and the output is the probability of being skin or non-skin color. With this neural network, skin color regions within an image can be easily detected.
……
R G B L1 L2 L4 Skin Non-skin input layer hidden layer output layer……
L3……
R G B L1 L2 L4 Skin Non-skin input layer hidden layer output layer……
L3Figure 3-2 Multilayer neural network [15]
There are some reasons why a neural network is adopted in this thesis for skin color detection.
¾ Most computations are spent during the off-line training. At the detection stage, the computational complexity is very light.
¾ This approach doesn’t require a large database to construct skin color distribution model.
¾ Fuzzy logic can be easily adopted to facilitate skin color correction. ¾ High detection accuracy.
3.2 Preferred skin color experiment
As aforementioned, there are so many factors that influence skin color. Hence, in this thesis, a psychological experiment is designed to find the preferred skin color at different conditions. However, it is impossible to find a preferred skin color that everyone likes. Here, we focus on some specific users with similar backgrounds to simplify the problem. The problem can be even simplified if we focus on “a single user’s preferred skin color”. In the following sections, experimental settings and the adopted methods will be introduced.
3.2.1 Experimental settings
Figure 3-3 shows our experimental settings. A 37-inch LCD panel is used for preferred skin color observation. The distance between a user and the panel is about 60 to 80 cm, and the normal office fluorescent light is used for environmental illumination. Besides, we limit the experiment time of every user to be less than one minute to avoid experimental errors cause by asthenopia. Seventeen students in the Electronics Engineering Department of National Chiao Tung University participated in this experiment.
60~80cm 60~80cm
Figure 3-3 Preferred skin color experimental settings
All the test images are captured by a Konica Minolta DiMAGE X50 camera. Figure 3-4 shows the selection of test patterns. This image set is used to test whether the environmental illumination, gender, and human race may have influence over the preferred skin color. In the test patterns, there are two genders, female and male; and three kinds of environmental illumination, outdoors, indoors with flashlight, and indoors without flashlight.
(a)Caucasian female (b)Caucasian female (
(c)Caucasian female (outdoor) indoor, without flash) (indoor, with flash)
(d)Caucasian male (outdoor)
(e)Caucasian male (indoor, without flash)
(f)Caucasian male (indoor, with flash)
(g) Asian female (outdoor) (h)Asian female (indoor, without flash)
(i)Asian female (indoor, with flash)
(j)Asian male (outdoor)
(k)Asian male (indoor, without flash)
(l)Asian male (indoor, with flash)
(g)Black female (outdoor) (h)Black female (indoor, without flash)
3
e
The Graphic User Interface Matlab. In Figure 3-5, we show this interface, which include.
(b) a selection icon to select human race, which can be Asian, Black, or Caucasian; (c) a
d values of hue, saturation and value (intensity);
.2.2 Experimental m thods
program is written in
(a) a region to display the test pattern;
n icon to select the test pattern; (d) three bars to select preferre (e) a “RESET” button; and (f) a “SAVE” button. (a) (b) (d) (c) (e) (b) (d) (a) (c) (e)
Figure 3-5 Graphic User Interface
Since the HSV color space better fits the perceptual color of human eyes than most color spaces, users can easily select the preferred skin color image through the adjustment of hue, saturatio ng background colors, only the skin color will be adjusted. Hence, the skin color regions of each image had been manu
n and value. To avoid affecti
ally segmented in advance, as shown in Figure 3-6.
(a) test image (b) manually segmented skin regions
Further, to avoid these artifacts appearing at the discontinuous regions between skin color regions and neighboring non-skin color regions, a manually segmented mask is smoothed via a 5-by-5 averaging kernel to reduce the discontinuity. Figure 3-7 illustrates the smoothed mask.
25 / 1 25 / 1 25 / 1 × ⎥ ⎤ ⎢ ⎢ ⎡ L O M L 5 5 25 / 1 ⎥ ⎥ ⎦ M ⎢⎣1/25 55 25 / 1 25 / 1 × ⎥ ⎤ ⎢ ⎢ ⎡ L O M L 25 / 1 ⎥ ⎥ ⎦ M ⎢⎣1/25 55 25 / 1 25 / 1 × ⎥ ⎤ ⎢ ⎢ ⎡ L O M L 25 / 1 ⎥ ⎥ ⎦ M ⎢⎣ (a) 原始選擇影像 (b) 修改後影像 (a) 原始選擇影像 (b) 修改後影像
Figure 3-7 Illustration of the ma
(a) Skin color mask (b) Blurred Mask
sk passed smoothed via a 5-by-5 averaging kernel
Take the outdoor Asian female image as an example. If a user prefers to increase the saturation and intensity values by 5, then the adjusted image looks like the image presented in Figure 3-8 (b).
(a) original image (b) users’ preferred image
Figure 3-8 Example of a user’s preferred skin color image
After all users have selected their preference, the skin color within a small region, as illustrated in Figure 3-9, will be analyzed among different users to find the differences with respect to environmental illuminations, gender, and human races.
3.2.3 Experimental results
Based on the proposed experiment, we can get some statistical results about preferred skin color. Figure 3-10 (b) and (c) show the preferred skin color distribution on the HS and SV color planes for the outdoor Asian female image. The red points represent the original skin color in the image. The blue points (0~16) represents preferred skin colors of the 16 users. The green mark represents the mean of all users’ preferences.
In Figure 3-10, it can be seen that more user (11 persons) prefer higher hue
value while fewer use he numbers of users
who prefer higher saturation values and lower saturation values are almost the same. r intensity values while only 2 persons prefer lower intensity values. Based on this statistical results, we can assume that most peop
s
rs (6 persons) prefer lower hue values. T
Most users (15 persons) prefer highe
le prefer 1~2 degrees of increase on the hue value, no changes on the saturation value, and 6~7 percent of increase on the intensity value.
(a) original image (b) hue-saturation distribution of preferred skin color
(c) saturation-intensity distribution of preferred skin color
Figure 3-11 shows the preferred skin color distribution on the HS and SV color planes for the indoor without flashlight Asian female image. In the results, most users (12 persons) prefer lower hue values while others prefer higher hue values. Most users (11 persons) prefer higher saturation values while others prefer lower saturation values. All users prefer higher intensity values. Hence, it is assumed that, for the indoor without flashlight Asian female image, users prefer 2~3 degrees of decrease on the hue value, 1~2 percents of increase on the saturation value and 9~10 percents of increase on the intensity value.
(a) original image (b) hue-saturation distribution of preferred skin color
(c) saturation-intensity distribution of preferred skin color
Figure 3-12 shows the preferred skin color distribution on the HS and SV color planes for the outdoor Caucasian female image. Most users prefer higher hue, saturation and intensity values. Hence, it is assumed that, for the outdoor Caucasian female image, users prefer 2~3 degrees of increase on the hue value, 1~2 percents of increase on the saturation value and 4~5 percents of increase on the intensity value.
(a) original image (b) hue-saturation distribution of preferred skin color
(c) saturation-intensity distribution of preferred skin color
Figure 3-13 shows the preferred skin color distribution on the HS and SV color planes for the indoor with flashlight Caucasian female image. Most users prefer higher hue values while others prefer lower hue values. Almost every user prefers lower saturation values while a few prefer higher saturation values. All users prefer higher intensity values. Hence, it is assumed that, for the indoor with flashlight Caucasian female image, users prefer 1~2 degrees of increase on the hue value, 4~5 percents of decrease on the saturation value, and 6~7 percents increase on the intensity value.
(a) original image (b) hue-saturation distribution of preferred skin color
(c) saturation-intensity distribution of preferred skin color
Figure 3-14 shows the preferred skin color distribution on th HS and SV color planes for the outdoor Black female image. The numbers of users prefer higher hue/saturation values and lower hue/saturation values are almost the same. Most users (12 persons) prefer higher intensity values while a few prefer lower intensity values. Based on the statistical analysis, the distribution of preferred skin color of the Black female image has a wide range. Hence, it is roughly assumed that, for the outdoor Black female image, users prefer 1~2 degrees of increase on the hue value, no changes on the saturation value, and 2~3 percents of increase on the intensity value. However, the preferred skin color of this case is difficult to define.
(a) original image (b) hue-saturation distribution of preferred skin color
(c) saturation-intensity distribution of preferred skin color
Figure 3-15 shows the preferred skin color distribution on the HS and SV color planes for the indoor without flashlight Black female image. The numbers of users prefer higher hue values and lower hue values are almost the same. Most users prefer lower saturation values and higher intensity values. Hence, it is assumed that for the indoor without flashlight Black female image, users prefer no changes on the hue value, 2~3 percents of decrease on the saturation value, and 2~3 percents of increase on the intensity value.
(a) original image (b) hue-saturation distribution of preferred skin color
(c) saturation-intensity distribution of preferred skin color
Table 3-1 shows the prefer skin color results of all test patterns. There are three marks in the first column. The first mark represents the human race, which can be Asian, Black, or Caucasian. The second mark represents the gender, which can be female or male. The third mark represents the environmental condition, which can be outdoor (O), indoor without flashlight (I) and indoor with flashlight (I). Take Asian M. IF. As an example, it represents the image of indoors with flashlight Asian male image.
Table 3-1 Preferred skin color results of all test patterns
H↓ H↑ S↓ S↑ V↓ V↑ Asian F. O. 6 11 8 9 2 15 Asian F. I. 12 5 6 11 0 17 Asian F. IF. 6 11 8 9 6 11 Asian M. O. 1 16 10 7 1 16 Asian M. I. 1 16 9 8 0 17 Asian M. IF. 2 15 13 4 5 12 Black F. O. 8 9 8 9 5 12 Black F. I. 8 9 12 5 5 12 Caucasian F. O. 3 14 6 12 4 13 Caucasian F. I. 6 11 15 2 0 17 Caucasian F. IF. 8 9 13 4 3 14 Caucasian M. O. 17 0 12 5 0 17 Caucasian M. I. 5 12 16 1 1 16 Caucasian M. IF. 6 11 15 2 4 13
Observing in Table 3-1 the hue and saturation values of the preferred skin color, there is no unanimous preference under all conditions, such as different human races, different genders, or different env
value of preferred skin color tends
e lor is darker. Hence, almost every user prefer increases the intensity value of conditions. However, if the image is captured under a high ination condition, some users prefer reducing the intensity value of skin color
ost users still prefer raising the intensity value.
ironmental illuminations. Nevertheless, the intensity to increase for every condition.
Furthermore, if the image is captured under a low illumination condition, th skin co
skin color at all kinds of illum
while m
all users, the mean of preferred skin color is measured, as listed in Table 3-2. In this table, the HSV colo
Table of skin col preferred skin co
an of or al skin Mean of preferred skin color r space is adopted.
3-2 Mean original or and lor
Me igin color
Caucasian (16.86, 43.55, 71.52) (16.43, 40.40, 76.55) Asian (21.90, 39.62, 68.32) (23.57, 39.29, 73.02) Black (26.50, 36.16, 63.09) (26.51, 36.98, 69.73) In Table 3-2, the eferred value o sian im es is sm er than
, but is la er than of Cau ian images. The preferred saturation n images maller t that of Caucasian rger th that ages. The preferred ensity o sian im s is sm er than of
, but arger th hat of Black image ence, w an assu at in colo f Asian ages is between that of Caucasian images and
ry
xperiment
peri ntal results mentioned above, we reach the following onclusions.
that of Caucasian
in color under all conditions. Moreover, higher intensity values require smaller adjustments while lower intensity values require larger adjustments. Hence, the adjustment of skin color intensity can be decided based on the intensity value of the original skin color.
other hand, for a specific user, if we want to know his/her skin color preference, we may still adopt this experiment to gather the statistical trends
pr hue f A ag all that of
Black images rg that cas
value of Asia is s han images, but is la an
of Black im int f A age all that
Caucasian images is l an t s. H e c me th the preferred sk r o im Black images.
3.2.4 Summa
of E
From the ex me c¾ There is no unanimous preferred hue and saturation values for all users under all conditions. Hence, soothe preferred values are only defined based on the averaged values of all users’ preferences.
¾ The preferred skin color of Asian people is between
people and Black people. Hence, it is assumed that the preferred skin color of Caucasian people and Black people are two extreme cases. Any other preferred skin colors can be acquired through a weighted summation of these two extreme cases.
¾ Users prefer raising the intensity value of sk
As mentioned before, it is difficult to define the preferred skin color that everyone likes. Hence, in this thesis, the mean of all users’ preference is adopted to define the preferred skin color. On the
3.3
ty-bas
lassifi
Af preferred , the dete o be
class
who live there have darker skin color. Oppositely, people who live far
Intensi
ed skin color c
cation
ter the skin color is defined cted skin color has t ified. According to the classification results, the skin color can be reproduced. As mentioned before, the skin color is mainly caused by the hemoglobin and melanin. In the skin of different human races, the amount of hemoglobin is almost the same, but the amount of melanin is varying. There are two important factors that affect the amount of melanin: human race and sunlight. Figure 3-16 [17] illustrates the human skin color distribution of the whole world. Since the sunlight near the equator is stronger, people
from the equator have lighter skin color.
Figure 3-16 Human skin color distribution [17]
e, different human races may share similar skin colors if they are exposed to egrees of sunlight exposu
Henc different d 3-17, i under dar different c
re. This phenomenon can be illustrated in Figure wh ch was plotted by ChiCha. In this figure, three columns show the skin color k, middle and light illuminations, respectively. The nine rows represent ombinations of sunlight conditions and human races.
Dark Middle Light Dark Middle Light Dark Middle Light
These 27 kinds of skin colors can be further plotted on the HS and SV color planes, as shown in Figure 3-18. We use three letters to represent each skin color. The first letter represents sunlight condition, including pallor (P), midtone (M) and tanned (T). The second letter represents human race, including Asian (A), Black (B) and Caucasian (C). The third letter represents lightness condition, including dark (D), middle (M) and light (L).
In the HS color plane, it can be observed that the saturation of skin color is reduced when the environmental lightness increases. However, the perceptual results do not have any help on skin color classification. On the other hand, in the SV color plane, some perceptual results can be obtained. For example, when the environmental lightness increases, the skin color intensity is raised and its color looks brighter. Oppositely, when the environmental lightness decreases, the skin color looks darker. However, considering the sunlight conditions and human
races, the skin co nd offers no referable
information.
lor distribution has a very wide range a
(a) H-S space
(b) S-V space
Acco races simp chara conc ¾
ions in the HSV color space.
¾ The lightness of skin color in an image has more influence on users’ adjustment on the intensity of preferred skin color than human races.
¾ The skin color of different human races under different sunlight conditions may be similar. Environmental illumination has great influence on skin color classification.
It is obvious that environmental illumination is a great influencing factor of skin color classification. Furthermore, the users’ adjustment on preferred skin color intensity is based on the lightness of the original skin color. Therefore, the image intensity, instead of human race, is adopted in our approach for skin color classification. As shown in Figure 3 bership function can be utilized to define the weights of each skin color, including dark skin, midtone skin and light skin. Through this classification, the adjustment of skin color can be easily decided.
rding to the above results, the skin color characteristics of different human cannot be clearly defined. Hence, it’s difficult to classify the detected skin color ly based on color information. Moreover, according to the skin color
cteristics and the results of preferred skin color experiment, there are some lusions.
The skin color of human race in an image has more influence on users’ adjustment on the hue and saturation values of preferred skin color. From the experimental results, users’ preferred skin color of different human races has occupied different reg
-19, fuzzy mem Intensity Dark skin Midtone skin Light skin 1 Intensity Dark skin Midtone skin Light skin 1
Figure 3-19 Fuzzy membership function of skin color classification
Figure 3-20 shows an example of skin color classification. Blue color represents the light skin color while the green colo midtone skin color. Based on this result, the preferred skin color under dif
r represents the
ferent lightness can be defined.
(a) original image (b) result after skin color classification
3.4
in color adjustment based on
detec skin color adjustment.
detec
(b). Therefore, artifacts may appear at the discontinuous regions between skin color regions and neighboring non-skin color regions, as indicated within the red square of Figu
Similarity-based skin color adjustment
This section will introduce the similarity-based sk
the results of skin color detection and classification. As mentioned before, the skin tion of neural network is fuzzy logical and it is helpful on
Since there are only two results, skin color and non-skin color, for most skin color tion methods, the detected regions are often incomplete, as shown in Figure 3-21
re 3-21 (c).
(a) original image (b) detected results (c) correction artifacts
Figure 3-21 Skin color detection results and skin color adjustment artifacts
To diminish this kind of artifacts, the distance between the original skin color
and the preferred sk ent. If the
r
degree of skin color adjustment can thus be varied based on the skin color probability. With such a neural network, artifacts can be greatly reduced.
in color is considered to decide the degree of adjustm
neural network is adopted for skin color detection, the detected results at colo discontinuous regions will be fuzzy logical, as shown in Figure 3-22 (b), and can offer the information about the probability of being a skin color. Hence, the
(a) original image (b) result of skin color detection
(c) reproduced image
3.5 System Overview
Figure 3-23 shows the preferred skin color reproduction system. First, a neural network is utilized to detect skin color, and the skin color probability distribution of an image is retrieved. Second, based on our proposed fuzzy membership function, the skin color will be classified based on the intensity value. Third, according to the skin color classification results and the user-defined preferred skin color, the degree of adjustment can be decided. At last, based on the skin color probability model and adjustment degree, skin color will be reproduced.
NN-based skin color detection Intensity-based skin color classification Similarity-based skin color adjustment User-defined preferred skin color Original image Preferred image NN-based skin color detection Intensity-based skin color classification Similarity-based skin color adjustment User-defined preferred skin color Original image Preferred image re 3-23 Pr on sys Figu eferred skin color reproducti tem
Chap 4 Experimental Results
Through our proposed method explained in Chapter 3, the skin color regions in an image can be correctly detected. The colors in these regions can be reproduced according to user’s preference. The preferred skin color reproduction for different human races will be shown in the following sections.
Figure 4-1, Figure 4-2 and Figure 4-3 present the reproduction results of Caucasians. As shown in Figure 4-1 (b), the eyes, lips and necklaces can be eliminated from the detection results. From the skin color classification result as shown in Figure 4-1 (c), it is obvious that skin color of most pixels belong to midtone skin color. Figure 4-1 (d) shows the adjusted skin color. Since the saturation of original image is a bit higher than users’ preference, the saturation value will be reduced. At the same time, the intensity of the image is also increased.
(a) original image (b) result of skin color detection
(c) result after skin color classification (d) reproduced image
Based on users’ preferences, the hue and saturation of the original skin color are reduced, while the intensity value is increased, as shown in Figure 4-2 (d). In the results, preferred skin color is reproduced, and the artifacts at the discontinuous regions between the skin color and non-skin colors are also eliminated.
(a) original image (b) result of skin color detection
(c) result after skin color classification (d) reproduced image
Figure 4-2 Experimental results of Caucasian female
In Figure 4-3, the saturation and intensity of the original skin color are lower than users’ preferences. Hence, both saturation and intensity values are increased to achieve preferred skin color.
(a) original image (b) result of skin color detection
(c) result after skin color classification (d) reproduced image
Figure 4-4 and Figure 4-5 show the experimental results for Asians. The saturation and intensity are increased.
(a) original image (b) result of skin color detection
(c) result after skin color classification (d) reproduced image
Figure 4-4 Experiment results of Asian male
(a) original image (b) result of skin color detection
(c) result after skin color classification (d) reproduced image
Figure 4-6 and Figure 4-7 show the experimental results for Blacks. The hue and intensity values of the original skin color are raised, while the saturation value is reduced, as shown in Figure 4-6.
(a) original image (b) result of skin color detection
(c) result after skin color classification (d) reproduced image
Figure 4-6 Experimental results of Black female
In Figure 4-7, the hue and intensity values of the original skin color are raised according to users’ preference.
(a) original image (b) result of skin color detection
(c) result after skin color classification (d) reproduced image
In the above experimental results, only one human race is present in each image. Based on our proposed method, the skin color of multiple human races can also be detected and reproduced, as shown in Figure 4-8.
(a) original image (b) result of skin color detection
(c) result after skin color classification (d) reproduced image
Chap 5 Conclusions
In our proposed preferred skin color reproduction system, a well-trained neural network is used for skin color detection. A multilayer neural network can detect skin color regions accurately and efficiently. The neural network also has great adaptation to the skin color detection of multiple human races. In our subjective preferred skin color experiment, a graphic user interface (GUI) is developed to help users to efficiently select preferred skin colors. Besides, in our experiment, it is found that the environmental illumination has great influence on skin color classification. Hence, a fuzzy logic system mation is adopted to classif
According to the clas user’
are reproduced without producing artifacts at the discontinuous regions between the skin colors and neighboring non-skin colors.
using lightness infor sification results and
y skin colors. s preference, the detected skin colors
Reference
[1] M. Storring, “Computer Vision and Human Skin Color”, PHD Dissertation, Aalborg University, 2004
[2] D. Kim, H. Do and S. Chien, “Preferred Skin Color Reproduction Based on Adaptive Affine Transform”, IEEE Transactions on Consumer Electronics, Volume 51, Issue 1, pp.191-197, Feb. 2005.
[3] J. Brand and J. S. Mason, “A Comparative Assessment of Three Approaches to Pixel-Level Human Skin-Detection”, IEEE 15th International Conference on Pattern Recognition, Proceedings Volume 1, pp.1056-1059, Sept. 2000.
[4] M. J. Jones and J. M. Rehg, “Statistical Color Models with Application to Skin Detection”, IEEE Computer Society Conference on Computer Vision and Pattern Recognition, Volume 1, pp.274-280, June 1999
[5] S.N. Yendrikhovskij, F.J.J. Blommaert and H. de Ridder, “Optimizing Color Reproduction of Natural Images”, The Sixth Color Imaging Conference, pp.140-145, 1998
Q. Zhu, K. Cheng, C. Wu and Y. Wu, “Adaptive Learning of an Accurate Skin-Color Model”, IEEE International Conference on Automatic Face and Gesture Recognition, pp.37-42, May, 2004.
L. Gu and B. D., “Skin Colour Region Detection in MPEG Video Sequences”, IEEE International Conference on Image Analysis and Processing, pp. 898 – 903, Sept. 1999
J. Lee and S. Yoo, “An Elliptical Boundary Model for Skin Color Detection”, International Conference on Imaging Science, Systems, and Technology (CISST'02), June 2002
J. Kuang, X. Jiang, S. Quan and A. Chiu , “A psychophysical study on the influence factors of color preference in photographic color reproduction”, Proceedings of SPIE, Vol. 5668, pp. 12-19, January 2005,
Reinhard, E.; Adhikhmin, M.; Gooch, B.; Shirley, P. , “Color Transfer between Images”, IEEE Volume 21, Issue 5, pp. 34 – 41, July-Aug. 2001
W. Zheng; Z. Lu; X. Xu , “A Novel Skin Clustering Method for Face Detection”, Innovative Computing, Information and Control, Volume 3, pp. 166 – 169, Aug. 2006
Levkowitz, H.; Herman, G.T. , “GLHS: A Generalized Lightness, Hue, and Saturation Color Model”, CVGIP: Graphical Models and Image Processing, Vol: 55, Issue: 4, pp. 271-285, July, 1993
Pitie, F., Kokaram, A.C., Dahyot, R. , “N-Dimensional Probability Density [6] [7] [8] [9] [10] [11] [12] [13]
Function Transfer and its Application to Colour Transfer”, Tenth IEEE onference on Computer Vision, Volume 2, pp.1434 - 1439, Oct. 2005
pplied Imagery Pattern Recognition Workshop,
[15]
International C
[14] M. Seow; Valaparla, D.; Asari, V.K.; “Neural Network Based Skin Color Model for Face Detection”, A
Proceedings. 32nd, pp.141 - 145, Oct. 2003
Arun D. Kulkarni, “Computer Vision and Fuzzy-Neural Systems”, published by Prentice Hall, 2001.
[16] S. L. Phung, A. Bouzerdoum, and D. Chai, “Skin segmentation using color pixel classification: Analysis and comparison,” IEEE Trans. Pattern Anal. Mach. Intell., vol. 27, no. 1, pp. 148–154, Jan. 2005.
[17] http://en.wikipedia.org/wiki/Human_skin_color
[18] http://www.idigitalemotion.com/tutorials/guest/skin_tone/skintone.html H. Lin, S. Wang, S. Yen and Y. Kao; “Face Detectio
[19] n Based on Skin Color
Segmentation and Neural Network”, International Conference on Neural Networks and Brain, Volume 2, pp.1144 - 1149, Oct. 2005

![Figure 2-1 Distribution of sky blue, grass green and human skin color on (u’, v’) color plane [5]](https://thumb-ap.123doks.com/thumbv2/9libinfo/8205022.169697/12.892.134.768.367.731/figure-distribution-grass-green-human-color-color-plane.webp)
![Figure 2-3 Skin color of different country’s people at varying color temperatures [1]](https://thumb-ap.123doks.com/thumbv2/9libinfo/8205022.169697/13.892.197.720.220.688/figure-skin-color-different-country-people-varying-temperatures.webp)
![Figure 2-5 Skin and non-skin color distribution at RG, RB and GB color planes [3]](https://thumb-ap.123doks.com/thumbv2/9libinfo/8205022.169697/15.892.162.724.394.721/figure-skin-non-skin-color-distribution-color-planes.webp)
![Figure 2-9 Equiprobability contour model of skin and non-skin color [4]](https://thumb-ap.123doks.com/thumbv2/9libinfo/8205022.169697/18.892.132.757.554.945/figure-equiprobability-contour-model-skin-non-skin-color.webp)
![Figure 2-11 ROC curve of some existing methods [4]](https://thumb-ap.123doks.com/thumbv2/9libinfo/8205022.169697/20.892.135.761.529.882/figure-roc-curve-existing-methods.webp)
![Figure 2-16 Skin color detection results based on unimodal Gaussian distribution [6]](https://thumb-ap.123doks.com/thumbv2/9libinfo/8205022.169697/23.892.223.668.160.869/figure-skin-color-detection-results-unimodal-gaussian-distribution.webp)
