國 立 交 通 大 學
生物科技系所
碩 士 論 文
建立於奈米線場效電晶體上的高靈敏度、無須標
記且即時偵測的腸病毒 DNA 生物感測器
Poly crystalline
silicon nanowire field effect transistor based
biosensor for highly sensitive, label-free and real-time detection
of enterovirus DNA
研究生 :賴文燦
指導教授 :楊裕雄 教授
建立於奈米線場效電晶體上的高靈敏度、無須標記且即時偵
測的腸病毒 DNA 生物感測器
Poly crystalline silicon nanowire field effect transistor based
biosensor for highly sensitive, label-free and real-time detection
of enterovirus DNA
研
究 生:賴文燦 Student:Wen-Tsan Lai
指導教授:楊裕雄
Advisor:Yuh-Shyong Yang
國
立 交 通 大 學
生
物 科 技 系 所
碩
士 論 文
A ThesisSubmitted to Department of Biological Science and Technology College of Biological Science and Technology
National Chiao Tung University in partial Fulfillment of the Requirements
for the Degree of Master
in
Biological Science and Technology July 2010
Hsinchu, Taiwan, Republic of China
i
建立於奈米線場效電晶體上的高靈敏度、無須標記且即時偵
測的腸病毒 DNA 生物感測器
學生:賴文燦 指導教授:楊裕雄 教授
國立交通大學生物科技系所 碩士班
摘要
腸病毒七十一型(Enterovirus 71)對世界各地的幼童而言是一
種重要的致病原且比其他非小兒麻痺腸病毒具有高致病率及致死率,
其感染屬於神經性症狀,受感染的病童平均會在三天內惡化成重症。
過去的臨床確認檢驗方式需要先作病毒培養再進行病毒分離和藉由
反轉錄聚合酶鏈鎖反應(RT-PCR),這些檢驗流程趕不上惡化成重症的
時間,無法達到即時診斷出 EV 71 並作後續的醫療處置和疾病控管。
在過去的文獻中,多晶矽奈米線場效電晶體可被製成且具有高靈敏度、
無需標誌且即時偵測生物分子的生化感測器。將特定腸病毒的 DNA 序
列有專一性的單股 DNA 序列先固定在多晶矽奈米線場效電晶體表面,
將互補和非互補的 DNA 序列流過奈米線場效電晶體表面,能對 DNA 序
列作專一性辨識而兩互補的 DNA 序列產生雜交反應使奈米線場效電
晶體的導電度產生變化,最低 濃度可偵測到 fM (femto-molar,10
-15M)。
ii
此結果表示多晶矽奈米線場線電晶體具有高靈敏度、無需標誌且可即
時偵測的潛能,此特性可發展成生物感測系統用來偵測腸病毒的感染
型別並應用於其他傳染病篩檢。
iii
Poly crystalline
silicon nanowire field effect transistor based
biosensor for highly sensitive, label-free and real-time
detection of enterovirus DNA
Student: Wen-Tsan Lai Advisor: Yuh -Shyong Yang
Department of Biological Science and Technology, National Chiao Tung University
ABSTRACT
Enterovirus 71 (EV 71) is an important pathogen that causes higher morbidity
and mortality in children around the world than those of other non-Polio enteroviruses.
Its infection is neurotropic and even followed by rapid deterioration within average 3
days. The standard clinical methods for EV 71 identification require virus isolation in
cell culture and reverse transcriptase polymerase chain reactions (RT-PCR). Virus
isolation requires 5-10 days and hinders the subsequent treatment and disease control.
Poly silicon nanowire field effect transistor has been shown to function as transducer
for high sensitive, label-free and real-time biosensing to detect enterovirus infection.
The selectivity of target for detection can be achieved by surface modification on
NWFET. In our research, specific antibody or DNA sequences that recognize capsid
protein or nucleic acid will be immobilized on poly Si NWFET. Currently, we are able
to distinguish between EV 71 and CA 16 DNAs by real-time electrical analysis. It will
iv
Acknowledgement
自研究所進入LEPE 實驗室以來已經兩個年頭了,從當初懵懵懂懂的新生到 現在已經是要畢業的學長,這經過的時間說穿了也不過是兩年,但其中經歷過的 心歷路程可能遠超過以往的學生生涯。面對過不少問題與挫折,也在面對問題的 過程中學習如何解決問題的態度,也遇到了許多幫助我解決問題的良師益友們。 首先是感謝我的指導教授楊裕雄教授提供了一個風氣自由的研究環境,我在這裡 能夠培養解決問題的能力並且藉由跟實驗室的同仁們討論,從各種角度去探討跨 領域研究的問題點。這當中少不了實驗室成員們的幫忙,從一開始帶我跑元件製 程的若芬學姊和陪我爆肝的戰友康寧;提出很多想法和見解給我思考的程允學長; 對實驗要求很嚴謹的政哲學長;帶我做ELISA的小米學姊;幫我推拿整骨的淵仁 學長;傳授許多實驗訣竅和投影片整理技巧的小志、秀華和音汝;做任何事總是 面面俱到的陸宜;很熱心卻很跳tone的小胖;酒量驚人的普普、咏馨、晨竹還有 欣怡,經過各位的薰陶之下,我的酒量確實有明顯進步;還有實驗室陸陸續續進 來的新生也為實驗室注入一股新的活力;特別感謝NDL跟我們合作的明霈 賴文燦 民國九十九年 八月 學長, 明天要上班卻陪我們做實驗做到三更半夜。最後,我由衷地感謝長久以來默默支 持我讀書的父母,你們的支持就是對我最大的鼓勵,這份感恩之情難以言喻。感 謝能夠有緣份和各式各樣的人接觸學習造就了今天的我。v
Contents
Abstract (Chinese) .………..….i
Abstract (English) ..……….….iii
Acknowledgement ………...iv
Contents ..……….v
Contents of Tables ...……….………...vii
Contents of Figures ………viii
Abbreviations ……….ix I Introduction ………..……….1 1-1 Enterovirus ………..…………....1 1-1.1 Introduction of Enterovirus ………..…………...1 1-1.2 Transmission pathway ……….2 1-1.3 Epidemiology ……….. 3
1-1.4 Current clinical diagnosis methods ………... .3
1-1.4.1 Enterovirus isolation in cell culture... 4
1-1.4.2 Enterovirus antisera neutralization test (NT) ………...4
1-1.4.3 Immunofluorescence assay (IFA) ……….. . 5
1-1.4.4 Reverse transcription polymerase chain reaction (RT-PCR) …...5
vi
transistor ……….…...6
II Materials and methods ………...8
2-1 Experimental materials ………....8
2-2 Instruments ……….11
2-3 Poly crystalline silicon NWFET fabrication process ………….11
2-4 Microfluidic system ………...12
2-5 Surface modification ………..13
2-6 Sample transport at kinetic equilibrium ……….14
2-7 Liquid phase electrical measurement ……….14
III Results and discussion …..………...16
3-1 Nanowire chip selection in dry air condition ……….16
3-2 Biosensing of non-immobilized semiconductor device ……….16
3-3 Device characteristic verification in liquid phase ………..17
3-4 Enterovirus 71 (EV 71) DNA Biosensing ………..18
3-5 EV 71 DNA biosensing after hot water washed.………20
3-6 CA 16 DNA Biosensing ……….20
IV Summary and Perspective……….22
V Reference …....………...23
vii
Contents of Tables
Table 1 Enterovirus were classified based on their genomic sequences ……..30
Table 2 The common disease related enterovirus serotypes ………31
Table 3 Proposed pathogenesis of severe Enterovirus 71 infections …………32
Table 4 Historical perspective and case incidences of Enterovirus 71 in worldwide ………33
Table 5 The detection limit of all kinds of novel sensors ……….34
Table 6 Chip electrical conditions and rank classfication ………....35
viii
Contents of Figures
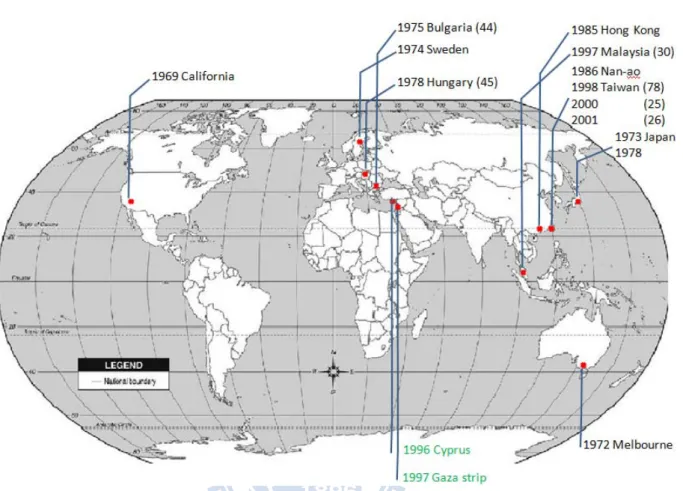
Figure 1 The epidemiology of enterovirus around the world, since 1969 …...37
Figure 2 Epidemic situation of Enterovirus infection with severe complications
in Taiwan, 1998-2008 ………..38
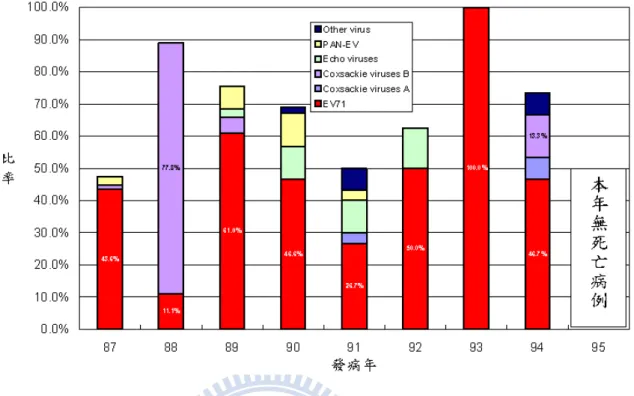
Figure 3 The distribution of serotypes of virus isolation from severe fatal case,
1998~2006 ………...39
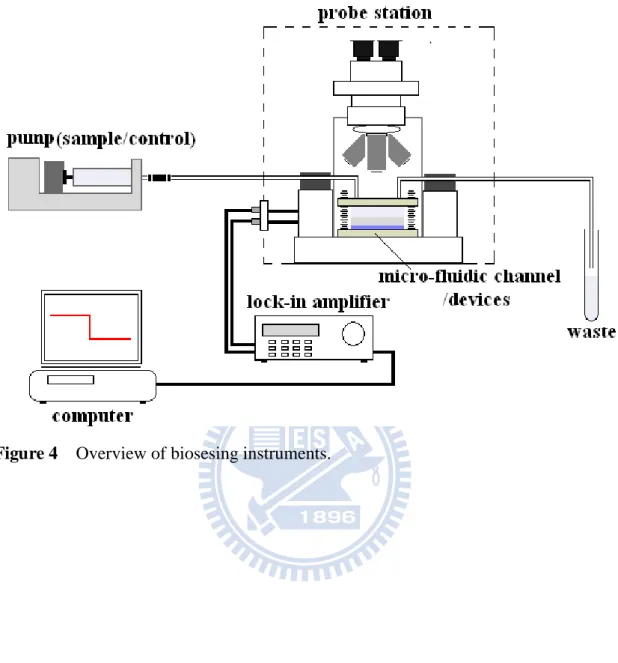
Figure 4 Overview of biosesing instruments ………...40
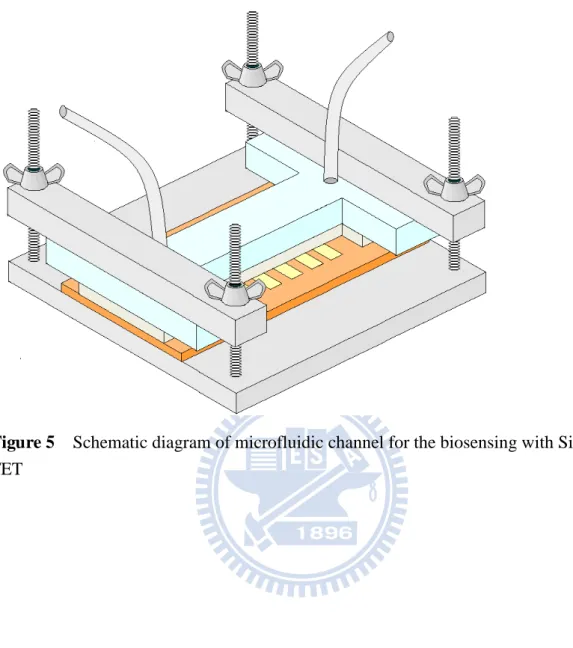
Figure 5 Schematic diagram of microfluidic channel for the biosensing with Si
NW FET ………...41
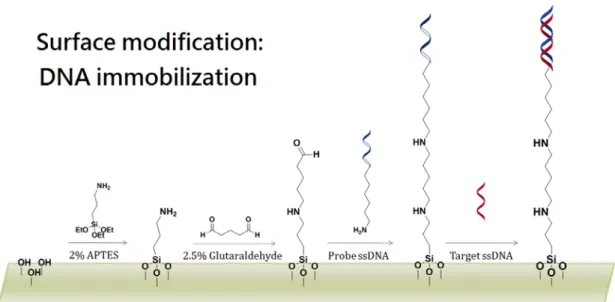
Figure 6 DNA immobilization process in microfluidic system ……….42
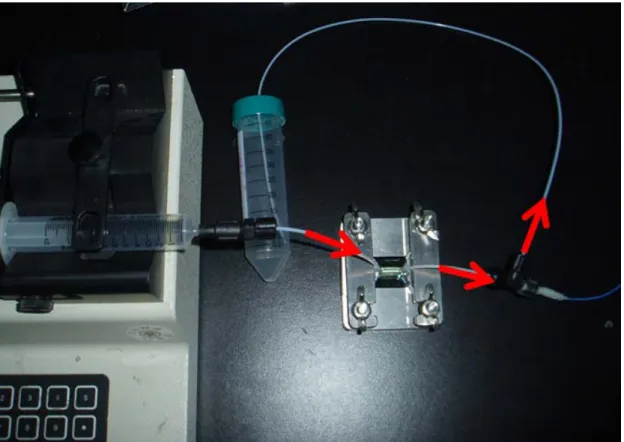
Figure 7 Sample transport direction and waste buffer bypass device ………....43
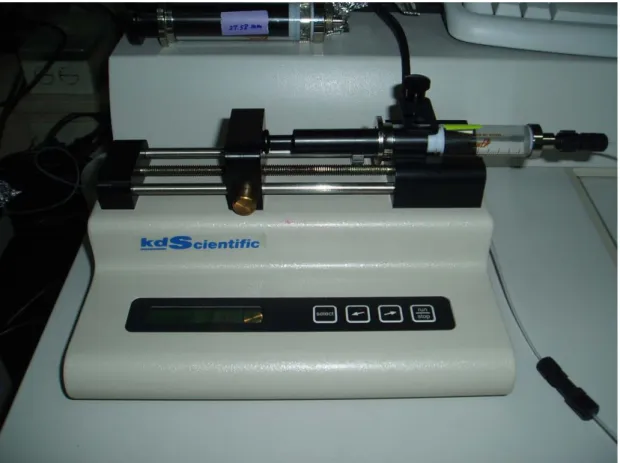
Figure 8 Programming Syringe pump ………....44
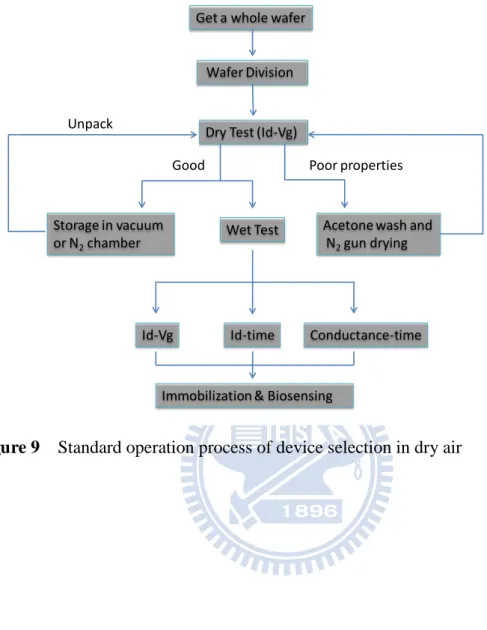
Figure 9 Standard operation process of device selection in dry air …………...45
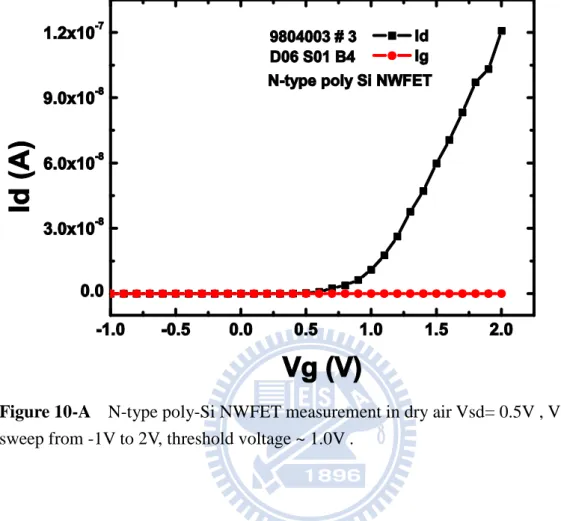
Figure 10-A N-type poly-Si NWFET measurement in dry air ( linear scale).……..46
Figure 10-B N-type poly-Si NWFET measurement in dry air ( log scale)………...47
Figure 11 Without any immobilization process, this biosensing acts as a control
set ...48
Figure 12 Conductance vs. Liquid gate plot accompany with the sensitivity
ix
Figure 13 N-type NWFET pH sensing at fixed liquid gate (1.15V) ………50 Figure 14 Real-time biosensing process of EV 71.………...51
Figure 15 Compare the conductance variation rate between 10 pM CA 16
(negative control) and 1fM EV 71(experiment) ………..52
Figure 16 Conductance vs. Liquid gate plot accompany with the sensitivity factor
after hot water washed………..53
Figure 17 EV 71 biosensing process after hot water washed condition.………..54
Figure 18 Calculating the most sensitive point of CA 16 biosensing …………..55
Figure 19 CA 16 Biosensing Process, the conductance value would reverse after
pH 7 buffer solution flushed ………56
x
Abbreviations
NWFET: Nanowire Field Effect Transistor
APTES: 3-Aminopropyltriethoxysilane
EV 71: Enterovirus 71
CA 16: Coxsackie Virus A 16
fM: femto-molecular (10-15 M)
1
I.
Introduction
1.1 Enterovirus
1-1.1 Introduction of Enterovirus
The enterovirus belongs to family Picornaviridae, single-strand RNA virus. They
consist of poliovirus (PV, 1-3 serotypes), coxsackie virus group A (CA, 1-22, 24
serotypes), group B (CB, 1-6 serotypes), and echo virus (EV, 1-33 serotypes, except 8,
10, 28) [1]. Since the 1960s, 4 newer enteroviruses have been discovered and named
with serial number only, such as enterovirus 68-71 [2, 3]. After 2000, enteroviruses
were classified by genomic sequencing to human poliovirus and human enteroviruses
A to D [4] (Table 1). The major outbreak occurred in Taiwan is Enterovirus 71 in the
summer of 1998 [5].
Enterovirus 71 (EV 71) belongs to human enterovirus A (HEV-A). EV 71 was
further classified by their nucleotide sequence to genotype A, B, and C. Genotype B
could be further classified into subtypes B1 to B5; and genotypes C into subtypes C1
to C5 [6, 7]. EV 71 and coxsackie virus A16 (CA 16) are both cause hand-foot-mouth
disease (HFMD), but EV71 associated with the further development of acute
neurological disease, including poliomyelitis-like paralysis, encephalitis, and aseptic
meningitis. The primary agent in fatal case was EV71 which defined by the endemic
2
1-1.2 Transmission Pathway
EV71 is primarily transmitted through the fecal-oral route. Respiratory droplets
are another route of transmission. Enteroviruses have been detected in water, soil,
vegetables and shellfish and may possibly be transmitted in the community by contact
with contaminated food or water. According to Chang’s research during the 1998
epidemic, the isolation rate of throat swabs was higher than rectal swabs. EV71 could
survive 1-2 weeks in the pharynx and 6-8 weeks in feces. It suggested that during the
acute phase of disease, the respiratory droplets or saliva of patients are highly
contagious and indicates that in limiting the spread of the epidemic, the respiratory
isolation of HFMD patients could be important [8]. It’s difficult to distinguish the
specific cause of most enterovirus infection in clinical screening. Most enterovirus
infection usually develops no clinical symptoms, mild upper respiratory symptoms, a
flu-like illness with fever, or self-limited infections, like Hand-foot-and-mouth disease
(HFMD) and herpangina(Table 2). But some may develop severe neurologic disease
or die, especially in young children[3] (Table 3). After the incubation period ranges
from 2-10 days, usual duration of illness is 3~6 days, symptoms start with fever and
general malaise[9]. After morbidity, its rapid deterioration average within 3 days, and
the majority of EV71 infected with severe complications are myoclonic jerks,
3
1-1.3 Epidemiology
Young children are most susceptible to EV infection. Males more often develop
clinically-recognizable disease than females[12]. Enterovirus 71 was first isolated
from the stool of an infant with aseptic meningitis in California of the United States in
1969 [13]. Since then, EV 71 has been identified in many parts of the world. Two
patterns of EV 71 outbreak have been classified. Small outbreaks involve with
occasional patient death, this occurred in the United States, Australia, Sweden, and
Japan [14-17]. The other severe outbreaks associated with high mortality, which
occurred in Bulgaria in 1975 with 44 deaths [18], in Hungary in 1978 with 45 deaths
[19], in Malaysia with at least 30 deaths [20], and in Taiwan in 1998 with 78 deaths
[21], in 2000 with 25 deaths, in 2001 with 26 deaths [3]. Outbreaks of aseptic
meningitis associated with enterovirus infection have been reported from Cyprus in
1996 and Gaza strip in 1997 [22]. The historical perspective and case incidences
worldwide [3, 18, 19] are shown as Table 4 and Figure 1. To catalog of the incidence
and case-fatality rate of enterovirus infections from 1998 to 2008 in Taiwan was
shown in Figure 2.
1-1.4 Current clinical diagnosis methods
The traditional “gold standard” for the diagnosis of Enterovirus infection is virus
4
neutralization test (NT) and detection of specific enterovirus serotype by the indirect
immunofluorescence assay (IFA) [23-25]. The final identification was carried out
using a number of different molecular approaches, including reverse transcription
polymerase chain reaction (RT-PCR), restriction fragment length polymorphism
(RFLP) analysis, and nucleotide sequence analysis of amplicons from various regions
of the genome[23, 25-27]. There are some classified principles from CDC in this
thesis.
1-1.4.1 Enterovirus isolation in cell culture
Diagnosis is made by detecting virus in throat or fecal swab samples, or more
convincingly, from specimens collected of the affected part of the body, for example,
cerebrospinal fluid (CSF), biopsy material, and skin lesions. A monkey cell line
(LLC-MK2), human lung cell line (MRC-5), human rhabdomyosarcoma cell line
(RD), African green monkey kidney cell line (Vero), human lung carcinoma cell line
(A549), and human epidermoid carcinoma cell line (Hep-2) were used to grow viruses
[23, 25]. Preliminary identification is based on the appearance of a minimum of 14
days for characteristic of a viral cytopathic effect (CPE)[28, 29].
1-1.4.2 Enterovirus antisera neutralization test (NT)
Serotype identification was performed by neutralization using Lim
5
diluted by PBS, mixed well, and the mixtures were heated. Then the method of gold
standard procedure was followed to make a two-fold serial dilution out of the sample,
and a definite amount (100 CCID50 / 50 μl) of virus was added to each of diluted
solutions. The mixture was then incubated 4 days before its neutralization antibody
titer determined [25, 30, 31]. At least, a four-fold rise in the level of neutralization
antibody titer in serum collected during the acute and convalescent phase of illness,
which provides the best evidence of a recent infection[2].
1-1.4.3 Immunofluorescence assay (IFA)
When cytopathic effect was observed, infected cells were scraped off the vessels,
washed in PBS, spotted on the slides. The monoclonal antibody blends were directly
applied to specific wells on each slide. The slides were incubated with a
prestandardized dilution of anti-mouse immunoglobulin G fluorescence-conjugated
antibody. After mounting, slides were then examined under a fluorescence microscope
[23-25]. In Rigonan’s research, the sensitivity of the IFA was 73% for polioviruses,
85% for coxsackieviruses type B, and 94% for echoviruses. Specificity was near
100% for polioviruses and coxsackieviruses type B and 94% for echoviruses[24].
1-1.4.4 Reverse transcription polymerase chain reaction (RT-PCR)
After RNA extraction, the purity and concentration of RNA was determined both
6
bands. RT-PCR were carried out by RT-PCR beads. The beads contained recombinant
Moloney Murine Leukemia virus (M-MuLV) reverse transcriptase for cDNA
synthesis, Taq DNA polymerase for amplification, RNase inhibitor, buffer, dNTPs.
RT-PCR products were examined by electrophoresis through 1~ 3% agarose gels and
ethidium bromide staining. The bands migrating at the predicted size were excised
and purified for further sequencing analysis [23, 25, 32].
1-2 Applying poly crystalline silicon nanowire field-effect transistor
Conventional techniques for the detection of biomolecular interactions are
limited by the need for exogenous labels, time- and labor-intensive protocols, as well
as by poor sensitivity performance levels[35]. Material scientists and engineers have progressively miniaturized the materials with advanced CMOS fabrication process
that constitute the building blocks of various biomedical devices, such as carbon
nanotubes[43], surface plasma resonances (SPR)[44], cantilever[45], quartz crystal
microbalance (QCM)[46], and quantum dots[47]. Some of these sensing devices, such
as those based on cantilevers and quantum dots, are highly specific, ultrasensitive, and
have a short response. However, these devices require integration with optical
components transducing surface phenomena to collectable signals. The requirement
for detection optics is expected to significantly increase the cost of operation for such
7
critical dimension less than the scale of approximately 100 nm at least. Table 5
compared the relative methods of biosensing, NW-FET can be developed to a highly
sensitive, label-free, and real-time biosensor. In the present method, NW-FET has the
highest sensitivity, and many research teams consider it as an important study
8
II.
Materials and Methods
2-1 Experimental material
1. 3-Aminopropyltriethoxysilane (APTES): H2N(CH2)3Si(OC2H5)3
Company: Sigma-Aldrich (USA) (A3648)
CAS Number : 919-30-2
Assay: ≥98%
2. Sodium cyanoborohydride: NaBH3CN
Company: Sigma-Aldrich (USA) (71435)
CAS Number : 25895-60-7
Assay: ≥95% (RT)
3. Ethanolamine hydrochloride: NH2CH2CH2OH‧HCl
Company: Sigma-Aldrich (USA) (E6133) Na+ -H 3B N NH2 HO H Cl
9 CAS Number : 2002-24-6
Assay: ≥99%
4. Glutaraldehyde solution: OHC(CH2)3CHO
Company: Fluka (USA)
CAS Number : 111-30-8
Grade: technical
Concentration: ~25% in H2O (2.6M)
5. Potassium phosphate monobasic: KH2PO4
Company: J.T.Baker (USA)
6. potassium phosphate dibasic: K2HPO4
Company: J.T.Baker (USA)
O O K+ P O HO OH O -K+ K+ P O HO O -O
-10
7. Ethanol (99.5%): CH3CH2OH
Company: Echo Chemical Co. (Taiwain)
8. Polydimethylsiloxane (PDMS): (H3C)3SiO[Si(CH3)2O]nSi(CH3)3
Company: Sil-More (Taiwan)
9. EV71 DNA sequences were designed for capture probe and the target DNA used on this project are listed as below and based on previous publication [27]. All synthetic oligonucleotides were purchased from MDBio Inc. (Taiwan).
5’-amino C6 modified captured DNA probe
DNA sequences (5’-3’) 5’-H2N C6 modified
captured DNA probe
Target DNA
EV71 a GTG GCA GAT GTG ATT GAG AG
CTC TCA ATC ACA TCT GCC AC
CA16 b GAG TGA TGG TTC AAC ACA CA
TGT GTG TTG AAC CAT CAC TC
a relative to BrCr nt 2448-2467 b relative to G-10 nt 2666-2685
10. Phosphate buffer solution (PBS) was prepared by Potassium phosphate
monobasic and Potassium phosphate dibasic dissolved in de-ionized
Si O Si O Si
11
water at 10 mM, adjusting pH value by buffer titration.
11. Deionized water (DIW)
resistance of water: 18.2 MΩcm ultra-pure water system (Barnstead).
2-2 Instruments
The whole instrument consisted of electrical measurement machine (Dual-channel
System Source Meter Instrument Model 2636) (Keithley), probe station with its
chamber (EVERBEING(奕葉) ), and programming syringe pump (Kd Scientic)
(Figure 4).
2-3 Poly crystalline silicon NWFET fabrication process
First, the fabrication began on Si wafers capped with a 100 nm-thick thermal
oxide. The second, a 50nm-thick nitride layer was deposited by low-pressure
chemical vapor deposition (LPCVD). After deposition of the nitride layer, following
deposing Tetraethyl ortho-silicate (TEOS) 100nm thick sketched with standard
photolithographic and etching steps were performed to form the oxide dummy
structures. Subsequently, a 100nm-thick amorphous-Si layer was deposited and then
annealed at 600°C for 24hr in N2 ambient to transform it into polycrystalline structure.
12
with a dose of 5E15cm2. After the generation of S/D photoresist patterns with a
lithographic step, a reactive plasma etching step was performed to form the S/D
regions. Because of the anisotropic etching process, two poly-Si NW channels were
formed separating by oxide dummy gate simultaneously during the S/D etching step.
By carefully controlling the etching time, the cross-sectional dimensions of poly-Si
NW channels can be easily reduced to sub-10 nm scale. Subsequently, all devices
were then covered with a 200nm-thick TEOS oxide passivation layer. Finally, remove
the oxide layer by 2-step dry/wet etching process to expose the poly-Si NW channels.
2-4 Microfluidic system
The microfluidic channel system will be made with acrylic, PDMS and metal
holder. First, the PDMS gel will be covered to the channel patterned glass substrate
(channel size: 13 mm X 1 mm X 0.5 mm) at 120oC for 10 minutes and wait for the
fluid gel transfer to solid state. The solidification PDMS channel will be separated
from the glass substrate and covered to the SNW chip. Then, make the limpid acrylic
blanket and drill two holes filling with Teflon tubes (outer diameter: 1.5 mm, inner
diameter: 0.5mm) for sample transport. Finally, limpid blanket of acrylic was covered
to the PDMS and the chip-PDMS-acrylic sandwich was fastened by a metal holder.
13
and be reused. The schematic diagram of the microfluidic system is shown in Figure
5.
2-5 Surface modification
We would do some treatments on chip surface before we measure the electrical
variation. The immobilization process is based on the microfluidic system. Initially,
we aligned the PDMS microfluidic channel covered on nanowire device row and
added acrylic blanket on PDMS solid gel. Then, fastened the blanket and PDMS gel
on nanowire chip by metal holder like the sandwich structure, tested whether the fluid
buffer seep from the sandwich-stacking microfluidic system (Figure 5). After setting
up the microfluidic system, it shall be locked an injection tubing connector. Inject
APTES in ethanol solution 1 ml through microfluidic channel and react for 17~20
minutes. Then, wash the channel with 95% ethanol. Turn on hot plate and set the
temperature about 110℃~120℃, put the whole microfluidic system on the hot plate
for 10 minutes. Then, cool the metal holder to room temperature and inject 2.5%
glutaraldehyde reacting for one and half hour in 10 mM pH 7 phosphate buffer.
Nanowire surface functional group would be changed from hydroxide into aldehyde
group, we would use DNA sequence modified amino-C6 at 5’end as a DNA probe to
14
DNA sequence diluted in 10mM pH 7 phosphate buffer, injecting 1 μM to
microfluidic channel for 3 hours or more. Continuously, block unbinding aldehyde
group with 50 mM ethanolamine at pH 9.1 phosphate buffer for one and half hour.
Finally, wash the channel with pH 7 phosphate buffer and ready measure. The overall
surface modification is shown in Figure 6.
2-6 Sample transport at kinetic equilibrium
In order to maintain the environment ionic strength level, we would keep the
microfluidic channel fluent to replace of quiescent state. First, set the microfluidic
system connecting a syringe pump at injection end and be locked a liquid gate at the
elution end. The waste buffer shunted by T-shaped tubing (Figure 7), sealed the end of
metal wire by silicone neutral sealant. Then, fix the flow velocity at 5 ml/h by Syringe
Pump (Kd Science) (Figure 8). Sample will be exchanged by changing another
syringe tube, a little bubble between two solution samples. The whole transport
system is semi-automatic, which fixed flow velocity by machine but changed syringe
tubes by people.
2-7 Liquid phase electrical measurement
15
to liquid phase environment. We would immobilize chemical compounds and
biomaterials on nanowire chip in microfluidic channel for 6 hours, changed surface
functional group in liquid phase. After treating the chip for a long time, we measured
the device properties by conductance-time method, compared with those relations of
the shift of threshold voltage to air condition and its’ stability. We measured these
data and calculated mathematically signal process, found the most sensitivity Vg point.
We got a plot for describing the relationship of conductance-Vg (liquid gate) and a
voltage which has the most sensitive variation rate. Then, fixed the Vg and measured
16
III.
Results and Discussion
3-1 Nanowire chip selection in dry air condition
Nanowire Field Effect Transistor (NWFET) wafers were fabricated at Class 100
clean room of National Nano Device Laboratory (Hsinchu city, Taiwan, R. O. C.),
sealing in an anti-electrostatic bag. We need to check the electrical properties before
biosensing, by using electrical analysis machine (Keithley 2636) to measure NWFET
chips. For the purpose, one standard operation process was built (Figure 9) to screen good
chips, record the data of Id-Vg plot and key parameters of threshold voltage, on/off
current ratio (Figure 10-A& 10-B), and then, look for good and stable chips for
biosensing. Chip selection principles were defined in Table 6, classified into three ranks,
best, acceptable and failed.
3-2 Biosensing of non-immobilized semiconductor device
Initially, the control set of conductance measurement was calculated by
measuring the electrical variation of bare chip. The real-time changeable conductance
was observing in all experimental preparation setup. First, the microfluidic channel
was filled with 10 mM pH 7 phosphate buffers and kept the buffer flowing. The
conductance value won’t change too much if we don’t do any action. When the
17
between two buffer solutions. These results show it didn’t change obviously because
we just change the same solution to test whether the device is stable after the bubble
pass through. Then, we injected 100 pM CA 16, the signal didn’t change obviously
after the bubble peak passed because of no immobilization on nanowire device. After
CA 16 DNA sample was injected, washed the microfluidic channel by pH 7 buffer
before next sample. Then, we switched EV 71 DNA sample, the signal still be kept in
baseline. Finally, we washed the channel by pH 7 buffer solution to clean the
microfluidic channel, the signal still be kept in baseline at last. Those overall results
show that the conductance electrical signal won’t change obviously without
functionalizing nanowire device surface (Figure 11).
3-3 Device characteristic verification in liquid phase
After surface modification on NWFET chips, and the electrical characteristic of
the device was tested. We want to know two main goals that the variation trend of the
most sensitive voltage point is also based on the sensing theory. First, we swept the
liquid gate voltage to check the electrical variation controlled by liquid and calculate
these data. The conductance value (red line) (Figure 12) will be increased as liquid
gate is increased and fitted the N-type device features. Then, differentiate the
18
divided by conductance values (G) to get sensitivity values (Sensitivity=Gm / G , Gm =
dG / dV). After those mathematic operations, we got the Vg value with maximum
variation rate at sub-threshold region. Both biosensing and pH sensing shall be
operated at fixed Vg value we calculated before. On the other side, we would check
whether the variation trend of the conductance signals fitted its doping type. In this
experiment, we applied N-type NWFET as sensing device, to observe the signal
changeably fitting N-type characteristic. When the buffer switched from pH 7 to pH 8,
it will have more negative ion than pH 7, to make N-type NWFET induced less
electrons passing through those channels. Reversibly, buffer solution switched from
pH 8 to pH 7, it has less negative ion than pH 8, to make N-type NWFET inducing
more electrons pass through those channels. The conductance value is directly relative
to the current of nanowire channels. As the results are shown in Figure 13, the
conductance value could reversibly change from different pH buffers fitting N-type
device characteristic.
3-4 Enterovirus 71 (EV 71) DNA Biosensing
After surface functional group modification and reaction with EV 71 DNA
probes (Shown as Figure 6), we measured the real-time conductance signals of
19
experiment, the probe DNA was designed 20 base long and amino hexyl was modified
at 5’-end with complementary DNA strand as target DNA but no modified at both
ends.
In addition, we design a CA16 as a negative control to confirm the probe DNA of
specifically binding to its’ complementary DNA. All samples were diluted by
phosphate buffer (10 mM, pH 7.0) and we regard the buffer condition as baseline in
the experiment. First, we would make a bubble to generate a signal pulse observing
whether the baseline shift or not. So as to the other pulses when we switching to
another samples, the bubble means to signal income. Second, it will be injected 10000
times concentration negative control (CA 16) than positive sample (EV 71) to observe
whether the signal variation, then eluting the CA 16 with phosphate buffer. Third,
inject the EV 71 1 fM into the channel to react with probe DNA. We can see those
conductance value of 1 fM EV 71 obviously changed than 100 pM CA 16 as shown in
Figure 14. Finally, we added 100 fM EV71 to check whether the reaction saturated,
compared with those conductance changed percents among control and experiment
data (Figure 15). As these results, the real-time conductance analysis method can
specifically identify both complementary DNA and non-complementary DNA. The
proposed measuring system has advantages like label-free, real-time and high
20
3-5 EV 71 DNA biosensing after hot water washed
After the EV 71 biosensing, we injected 10~15ml hot water (over 80 ℃) to
remove the hybridized DNA sequence (Tm: 51.8 ℃). Then, washed the microfluidic
channel by phosphate buffer (room temperature) and repeated previous process again.
First, we would sweep liquid gate to observe the conductance value still controlled by
liquid gate because we didn’t know how the hot water affected the device
characteristic. Secondly, got those data of conductance to liquid gate and calculate the
most sensitivity Vg point. Compared to Figure 9, the most sensitive Vg point shifted
to 1.65 V (Figure 16). We considered that (1) the device was decayed since the first
biosensing process (2) after the hot water washed the device surface suffered damage.
However, we followed up previous process to do biosensing again. In the beginning,
the baseline was rised up continuously, even we injected CA 16 (control set) DNA
sample. But the conductance value will be decreased obviously when EV 71
(experiment set) injected. We got the same response even though the baseline was not
as flat as these previous results. We can say that the conductance signal could truly
reflected bio-reaction on device surface (Figure 17).
3-6 CA 16 DNA Biosensing
21
CA16 DNA probe and detecting complementary CA 16 target sequence. The EV 71
DNA strand became control set in the experimental design. According to the same
previous process to sweep the Vg, the most sensitive Vg point was calculated as
shown in Figure 18. We got the Vg value about 1.03 V and started biosensing by the
fixed Vg value. In the beginning of CA 16 biosensing, we injected 100 pM EV 71
DNA sample as control set, and the conductance value still be kept on baseline. Then,
injected 1fM CA 16 and the conductance value didn’t shift obviously. As injected 100
fM CA 16, the conductance value shifted down slowly. A little difference from EV 71
biosensing results, the conductance value would rise when we injected pH 7 PBS
buffer to wash the channel. Similarly, we injected higher concentration of CA 16. It
can obtain more variation than lower concentration samples, but still be recovered
when buffer injected (Figure 19). After biosensing, we compared those different
concentrations of CA 16 samples and control set (Figure 20), it was revealed the
variation rate directly proportional to concentration. Finally, we proposed that the
reason of the conductance value reversed when buffer injected. The distortion of
microfluidic PDMS may change the streaming potential, to cause the hybridized DNA
flushed by buffer. The higher concentration of CA 16 samples still be reacted with
immobilized DNA probes. It still performed high specificity of biosensing because it
22
IV.
Summary and perspective
In our research, we have demonstrated the poly crystalline silicon NWFET could be developed as a highly sensitive, specific and label-free biosensor to detect
EV71 and CA16 nucleic acid in a real-time kinetic measurement system. The device
yield is not yet as good as commercial products, we still provide a standard operation
process to pick up good device for biosensing. By the lock-in detection and sample
transport system, we could filter out a lot of noise to extract conductance signal. It
helped us measuring bio-reaction at steady state. Not only apply on rapid diagnosis
but also be suitable to investigate the molecular bio-reaction. Furthermore, the poly
crystalline silicon NWFET fabrication process is compatible to modern
semiconductor technology in Taiwan. It could be mass production for many
applications. Therefore, the poly crystalline silicon NWFET could provide a great
potential for real-time, label-free and highly sensitive molecular diagnostics or other
23
V.
Reference
1. 行政院衛生署疾病管制局. “腸病毒感染併發重症(含非小兒麻痺病毒
之腸病毒感染症)”, 2007, [cited; Available
from: http://www.cdc.gov.tw/index_info_info.asp?data_id=1007. 2. Huang, K.Y. and Lin, T.Y. “Enterovirus 71 infection and prevention”,
Taiwan Epidemiology Bulletin, 2008, p. 415-426
3. Lin T.Y. et al. “The 1998 enterovirus 71 outbreak in Taiwan:
Pathogenesis and management”, Clinical Infectious Diseases, 2002, 34,
p. S52-S57.
4. King, A.M. et al. “Family Picornaviridae. In Virus Taxonomy., in
Seventh Report of the International Committee on Taxonomy of Viruses”, San Diego: Academic Press., 2000, p. 657-678.
5. Lin, T.Y. et al. “Enterovirus 71 outbreaks, Taiwan: occurrence and
recognition”, Emerging Infectious Diseases, 2003, 9(3): p. 291-293.
6. Wang, S.F. “An epidemiological analysis of enterovirus 71: Taiwan,
1998-2004”, Taiwan Epidemiology Bulletin, 2005, p. 125-153.
7. Wu, H.S. et al. “Update on the Molecular Epidemiology of Human
Enterovirus 71 in Taiwan Since 1998”, International Journal of Infectious Diseases, 2008, Vol. 12 (Supplement 1).
8. Chang, L.Y. et al. “Comparison of enterovirus 71 and coxsackie-virus
A16 clinical illnesses during the Taiwan enterovirus epidemic, 1998”, The pediatric infectious disease journal, 1999, 18(12): p. 1092-1096.
9. 行政院衛生署疾病管制局 “腸病毒感染併發重症臨床處理注意事項”,
24
10. 行政院衛生署疾病管制局 “傳染病防治工作手冊-腸病毒感染併發重
症”, 2008.
11. 行政院衛生署疾病管制局 “腸病毒感染防治手冊”, 2007.
12. Wu, Y. et al. “Single-crystal metallic nanowires and
metal/semiconductor nanowire heterostructures”, Nature, 2004,
430(6995): p. 61-65.
13. Schmidt, N.J. et al. “An apparently new enterovirus isolated from
patients with disease of the central nervous system”, The journal of infectious disease, 1974, 129(3): p. 304-309.
14. Deibel, R. et al. “Isolation of a new enterovirus” Proceedings of the
Society for Experimental Biology and Medicine, 1975. 148(1): p.
203-207.
15. Blomberg, J. et al. “New enterovirus type associated with epidemic of
aseptic meningitis and-or hand, foot, and mouth disease” Lancet, 1974,
13(2): p. 112.
16. Tagaya, I. and Tachibana, K. “Epidemic of hand, foot and mouth
disease in Japan, 1972-1973: difference in epidemiologic and virologic features from the previous one”, Japanese journal of medical science & biology, 1975, 28(4): p. 231-234.
17. Gilbert, G.L. et al. “Outbreak of enterovirus 71 infection in Victoria,
Australia, with a high incidence of neurologic involvement”, Pediatric Infectious Disease Journal, 1988, 7(7): p. 484-488.
18. Shindarov, L.M. et al. “Epidemiological, clinical and
pathomorphological characteristics of epidemic poliomyelitis-like disease caused by enterovirus 71”, Journal of Hygiene Epidemiology Microbiology and Immunology, 1979, 23(3): p. 284-295.
25
19. Nagy, G. et al. “Virological diagnosis of enterovirus type 71 infections:
experiences gained during an epidemic of acute CNS diseases in Hungary in 1978”, Archives of Virology, 1982, 71(3): p. 217-227.
20. World Health Organization (WHO) “Outbreak of hand, foot and
mouth disease in Sarawak. Cluster of deaths among infants and young children”, Weekly epidemiological record, 1997, 72, p. 211-212.
21. Ho, M.T. et al. “An epidemic of enterovirus 71 infection in Taiwan”,
New England Journal of Medicine, 1999, 341(13): p. 929-935.
22. World Health Organization (WHO) “Enterovirus - non polio”, 2002 [cited; Available
from: http://www.who.int/mediacentre/factsheets/fs174/en/index.html
.
23. Shih, S.R. et al. “Genetic analysis of enterovirus 71 isolated from fatal
and non-fatal cases of hand, foot and mouth disease during an epidemic in Taiwan, 1998”, Virus Research, 2000, 68(2): p. 127-136.
24. Rigonan, A.S. et al. “Use of monoclonal antibodies to identify serotypes
of enterovirus isolates”, Journal of Clinical Microbiology, 1998, 36(7):
p. 1877-1881.
25. Manzara, S. et al. “Molecular identification and typing of
enteroviruses isolated from clinical specimens”, Journal of Clinical Microbiology, 2002, 40(12): p. 4554-4560.
26. Chen, T.C. et al. “Combining multiplex reverse transcription-PCR and
a diagnostic microarray to detect and differentiate enterovirus 71 and coxsackievirus A16”, Journal of Clinical Microbiology, 2006, 44(6): p.
2212-2219.
26
from an outbreak in Taiwan and rapid identification of enterovirus 71 and coxsackievirus A16 by RT-PCR”, Journal of Medical Virology,
2001, 65(2): p. 331-339.
28. Lipson, S.M. et al. “Detection of precytopathic effect of enteroviruses
in clinical specimens by centrifugation-enhanced antigen detection”, Journal of Clinical Microbiology, 2001, 39(8): p. 2755-2759.
29. Guney, C. et al. “Laboratory diagnosis of enteroviral infections of the
central nervous system by using a nested RT-polymerase chain reaction (PCR) assay”, Diagnostic Microbiology and Infectious Disease, 2003,
47(4): p. 557-562.
30. Wang, S.Y. et al. “Early and rapid detection of enterovirus 71 infection
by IgM-capture ELISA”, Journal of Virological Methods, 2004, 119(1):
p. 37-43.
31. Lim, K.A. and Benyeshmelnick, M. “Typing of viruses by
combinations od antiserum pools- application to typing of enteroviruses (Coxsackie and Echo)”, Journal of Immunology, 1960, 84(3): p.
309-317.
32. Tsao, K.C. et al. “Use of molecular assay in diagnosis of hand, foot
and mouth disease caused by enterovirus 71 or coxsackievirus A 16”, Journal of Virological Methods, 2002, 102(1-2): p. 9-14.
33. Hu, J.T. et al. “Controlled growth and electrical properties of
heterojunctions of carbon nanotubes and silicon nanowires”, Nature,
1999, 399, p. 48-51.
34. Cui, Y. and Lieber, C.M. “Functional nanoscale electronic devices
assembled using silicon nanowire building blocks”, Science, 2001,
27
35. Cui, Y. et al. “Nanowire nanosensors for highly sensitive and selective
detection of biological and chemical species”, Science, 2001, 293(5533):
p. 1289-1292.
36. Hahm, J. and Lieber, C.M. “Direct ultrasensitive electrical detection of
DNA and DNA sequence variations using nanowire nanosensors”, Nano Letters, 2004, 4(1): p. 51-54.
37. Patolsky, F. et al. “Electrical detection of single viruses”, Proceedings
of the National Academy of Sciences of the United States of America,
2004, 101(39): p. 14017-14022.
38. Zheng, G.F. et al. “Multiplexed electrical detection of cancer markers
with nanowire sensor arrays”, Nature Biotechnology, 2005, 23(10): p.
1294-1301.
39. Patolsky, F. et al. “Detection, stimulation, and inhibition of neuronal
signals with high-density nanowire transistor arrays”, Science, 2006,
313(5790): p. 1100-1104.
40. Chen, Y. et al. “Silicon-based nanoelectronic field-effect pH sensor
with local gate control” Applied Physics Letters, 2006, 89(22): p.
223512-223512-3.
41. Lud, S.Q. et al. “Field effect of screened charges: Electrical detection
of peptides and proteins by a thin-film resistor”, Chemphyschem, 2006,
7(2): p. 379-384.
42. Stern, E. et al. “Label-free immunodetection with CMOS-compatible
semiconducting nanowires”, Nature, 2007, 445(7127): p. 519-522.
43. Wong, S.S. et al. “Covalently functionalized nanotubes as
nanometre-sized probes in chemistry and biology”, Nature, 1998,
28
44. Campagnolo, C. et al. “Real-Time, label-free monitorine, of tumor
antigen and serum antibody interactions”, Journal of Biochemical and Biophysical Methods, 2004, 61(3): p. 283-298.
45. Wu, G.H. et al. “Bioassay of prostate-specific antigen (PSA) using
microcantilevers”, Nature Biotechnology, 2001, 19(9): p. 856-860.
46. Ogi, H. et al. “High-frequency wireless and electrodeless quartz crystal
microbalance developed as immunosensor”, Japanese Journal of Applied Physics Part 1-Regular Papers Brief Communications & Review Papers, 2007, 46(7B): p. 4693-4697.
47. Michalet, X. et al. “Quantum dots for live cells, in vivo imaging, and
diagnostics”, Science, 2005, 307(5709): p. 538-544.
48. Zhang, Y.C. and Heller, A. “Reduction of the nonspecific binding of a
target antibody and of its enzyme-labeled detection probe enabling electrochemical immunoassay of an antibody through the 7 pg/mL-100 ng/mL (40fM-400pM) range”, Analytical Chemistry, 2005, 77(23): p.
7758-7762.
49. Shih, S.R. et al. “Serotype-specific detection of enterovirus 71 in
clinical specimens by DNA microchip array”, Journal of Virological Methods, 2003, 111(1): p. 55-60.
50. Hsiao, C.Y. et al. “Novel poly-silicon nanowire field effect transistor
for biosensing application”, Biosensors & Bioelectronics, 2009, p.
1223-1229.
51. Lin, H.C. et al. “A simple and low-cost method to fabricate TFTs with
poly-Si nanowire channel”, IEEE Electron Device Letters, 2005, 26(9):
p. 643-645.
29
enhanced by metal-induced lateral crystallization”, IEEE Electron Device Letters, 2006, 27(7): p. 582-584.
53. Lin, C.H. et al. “Ultrasensitive detection of dopamine using a
polysilicon nanowire field-effect transistor”, Chemical Communications, 2008, 44, p. 5749-5751.
54. Lin, H.C. et al. “Water passivation effect on polycrystalline silicon
nanowires”, Applied Physics Letters, 2007, 91(20): p. 202113.
55. Su, C.J. et al. “Operations of poly-Si nanowire thin-film transistors
with a multiple-gated configuration”, Nanotechnology, 2007, 18, p.
215205
56. Li, Z. et al. “Sequence-specific label-free DNA sensors based on silicon
nanowires”, Nano Letters, 2004, 4(2): p. 245-247.
57. Lin, C.H. et al. “Poly-silicon nanowire field-effect transistor for
ultrasensitive and label-free detection of pathogenic avian influenza DNA”, Biosensors & Bioelectronics, 2009, 24(10): p. 3019-3024.
58. Jensen, K.K. et al. “Kinetics for hybridization of peptide nucleic acids
(PNA) with DNA and RNA studied with the BIAcore technique”, Biochemistry, 1997, 36, p. 5072-5077.
59. Hook, F. et al. “Characterization of PNA and DNA immobilization and
subsequent hybridization with DNA using acoustic-shear-wave attenuation measurements”, Langmuir, 2001, 17, p. 8305-8312.
60. Hahm, J.I. and Lieber, C.M. “Direct ultrasensitive electrical detection
of DNA and DNA sequence variations using nanowire nanosensors”, Nano Letters, 2004, 4(1), p. 51-54.
30
Tables
Tab le 1
Enterovirus were classified based on their genomic sequences
Classified Serotypes Human enterovirus A
(HEV-A)
Coxsackie virus A2-8, 10, 12, 14, 16 Enterovirus 71, 76, 89-92 Human enterovirus B (HEV-B) Coxsackie virus A9 Coxsackie virus B1-6 Echovirus 1-7, 9, 11-21, 24-27, 29-33 Enterovirus 69, 73-75, 77-88, 93, 97-98, 100-101 Human enterovirus C (HEV-C)
Coxsackie virus A1, 11(15), 13(18), 17, 19-22, 24 Enterovirus 95-96, 99, 102 Poliovirus 1-3 Human enterovirus D (HEV-D) Enterovirus 68, 70, 94 New (unclassified)
31
Tab le 2
The common disease related enterovirus serotypes[11].
Common diseases Virus serotype
hand-foot-mouth disease (HFMD) Coxsackievirus group A16 (CA16), CA4, 5, 9, 10, CB2, 5, EV71
Herpangina CA 1-10, CA16, CA22, EV71
Pleurodynia Coxsackievirus group B (CB)
Acute myocarditis and pericarditis CB Acute meningitis and encephalitis CA10
Aseptic meningitis and encephalitis Coxsackievirus, poliovirus, echovirus, EV71
32
Tab le 3
Proposed pathogenesis of severe Enterovirus 71 infections [3]
Stage Syndrome Underlying cause
1 Hand-foot-and-mouth disease (HFMD)/ herpangina
-
2 Encephalomyelitis Direct invasion or viremia 3 Cardiopulmonary failure A: Hypertension B: Hypotension Neurogenic inflammatory response 4 Convalescence -
33
Tab le 4
Historical perspective and case incidences of Enterovirus 71 in worldwide.
Year Description
1969 First isolated in California 1972 Melbourne, Australia 1974 Sweden
1973 Japan
1975 Bulgaria with 44 deaths 1978 Hungary with 45 deaths
Japan 1985 Hong Kong 1986 Nan-ao, Taiwan
1997 Malaysia with at least 30 deaths 1998 Taiwan with 78 deaths
2000 Taiwan with 25 deaths 2001 Taiwan with 26 deaths
34
Table 5
The detection limit of all kinds of novel sensors.
Transducers Target Sensitivity SPR[44] Tumor antigen 10-100 pg/ml Microcantilever [45] PSA 0.2 ng/ml
QCM[46] Human-IgG 100 pg/ml
Electrode [48] IgG 7 pg/ml
35
Tab le 6
36
Tab le 7
37
Figures
38
Figure 2 Epidemic situation of Enterovirus infection with severe complications in
39
Figure 3 The distribution of serotypes of virus isolation from severe fatal case,
40
41
Figure 5 Schematic diagram of microfluidic channel for the biosensing with Si NW
42
43
44
45 Dry Test (Id-Vg)
Wet Test Get a whole wafer
Wafer Division
Good Poor properties
Acetone wash and N2gun drying Storage in vacuum
or N2chamber
Id-Vg Id-time Conductance-time Unpack
Immobilization & Biosensing
46
Figure 10-A N-type poly-Si NWFET measurement in dry air Vsd= 0.5V , Vgd
47
Figure 10-B The same data as Fig. 1A but in form of log scale plot. Its’ drain
48
49
Figure 12 Conductance vs. Liquid gate plot accompany with the sensitivity
50
51
Figure 14 Real-time biosensing process of EV 71 (phosphate buffer elution between
52
Figure 15 Compare the conductance variation rate between 10 pM CA 16 (negative
53
Figure 16 Conductance vs. Liquid gate plot accompany with the sensitivity factor
54
55
56
Figure 19 CA 16 Biosensing Process, the conductance value would reverse after pH
57