國
立
交
通
大
學
奈米科技研究所
碩
士
論
文
奈米表面影響
NIH 3T3 細胞之貼附並誘發細胞自然凋
亡
Nanotopography reduces cell adhesion and induces
apoptosis for NIH 3T3 cells
研 究 生:蘇嘉偉
學 號:9452501
指導教授:黃國華 副教授
Nanotopography reduces cell adhesion and induces
apoptosis for NIH 3T3 cells
Student: Chia-wei Su Advisors:Dr. Guewha Steven Huang
Institute of Nanotechnology
National Chiao Tung University
Abstract
Mouse fibroblast NIH 3T3 cells were grown on nanodot arrays to investigate cellular response to nanolandscape. The nanodot arrays consisted of nanodots with diameters ranging from 10 to 200 nm which were fabricated by anodic aluminum oxide (AAO) processing on TaN-coated wafers. Cells seeded on flat wafer surface and on 10 nm nanodot array showed normal morphology and well attachment by SEM. But the cells cultured on arrays with dot size larger than 50 nm appeared abnormal morphology and stuck out from substratum. The fluorescent images presented these cells had poorly developed microfilament and fewer focal adhesions. Their caspase-3 activities, a key role in apoptosis pathway, are higher than those grown on smaller than 50 nm nanodot arrays. Coating of fibronectin (FN) or type I collagen prevented the nanotopography-induced programmed cell death. The nanotopography-induced apoptosis can be overridden by forced cellular attachment. Nanotopography disturbs development of cytoskeleton and induces abnormal morphology.
奈米表面影響
NIH 3T3 細胞之貼附並誘發細胞自然凋亡
研究生:蘇嘉偉 指導教授:黃國華 副教授
國立交通大學
奈米科技研究所
中文摘要
我們將老鼠胚胎纖維細胞 NIH 3T3 培養於奈米點陣列表面上,以研究其對奈米尺度的 反應。奈米點陣列以陽極氧化鋁為模板,製造於鍍上TaN 的矽晶圓上,其直徑分布介於 10 到 200 nm 之間。在 SEM 的觀察中,生長於平坦以及 10 nm 表面的細胞顯示出正常 的形貌與良好的貼附。生長於超過50 nm 奈米點陣列上的細胞卻表現出不正常的形貌, 並有部份隆起未與底層粘著。螢光標定照片也顯示出這些細胞的微細絲發展較不健全, 且具有較少量的附著點。我們懷疑這些細胞會因與大尺度的奈米表面貼附不良而產生自 然凋亡。在自然凋亡的過程中扮演重要角色的caspase-3,其活性在生長於超過 50 nm 奈 米點陣列上的細胞之表現遠大於生長在小於50 nm 表面上的細胞。若以細胞外基質的 成分---collagen 和 fibronectin---修飾過的表面可幫助異常的細胞更平坦的貼附於底層 上。這些細胞可藉由被幫助貼附而免於自然凋亡。奈米表面會干擾細胞骨架的發展並引 起細胞不正常的形貌。誌 謝
時間的魔力,來自於它流動的不知不覺。打著字,才猛然想起這已是我
在交通大學第六個年頭了。憶起初來報到時仍只是個小毛頭,剛離開高中
對這間聞名遐邇的大學充滿著憧憬。如今,我已經在這裡學到了專業知識
與待人處世的道理,像隻剛成熟的幼鳥,迫不及待想飛出鳥巢,向大千世
界展現父母所賜予美麗的羽翼。而這一切首先要感謝的,是我的指導老師
黃國華 教授。老師總是鼓勵我們多與他討論實驗的想法與結果,不論多
晚,都不吝提供想法與我們一起奮戰到底。也謝謝老師每每聽完我們不成
熟的報告後,都會以他豐富的經驗與耐心提點我們不足的地方並期許我們
更加精進。另一位要鄭重致謝的是師母。師母知道實驗室裡大部分學生都
是離開家特來此求學,不但常送些零食點心來,怕我們這群愛吃鬼餓著;
有時更會親手下廚煮出好吃的牛肉燴飯、臘味飯、南瓜米粉…等等想到就
讓人流口水的佳餚讓我們飽餐一頓。此外,由於擔心我們只顧著做實驗,
每次都千叮萬囑我們要記得運動與睡眠正常。這些叮嚀雖瑣碎,但我們都
了解這才是"雄感心"的關懷。
能走到這一步,學長的幫忙與同儕間互相打氣對我來說是很大的助力。
所以我要謝謝耀楠、凱明、孟德、昱勳、英儒、昇成、維揚學長與士纹學
姐這些日子來的照顧,特別是耀楠、凱明、維揚學長與士纹學姐耐心地教
導完全是生物外行的我細胞培養技術,耀楠與凱明學長更是屢屢在我遇到
實驗難關時,給予深具建設性的建議。此外也要對柯博實驗室的佳典學長
不吝指導我奈米製作技術深深的感謝。志杰、永昌、禮閣很高興能與你們
成為同學,兩年光陰快的讓人不捨,工一
102 室有我們一起努力留下的汗
水與分享實驗成果的歡笑,大家之後一定還要保持聯絡。高超、新堯還有
祥溢學弟進來實驗室後的成長有目共睹,我相信實驗室有你們在,未來的
成果是相當讓人期待的,希望你們繼續努力!Nature 和 Science 就靠你們
了!
最後一定要感謝我的家人。爸、媽, 謝謝你們對我忙於實驗無法常回家,
總是給予最大的支持。在這裡我想說,你們在我心目中是最偉大的!此外
感謝我的女朋友支持我專心投注於實驗並包容我的缺點。寫到這裡才發
現,兩年時間感覺雖然短促,但其間受過的幫助還真不少,非常惋惜無法
一一地向所有人表達我的感謝之意,因此我要對所有關心我的人承諾,接
下來我會繼續努力,不枉費你們對我的期待,謝謝你們!
Contents
Abstract ...i
中文摘要...ii
誌 謝...iii
Contents... v
List of Figures ...vii
Chapter 1 ... 1
Introduction ... 1
1.1 Motivation ... 1
1.2 Nanotopograpy and cellular response ... 2
1.3 Cytoskeleton and focal adhesions... 8
1.3.1 Actin filaments ... 9
1.3.2 Effect of cytochalasin D... 10
1.3.3 Focal adhesion... 11
1.3.4 Function and elements of ECM... 12
1.4 Apoptosis ... 14
1.4.1 Characterization ... 14
1.4.2 caspase family ... 16
1.4.3 Singnaling cell survival ... 17
1.4.4 Anoikis ... 18
Chapter 2 ... 20
Experimental Methods ... 20
2.1 Experimental design ... 20
2.2 Chemical reagents ... 22
2.3 Fabrication of nanodot arrays... 23
2.4 Cell culture ... 24
2.5 Scanning electron microscopy of cell morphology ... 24
2.6 Measurement of contact angles ... 25
2.7 Immunofluorescence and cytoskeletal observation ... 25
2.8 Coating of proteins and Cytochalasin D treatment ... 26
2.9 Caspase-3 activity assay ... 27
2.10 Statistics of percentage apoptotic cell ... 27
Chapter 3 ... 28
Results and Discussions... 28
3.1 Nanodot arrays ... 28
3.2 Cellular response to nanodot arrays ... 31
3.2.3 Nanotopography affected formation of filopodia ... 34
3.2.4 Side-view image of cellular attachment ... 36
3.2.5 Immunofluorescent image of cytoskeleton ... 38
3.3 Surface modification and Cytochalasin D treatment ... 40
3.4 Caspase-3 activity assay ... 43
3.5 Statistics for percentage of apoptotic cell ... 44
Chapter 4 ... 47
Conclusions ... 47
4.1 conclusions... 47
4.2 future works ... 49
List of Figures
Figure1. 1 Cells stained for actin, vinculin, and the nucleus and cultured on nanostructures....3
Figure1. 2 SEM images of cells cultured on patterned substrates...3
Figure1. 3 (A) SEM and (B) AFM image of a glass coverslip coated with nanofibers. ...4
Figure1. 4 A comparison of the F-actin network, focal adhesion components, and fibronectin organization for NIH 3T3 fibroblasts cultured on glass and nanofibers.. ...5
Figure1. 5 (A) Atomic force microscopical images of 35 nm high islands. (B) Generalised cell responses to changes in island size ...7
Figure1. 6 Fluorescent images of HGTFN cytoskeletons on control and test materials. ...7
Figure1. 7 SEM image of tantalum oxide nanodots arrays . ...8
Figure1. 8 Assembly of actin filaments...10
Figure1. 9 Junctions between cells and the extracellular matrix... 11
Figure1. 10 Structure of collagen and fibronectin...13
Figure1. 11 Aptptosis (A) Light micrographs of normal (left) and apoptotic (right) human leukemia cells, illustrating chromatin condensation and nuclear fragmentation during apoptosis. (B) Diagrammatic representation of the events of apoptosis. ...15
Figure1. 12 Regulators and effectors of apoptosis. ...17
Figure1. 13 The PI 3-kinase pathway and cell survival. ...18
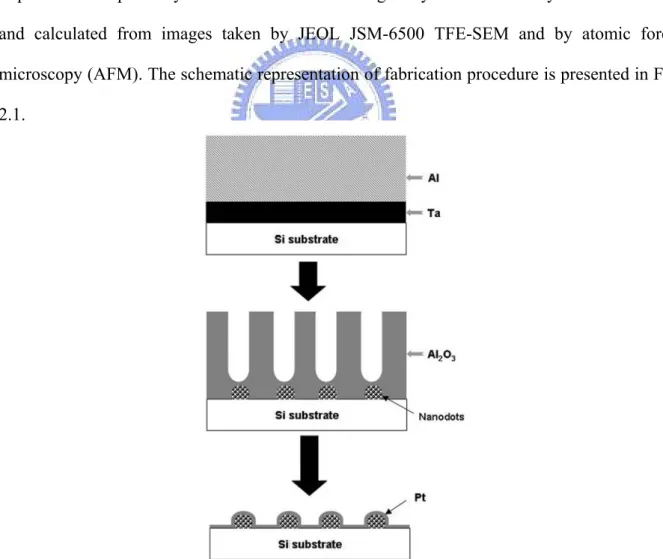
Figure 2. 1 The schematic representation of fabrication procedure. ...23
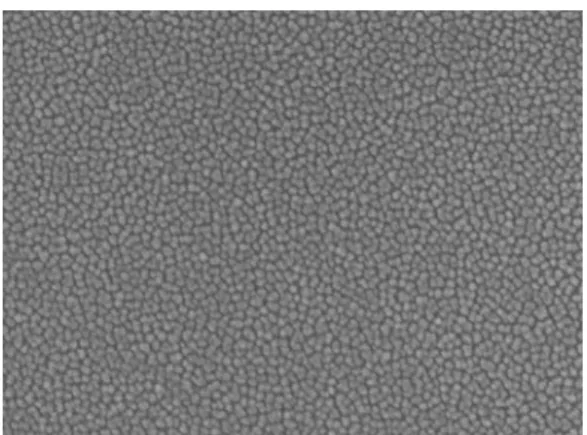
Figure 3. 1 SEM images of the fabricated nanodot arrays.. ...29
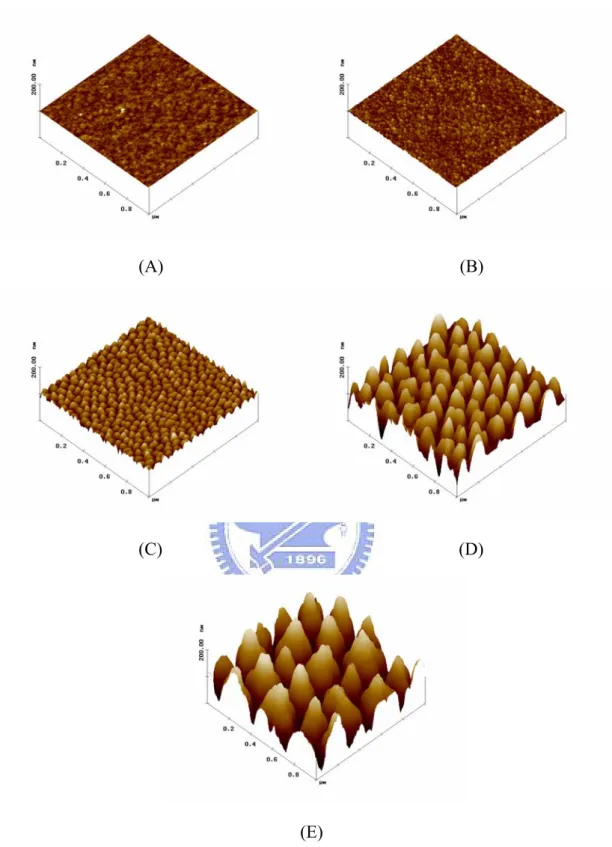
Figure 3. 2 AFM images of the fabricated nanodot arrays.. ...30
Figure 3. 3 SEM images of cells seeded on nanodot arrays...32
Figure 3. 4 Side-view image of cellular morphologies. ...33
Figure 3. 5 Contact angle measurements for the nanodot arrays. Contact angles were measured for (A) untreated nanodot arrays (B) and BSA-treated nanodot arrays. ...34
Figure 3. 6 SEM images of NIH-3T3 cells cultured on nanodot arrays to show filopodia extended from cells...35
Figure 3. 7 The adhesion sites of cells cultured on (A) flat wafer. (B) 10 nm (Due to the limitation of cross-section view, 10-nm nanodots couldn’t be viewed.) (C) 50 nm (D) 100 nm (E) 200 nm...37
Figure 3. 8 Cells were seeded on nanotopography and cultured for 96 hrs before harvest. The columns are side-view of cellular attachment, actin filaments, and vinculin, respectively...39
Figure 3. 9 Statistics for (A) the number of abnormal cells per picture and (B) the amount of focal adhesions per cell. ...40
Figure 3. 10 Effects of (B) BSA-, (C) FN-, and (D) type I collagen- coating on the nanotopography-induced apoptosis. (A) untreated and (E) Cyto D-treated cells were also presented here...42
surface and treated with Cyto D.. ...44 Figure 3. 12 Percentage of cells with abnormal morphology calculated from SEM images.. .45 Figure 3. 13 Effects of cytochalasin D to nanotopography-induced apoptosis.. ...46
List of Tables
Table 2. 1 Experimental design ...21 Table 2. 2 chemical reagents...22 Table 2. 3 culture protocol...24
Chapter 1
Introduction
1.1 Motivation
Since a long time ago, scientists have great interests about the interaction between cells and the underlying ligands such as extracellular matrix. They have found that topography of micrometric scale could affect cellular gene expression, adhesion, migration, proliferation, and differentiation. Nowadays relying on progressive nanotechnology, numerous nanostructures have been developed and applied to the field of cell research. It’s believed that nanostructure is more close to the actual scale of the ligands interacted with cells.
Here we proposed to study cellular responds to nanotopography with different feature sizes and to analyze the differences in physical expressions of cells. The highly packed and uniformly distributed nanodot arrays with defined diameter and depth were fabricated by using aluminum nanopores as a template during oxidation of tantalum thin film [1]. The controllable pore size of aluminum oxide served as a convenient mold to fabricate tantalum into nanodot array of defined diameter. The 2D structure containing nanodots of uniform size have served as a defined nanolandscape to investigate cellular response to topological variation. NIH 3T3 cells were seeded on flat wafer surface and on 10, 50, 100, 200-nm nanodot arrays. Cellular morphologies were observed on the cells by SEM. We have inspected actin filaments and focal adhesions by fluorescent microscopy. Caspase-3 activity was measured to further confirm our observation. We also coated fibronectin (FN), type I collagen and BSA to figure out the results of cells grow on modified nanotopography.
Our results indicated that cells grown on 100- and 200-nm nanodot arrays showed abnormal morphologies, poorly developed cytoskeleton and reduced adhesion. Furthermore the activities of caspase-3 enlarged with cells grown on the larger nanodot arrays. The findings gave us a clue to figure out the relationship with cells and surrounding environment.
1.2 Nanotopograpy and cellular response
The topology and chemistry of the substrate was proofed to be relevant to the cell–substrate interactions [2-5]. During the last decade, the micro- and nanotechnology fields have been matured rapidly, resulting in the production of varied kinds of nanostructures. Scientists have developed nanostructures with different shape and tried to apply to life sciences.
Nealey and coworkers have created silicon substrata with grooves and ridges having pitch dimensions of 400-4000 nm using X-ray lithography. They have investigated the strength of cell-substratum adhesion on nanoscale topographic features of a similar scale to that of the native basement membrane. When human corneal epithelial cells (SV40-HCECs) cultured on ridges and grooves of nanoscale dimensions, cells migrated more extensively to the ridges than into the grooves. Cell shape was aligned and extended in the direction of the grooves, but the percentage of aligned cells was only increased with groove depth. Figure 1.1 presented that actin filaments and focal adhesions were aligned along the substrate topographies, too [6, 7].
In the latest paper published in 2006, this group found cells aligned preferentially in the direction perpendicular to nanoscale grooves and ridges in Epilife medium (Figure 1.2). This is in contrast to a previous study where cells cultured in DMEM/F12 medium with 10% FBS aligned in the direction parallel to nanoscale topographic features [6, 7]. Cells switched from perpendicular to parallel alignment when the pitch was increased from 400 to 4000 nm. There was a transition region (between 800 and 1600nm pitch) where both parallel and perpendicular alignments were favored compared to all other cellular orientations. Cells formed focal adhesions parallel to the substrate topographies in this transition region. On the nano- and microscale patterns, 400 and 4000nm pitch, focal adhesions were almost exclusively oriented obliquely to the topographic patterns [8].
Figure1. 1 Cells stained for actin (red), vinculin (green) and the nucleus (blue) and cultured on (A) 600 nm deep grooves and 70 nm wide ridges on a 400 nm pitch. (B) 600 nm deep grooves and 1900 nm ridges on a 4000 nm pitch. A reflection image of the substrates is included in the figure insets. (C) a smooth silicon oxide substrate [7].
Figure1. 2 SEM images of cells cultured on patterned substrates. (A) Perpendicularly aligned cell on 70nm wide ridges on a 400nm pitch. (B) Detail of previous cell. Filopodia were aligned perpendicularly to the patterns. (C) Parallel aligned cell on 1900nm ridges on a 4000nm pitch. (D) Filopodia were guided by the topographic pattern [8].
Meiners and coworkers have designed a synthetic nanofibrillar matrix that more accurately models the porosity and fibrillar geometry of cell attachment surfaces in tissues. The synthetic nanofibrillar matrices were composed of nanofibers prepared by electrospinning a polymer solution of polyamide onto glass coverslips (Figure 1.3). Scanning electron and atomic force microscopy showed that the nanofibers were organized into fibrillar networks reminiscent of the architecture of basement membrane, a structurally compact form of the extracellular matrix (ECM). They have inspected F-actin, vinculin, FAK (focal adhesion components), and fibronectin organization for NIH 3T3 fibroblasts (Figure 1.4) and found their morphology and characteristics displaying the counterparts in vivo. Normal rat kidney (NRK) cells and breast epithelial cells also showed similar result. Hence the synthetic nanofibrillar matrix could act as a physically and chemically stable three-dimensional surface for ex vivo growth of cells [9].
(A) (B)
Figure1. 4 A comparison of the F-actin network, focal adhesion components, and fibronectin organization for NIH 3T3 fibroblasts cultured on glass and nanofibers. Fluorescent image of phalloidin-Alexa Fluor staining on glass (A) and nanofibers (B). Indirect immunofluorescence of fibroblasts on glass (C,E,G) and nanofibers (D,F,H) stained with vinculin (C,D), FAK PY397 (E,F), and fibronectin (G,H) antibodies. Scale bar, 10 mm [9].
Dalby and coworkers have used polymer demixing of polystyrene and poly (4-bromostyrene) producing nanometrically high islands, and observed endothelial cell response to the islands (Figure 1.5A). They have proposed three island heights for investigation: 13, 35 and 95nm. For the two controls, PBrS and PS, the cells gave a significantly more spread morphology on the PBrS, possibly due to its more hydrophilic chemistry. A morphological feature common on the nanoislands was the arcuate, or curved, cell shapes. They supposed that the regular nanometric topography produced by the test
substrates might provide cues similar to those given by collagen, resulting in the cells having a more natural phenotype in vitro than is achieved on flat culture dishes. The SEM results also have shown many of the cells being seen to have filopodia in contact with the islands in preference to the dip. Observation of the actin cytoskeleton showed that the 13nm substrate was accelerating cell spreading. While tubulin cytoskeleton was seen to be well formed in cells on all the materials, it could be seen to be aligning around arcuate features on the nanotopography (Figure 1.6). In their conclusion, 13-nm-high islands produced highly spread cellular morphologies containing well-defined cytoskeleton, but larger islands produced a stepwise decrease in response [10].
The previous result made this group having great interest in the 13-nm-high islands. Thus they employed include scanning electron microscopy, fluorescent microscopy, and 1718 gene microarray to investigate cell response to 13-nm-high islands. In this study, the most worthy to discuss is gene microarray. They picked many genes relevant to cytoskeleton, extracellular matrix, cell replication and signaling. The genes involved in cell signaling and proteins of ECM modeling were upregulated. Rho, Rac, and Ras genes, the proteins which are involved in cell shape, production of filopodia and lamelapodia, and movement, were up-regulated, too. Other growth hormones, ion channels, and receptor gene up-regulations were also noted. These observations indicate that increased cell attachment and spreading is required for up-regulation proliferation and matrix synthesis [11]. In their review paper published in 2004, they made a statistics (Figure 1.5B) of cell respond to polymer islands with different heights. Cells grown on 95-nm islands show reduced adhesion and cytoskeleton, but on 13-nm islands show the greatest respond in biological characterization [12].
(A) (B)
Figure1. 5 (A) Atomic force microscopical images of 35 nm high islands [10]. (B) Generalised cell responses to changes in island size [12].
Figure1. 6 Fluorescent images of HGTFN cytoskeletons on control and test materials. Bar=50 mm [10].
But there are still some problems for these nanostructures applying to biology. The limited resolution makes X-ray lithography unable to produce patterns with dimension under 50 nm. In addition, the method of X-ray lithography cost expensive and spend a lot of time. In a view of nanotopography, nanofibers can’t be well defined in their dimensions and shape. Although the nanostructure formed nanofibers is most similar to the environment for in vivo growth of cells. The homogeneity of polymer islands is low. The range of their diameters and heights distribute widely. To breakthrough previous study about cellular response to nanotopography, we selected nanodot arrays as the substrate which presented by Ko et al [1]. Benefiting from characteristic of anodic aluminum oxide (AAO), Ko have use AAO as template to fabricate nanodot arrays on silicon substrate. Nanodot arrays made by AAO template are highly packed, uniformly distributed and easy to control their size. So we can define a series of different size nanodots and study more completely what physical topography affect cells. Moreover this method is not only convenient but also has high yield.
Figure1. 7 SEM image of tantalum oxide nanodots arrays [1].
1.3 Cytoskeleton and focal adhesions
Cells always explore and react with environment by filopodia. Once they detected a proper site, focal adhesions would be formed and signals related to cellular differentiation would be transduced. Then the cells started to enter their life cycle [2]. The current study also suggests
that development of cytoskeleton would be influenced by nanotopography [10]. So we believed that actin filament and focal adhesion are important clues to figure out the cell-matrix interaction.
1.3.1 Actin filaments
Actin is the most major cytoskeletal protein of most cells and able to polymerize to from actin filaments-thin, flexible fibers with naoscale in diameter and microscale in length. Within the cell, actin filaments (also called “microfilaments”) are organized into high-order structures, forming bundles or three-dimensional networks with properties of semisolid gels. The assembly and disassembly of actin filaments are regulated by a variety of actin-binding protein, which are critical components of the actin cytoskeleton. The network formed by actin provides mechanical support, determines cell shape, and allows movement of the cell surface; thereby enabling cells to migrate, engulf particles, and divide.
Individual actin molecules are globular proteins 375 amino acids (43kd). Each actin monomer (globular G actin) has tight binding sites that mediate head-to-tail interactions with two other actin monomers, so actin monomers polymerize to form filaments (filamentous F actin). The first step in actin polymerization (called nucleation) is the formation of a small aggregate consisting of three actin monomers. Actin filaments are then able to grow by the reversible addition of monomers to both ends, but one end (the plus end) elongates five to ten times faster than the minus end. Because actin polymerization is reversible, filaments can depolymerizate by the dissociation of actin subunits, allowing actin filaments to be broken down when necessary. Thus an apparent equilibrium exists between actin monomers and filaments. Moreover the equilibrium is dependent on the concentration of free monomers [13].
(A)
(B)
Figure1. 8 Assembly of actin filaments. (A) Actin monomers (G actin) polymerize to form actin filaments (F actin). (B) The minus ends grow less rapidly than the plus ends of actin filaments. This difference in growth rate is reflected in a difference in the critical concentration for addition of monomers to the two ends of the filament [13].
1.3.2 Effect of cytochalasin D
Cytochalasin D is a well-characterized agent and cell-permeable fungal toxin which binds to the plus ends of actin filaments inhibiting both the association and dissociation of subunits [14]. This causes the disruption of actin filaments and inhibition of actin polymerization. Cytochalasin D alone induces a dose-dependent cytoskeletal collapse that causes apoptosis [15-18].
1.3.3 Focal adhesion
Most cells have specialized regions of the plasma membrane that form contacts with adjacent cells, tissue components, or substrates. These regions also serve as attachment sites for bundles of actin filaments that anchor the cytoskeleton to areas of cell contact. These discrete sites of attachment are called focal adhesions and particularly evident in fibroblasts maintained in tissue culture. Such cultured fibroblasts then attach to the culture dish via the binding of transmembrane proteins (called integrins) to the extracellular matrix. The associations, which are complex and not well understood, are mediate by several other proteins, including talin and vinculin. Vinculin is a prominent component of focal complexes and focal adhesions [19, 20]. Fig 1.9 shows the schematic of attachment of stress fibers to the plasma membrane at focal adhesions.
(A) (B)
Figure1. 9 Junctions between cells and the extracellular matrix. (A) Integrins mediate junction in which the cytoskeleton is linked to the ECM. B) Stress fiber s (bundles of actin filaments crosslinked by α-actinin) are then bound to the cytoplasmic domain of intergins by complex associations involving a number proteins. Two possible associations are illustrated: 1) talin binds to both intergin and vinculin, which in turn binds to actin, and 2) intergin binds to α-actinin [13].
1.3.4 Function and elements of ECM
In vivo, cells are immobilized within tissue, embedded in the diverse array of scaffoldings known as the extracellular matrix (ECM). The individual components of the ECM exist in the nanometer length scale and thus many tools from nanotechnology are appropriate to mimic their features. The ECM consists predominantly of interwoven protein fibers such as collagen or elastin that have 10–300 nm diameters. Extracted basement membranes imaged with electron microscopy show that its three-dimensional architecture consists of nanopores, roughly 70 nm in diameter, and intertwined fibrils that form a felt-like landscape with peaks and valleys that are approximately 100 nm in height and depth.The meshwork of ECM can be organized randomly or with semi-alignment, and the size of fibrils and pores differ, depending on the source tissue. It is now clear that cells detect and respond to numerous features of the ECM, including the composition and availability of adhesive ligands, mechanical stiffness, and spatial and topological organization of these scaffolds, through surface receptors known as integrins [2]. Here we introduce two major components of ECM related to cell adhesion. One is collagen, which is the single most abundant protein in animal tissues and constitutes the structure of ECM. The collagens are a large family of proteins, containing at least 19 different members. They are characterized by the formation of triple helices in which three polypeptide chains are wound tightly around one another in a ropelike structure (Fig 1.10A). The most abundant type of collagen (type I collagen) is one of the fibril-forming collagens that are the basic structural components of connective tissues. After being secreted from the cell, these collagens assemble into collagen fibrils in which the triple helical molecules are associated in regular staggered arrays [13].
The other is fibronectin, which plays a crucial role in a wide variety of developmental and cellular processes. Fibronectin is a dimeric glycoprotein consisting of two polypeptide chains, each containing nearly 2500 amino acids (Fig 1.10B). At the molecular level, cell movement
and behavior are mediated by FN fibrils extending between cells and to the substratum. In the extracellular matrix, fibronectin is further crosslinked into fibrils by disulfide bonds. Fibronectin has binding sites for both collagen and GAGs (glycosaminoglycans), so it crosslinks these matrix components. A distinct site on the fibronectin molecule is recognized by cell surface receptors and is thus responsible for the attachment of cells to the extracellular matrix [13, 21].
(A) (B)
Figure1. 10 Structure of collagen and fibronectin. (A) Three polypeptide chains coil around one another in a characteristic triple helix structure. (B) Fibronectin is a dimmer of similar polypeptide chains joined by disulfide bonds near the C terminus. Sites for binding to proteoglycans, cells, and collagen are indicated [13].
1.4 Apoptosis
Programmed cell death (also called apoptosis) is a normal physiological form of cell death that plays a key role in both the maintenance of adult tissues and in embryonic development. In adults, programmed cell death is responsible for balancing cell proliferation and maintaining constant cell numbers in tissues undergoing cell turnover. In addition, programmed cell death provides a defense mechanism by which damaged and potentially dangerous cells can be eliminated for the good of the organism as a whole. Virus-infected cells frequently undergo programmed cell death, thereby preventing the production of new virus particles and limiting spread of the virus through the host organism. Other types of insults, such as DNA damage, also induce programmed cell death. In the case of DNA damage, programmed cell death may eliminate cells carrying potentially harmful mutations, including cells with mutations that might lead to the development of cancer. The survival of many types of cells in animals is dependent on growth factors or contacts with neighboring cells or the extracellular matrix, so programmed cell death is thought to play an important role in regulating the associations between cells in tissues. Regulation of programmed cell death is mediated by the integrated activity of a variety of signaling pathways, some acting to induce cell death and others to promote cell survival [13].
1.4.1 Characterization
Programmed cell death is an active process characterized by a distinct morphological change. During apoptosis, chromosomal DNA is usually fragmented as a result of cleavage between nucleosomes. The chromatin condenses and the nucleus then breaks up into small pieces. Finally, the cell itself shrinks and breaks up into membrane-enclosed fragments called apoptotic bodies. Such apoptotic cells and cell fragments are readily recognized and phagocytosed by both macrophages and neighboring cells, so cells that die by apoptosis are
efficiently removed from tissues and won’t cause inflammation [13, 22, 23].
(A)
(B)
Figure1. 11 Aptptosis (A) Light micrographs of normal (left) and apoptotic (right) human leukemia cells, illustrating chromatin condensation and nuclear fragmentation during apoptosis. (B) Diagrammatic representation of the events of apoptosis [13].
1.4.2 caspase family
The caspases are named because thy have cysteine (C) residues at their active sites and cleave after aspartic acid (Asp) residues in their substrate proteins. The caspases are the ultimate effectors or executioners of programmed cell death, bringing about the events of apoptosis by cleaving nearly 100 different cell target proteins. The caspases are synthesized as inactive precursors that are usually converted to the active form by proteolytic acleavage, catalyzed by other caspases. The activation of an initiator caspase therefore starts off a chain reaction leading to activation of additional downstream caspases and death of the cell. Regulation of caspases is thu central to determining cell survival [24].
There are several pathways of apoptosis, and caspases play a key role to execute cell death. For example, mammal cells which are triggered apoptosis would form a complex within themselves. This complex is a multisubunit called apoptosome which consists of Apaf-1, caspase-9 and cytochrome c released from injured mitochondria. Once caspase-9 is activated, it would cleave and activate other downstream effector caspases, such as caspase-3, eventually resulting in cell death [24, 25].
Other pathway involves cell death receptors and also induces activation of caspases. The cell death signals are polypeptides belonging to the tumor necrosis factor (TNF) family. One of the best characterized members of this family is the cell surface receptor called Fas, which plays important roles in controlling cell death in the immune system. TNF and related family members consist of three identical polypeptide chains, and their binding induces receptor trimerization. The cytoplasmic portions of the receptors bind adaptor molecules that in turn bind an upstream caspase called caspase-8. This leads to activation of caspase-8 as a result of self-cleavage, and the activated molecules of caspase-8 can then activate other downstream caspases, thereby initiating a caspase cascade that results in death of the cell [13, 26].
Figure1. 12 Regulators and effectors of apoptosis. In mammalian cells, many cell death signals induce apoptosis as a result of damage to mitochondria, resulting in the release of cytochrome c and other pro-apoptotic molecules. Release of cytochrome c from mitochrondrial leads the formation of complexes (apoptosomes) containing Apaf-1 and caspase-9. [13]
1.4.3 Singnaling cell survival
There are other signaling pathways acted in the opposite direction to promote cell survival by inhibiting apoptosis. These signal pathways control the fate of a variety of cells whose survival is dependent on extracellular growth factors or cell-cell interactions. One of the major intracellular signaling pathways responsible for promoting cell survival is initiated by the enzyme Phosphatidylinositol 3-kinase (PI 3-kinase), which is activated cell survival is activated by either protein-tyrosine kinases of G protein-coupled receptors. PI 3-kinase
phosphorylates the membrane phospholipids PIP2 to form PIP3, which activates the
protein-serine /threonine kinase Akt. Akt then phosphorlyates a number of proteins that regulate apoptosis. Overall speaking, activation of the PI 3-kinase pathway is critical for the survival of many cell types [13, 17, 27].
Figure1. 13 The PI 3-kinase pathway and cell survival. Survival factors such as NGF activate receptor protein-tryosine kinase, leading to activation of PI 3-kinase and formation of PIP3.
PIP3 recruits the protein kinase Akt to the plasma membrane where it is activated as a result of
phosphorylation by PDK1. Akt then appears to phosphorylate a number of proteins that contribute to cell survival. [13]
1.4.4 Anoikis
Fibroblasts and certain other cell types dissociated from their extracellular matrix undergo reversible growth arrest, thereby revealing their anchorage dependence. The ECM plays a role to physically support cell growth. The well linkage to ECM through integrins helps to transmit survival signals and to activate PI 3-kinase. PI 3-kinase and the AKT oncoprotein may mediate the anoikis-suppressing effects of focal adhesion kinase. The new term “anoikis”
-- the ancient Greek word for “homelessness”--was coined to denote the apoptosis that occurs in cells that are detached from matrix (or that are attached via the wrong molecules). The existence of anoikis implies that integrin signaling regulates critical components of the apoptotic machinery [28, 29]. Some papers suggested that primary embryonic fibroblasts are very susceptible to apoptosis (anoikis) when held in suspension. Embryonic fibroblasts were similar to epithelial cells and endothelial cells in that apoptosis is a default pathway: active suppression of apoptosis is essential for cell survival [30].
Chapter 2
Experimental Methods
2.1 Experimental design
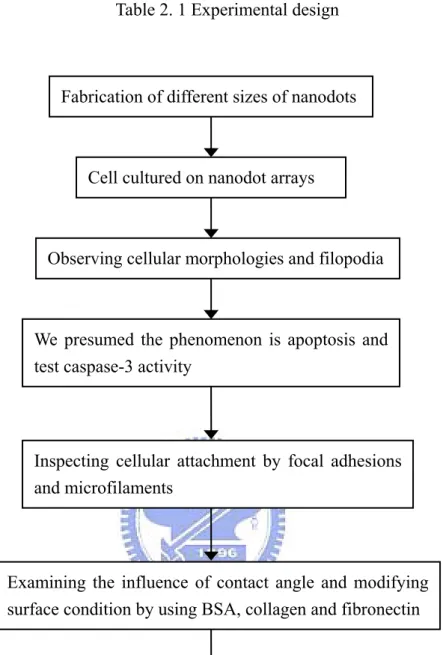
In this study, our purpose focused on cellular responds to nanotostructure of different scales. Aluminum anodic oxide has nanometric honeycomb structure assembling naturally during oxidizing reaction. Because the structure is highly packed, uniformly distributed and size-controllable, AAO is generally regarded as a good template material to fabricate nanomaterials [31]. Additionally this fabricating process is cheap and fast. So we adopted this method to fabricate nanodot arrays. NIH 3T3 cell is a kind of fibroblast which demands well linkage with substratum to produce survival signal [30]. Thus we used NIH 3T3 cells to study cell response to nanodot arrays. These results could apply to normal cells-tissues interactions or designs of artificial implantation. First we planned to observing cellular morphologies by SEM and actin filaments and focal adhesions by fluorescent microscopy. Then caspase-3 activity was measured to further confirm the existence of apoptosis. The components of ECM, fibronectin and type I collagen, were supposed helpful to cell adhesion on nanotopography. The measurement of contact angle was made for testing the effect of surface chemistry. Finally we inferred the occurrence of apoptosis was relative to interference of actin polymerization, so we used Cyto D, an inhibiting agent of actin polymerization. The experimental design was made into flow chart presented in Table 2.1.
Table 2. 1 Experimental design
Fabrication of different sizes of nanodots
Cell cultured on nanodot arrays
Observing cellular morphologies and filopodia
We presumed the phenomenon is apoptosis and test caspase-3 activity
Examining the influence of contact angle and modifying surface condition by using BSA, collagen and fibronectin
Inspecting cellular attachment by focal adhesions and microfilaments
Making the statistics of apoptotic cells and comparing with Cyto D-treated to infer the pathway
2.2 Chemical reagents
The chemical reagents we have used are recorded in Table 2.2. Table 2. 2 chemical reagents
Glutaraldehyde Electron Microscopy Sciences Osmium tetroxide Electron Microscopy Sciences Paraformaldehye Electron Microscopy Sciences
Cytochalasin D Calbiochem
Fibronectin Sigma
Type I collagen Sigma
L-glutamine Sigma
Sulfuric acid Sigma
Oxalic acid Sigma
Phosphoric acid Sigma
Trypsin Sigma
Anti-vinculin primary antibody (hVIN-1)
Abcam
Alexa Fluor® 594 phalloidin Invitrogen Alexa Fluor® 488 goat anti-mouse
IgG
Invitrogen
2.3 Fabrication of nanodot arrays
Nanodot arrays were fabricated as followed: TaN thin film of 150 nm in thickness was deposited onto a 6-inch silicon wafer followed by deposition of 3 µm-thick aluminum on the top of a TaN layer. Anodization was carried out in 1.8 M sulfuric acid at 5 Volts for 10 nm nanodot array, or in 0.3 M oxalic acid at 25 Volts, 60 Volts, and 100 Volts for 50 nm, 100 nm, and 200 nm nanodot arrays, respectively. Porous anodic alumina was formed during the anodic oxidation. The underlying TaN layer was oxidized into tantalum oxide nanodots using the alumina nanopores as template. The porous alumina was removed by immersing in 5 % (w/v) H3PO4 overnight. A thin layer of platinum (ca 5 nm) was sputtered onto the structure to
improve biocompatibility. The dimension and homogeneity of nanodot arrays were measured and calculated from images taken by JEOL JSM-6500 TFE-SEM and by atomic force microscopy (AFM). The schematic representation of fabrication procedure is presented in Fig 2.1.
2.4 Cell culture
NIH 3T3 cell line is purchased from “Food Industry Research and Development Institute.” Then we followed their suggested protocol (Table 2.3) to culture the cells.
Table 2. 3 culture protocol
Cell Name NIH/3T3
Cell Type Mouse NIH/Swiss embryo, contact-inhibited
Cell Morphology fibroblast-like
Culture Condition 37 ºC, 5% CO2
Medium Change Every 2 to 3 days
Growth Property Adherent
Culture Medium 90% Dulbecco's modified Eagle's medium with 4 mM L-glutamine adjusted to contain 1.5 g/L sodium bicarbonate and 4.5 g/L glucose + 10% calf serum
SubCulture Procedure trypsin-EDTA; NOTE: Do not allow the cells to become confluent, subculture once per week. Freezed Medium 93% culture medium + 7% DMSO
2.5 Scanning electron microscopy of cell morphology
Every nanodot array sample was sterilized by irradiating ultraviolet light at clean room. Then we seeded 5 ×10³ cells onto different sizes of nanodot arrays which placed in 6-well plate.
1. After 24, 48, 72, 96 hr of incubation, the cells were fixed with 1% glutaraldehyde in PBS for 15 minutes.
3. Samples were followed by post-fixation in 1% osmium tetroxide for 30 min. 4. Rinsing three times with PBS.
5. Dehydration was performed through a series of ethanol concentrations (5-min incubation each in 50%, 60%, 70%, 80%, 90%, 95%, and 100% ethanol) and air dried.
The specimen was sputter-coated with platinum (ca 5 nm) and examined by JEOL JSM-6500 TFE-SEM at an accelerating voltage of 10 keV.
2.6 Measurement of contact angles
Contact angles were measured using FTA125 (First Ten Angstroms, USA) in a class-10 clean room. The measuring procedure was provided by the manufacturer and described as followed:
1. Loading 5 mL DI water into plastic syringe. 2. Dropping a about 100μL droplet on the holder.
3. The software equipped with the instrument would capture the image of droplet by CCD camera.
4. The software then analyzing the contact angle automatically.
For BSA-coating samples, we would bake them at 40ºC overnight to remove residual moisture before the measuring procedure provided by the manufacturer.
2.7 Immunofluorescence and cytoskeletal observation
Immunostaining can make focal adhesions and microfilaments visible. Through observing their distribution, we could judge adherent condition of the cells.
1. 5 ×10³ cells were seeded onto different sizes of nanodot arrays and allowed to grow to 96 hr.
3. Rinsing three times with PBS.
4. Incubating with 0.1% Triton X-100 for 10 min. 5. Rinsing three times with PBS.
6. For blocking unspecific binding, the samples were incubated with 1%BSA in PBS for 1 hr prior to staining.
7. Rinsing three times with PBS.
8. Incubating in the anti-vinculin primary antibody solution for 1 hr (1:200 in BSA/PBS). 9. Simultaneously, phalloidin was added for the duration of this incubation.
10. After decanting the solution and rising three times in PBS. 11. Incubating with the secondary antibody for 60 min.
12. Finally, the samples were washed for appropriate times and viewed by fluorescence microscope (LEICA DM2500M).
2.8 Coating of proteins and Cytochalasin D treatment
1. Coating of BSA, FN, and type I collagen was performed by covering nanodot arrays with 400μL protein solution (0.1 mg/mL) at 4 ºC for 8 hr.
2. Rinsing with PBS three times before use.
3. After culturing for 96 hr, the samples were harvested and treated following previous protocol to observe their morphology.
5 ×10³ cells were seeded onto 100 nm nanodot arrays with Cytochalasin D (final concentration 10-7 g/ml). After culturing for 96 hr, the samples were harvested and treated following above protocol to observe their morphology.
2.9 Caspase-3 activity assay
EnzChek Caspase-3 Assay Kit #2 (Invitrogen, USA) was applied to evaluate caspase-3 activity following the procedure provided by the manufacturer.
1. The harvested cells were span and collected the pellets.
2. Subsequently the pellets were suspended with 50 μL lysis buffer for 30 minutes.
3. The cell lysate was centrifuged, and the supernatant was transferred to microplate wells containing 50μL Z-DEVD–R110-substrate-working solution followed by incubation at room temperature.
4. After 1 hr, the fluorescence was measured by ELISA microplate reader (Perkin Elmer, USA) with excitation wavelength at 496 nm and emission wavelength at 520 nm. Finally Caspase-3 activity was normalized with cell counts.
2.10 Statistics of percentage apoptotic cell
The statistics were made by the SEM observation of different sizes of nandot arrays and Cyto D treatment. For each experimental condition, we counted the number of apoptotic cells in twenty cells and repeated two times. Then we divided the number of apoptotic cells to total number of cells we have counted each time to get the percentage of abnormal cells. The percentage numbers would be calculated for mean value and standard deviation. The results were showed in mean value± standard deviation and draw in a column chart.
Chapter 3
Results and Discussions
3.1 Nanodot arrays
At the beginning of the chemical reaction, the anodic current density fell down rapidly and was steady at 5 mA/cm2 expected for nucleate stage of AAO formation. Then the density decreased gradually when the barrier layer extended downward. Finally the barrier layer contact TaN film and turned it into tantalum oxide. To ensure TaN film was anodized completely, we cut off the power when the current density was lower than 0.025 mA/cm2. Figure 3.1 presents the top-view SEM image of nanodot arrays. Tantalum oxide nanodot matrices with dot diameters of 10 nm, 50 nm, 100 nm, and 200 nm were constructed on silicon wafer. The nanodot arrays have well uniform size distribution and their diameter/interval distance (center-to-center) were 15.3 ± 2.8 nm/22.8 ± 4.6 nm, 58.1 ± 5.6 nm/61.3 ± 6.4 nm, 95.4 ± 9.2 nm/108.1 ±12.3 nm, and 211.5 ± 30.6 nm/194.2 ± 15.1 nm for 10-nm, 50-nm, 100-nm, and 200-nm nanodot arrays, respectively.
To investigate the height of nanodot arrays, these samples also observed by atomic force microscopy (Figure 3.2). According the results, the height were 11.3 ± 2.5 nm, 51.3 ± 5.5 nm, 101.1 ±8.3 nm, and 154.2 ± 27.8 nm for 10-nm, 50-nm, 100-nm, and 200-nm nanodot arrays, respectively.
(A) (B)
(C) (D)
Figure 3. 1 SEM im ages are arranged as (A)
unprocessed silicon (Si), (B) 10-nm nanodot array (50 nm),
(D) 100-nm nanodot array (100 nm ).
(E)
ages of the fabricated nanodot arrays. Im nanodot array (10 nm), (C) 50-nm ), and (E) 200-nm nanodot array (200 nm
(A) (B)
(C) (D)
(E)
Figure 3. 2 AFM images of the fabricated nanodot arrays. Images are arranged as (A) unprocessed silicon, (B) 10-nm, (C) 50-nm, (D)100-nm, and (E)200-nm nanodot array.
3.2 Cellular response to nanodot arrays
3.2.1 Observation of cell morphology
efore being seeded on cells, these test samples were treated by two steps: 1. To improve s coated onto the top of the nanodot arrays. 2. To ensure the pollutant-less, these samples were irradiated by ultraviolet light at clean room. Then NIH-3T3 cells were cultured on fabricated nanodot arrays and on flat wafer at the density of 5000 cells per square centim
B
the bio-compatibility, platinum of ca 5-nm thickness wa
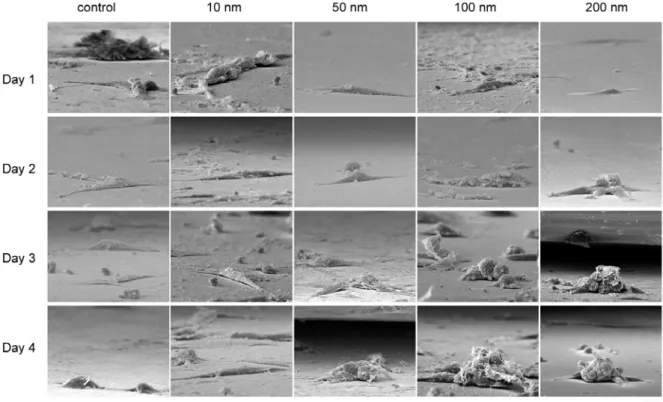
eter. Cells were harvested at 24 hr, 48 hr, 72 hr, and 96 hr after seeding. SEM was performed to examine the morphology of cells (Figure 3.3). The side-view of SEM images provided alternative angles to evaluate the morphological change of cultured cells (Figure 3.4). Cells grown on control surface and 10-nm nanodot array remained flat and extended throughout the course of incubation. The confluent cells could be found on day 4. Cells grown on 50-nm nanodot array began to show an abnormal appearance on day 4. The abnormal cells underwent transformation of main cell body into subcellular spheres of ca 10 microns in diameter. On day 4, spherical sub-cellular cell bodies were visible. For cells grown on 100-nm nanodot array, comparable morphology occurred earlier from day 3. And the proportion of abnormal cells grown on 100-nm also increased compared to on 50-nm; while for 200-nm nanodot array, the cell couldn’t stretch well on day 1. Morphological aberration started from day 2. The proportion of cells undergoing morphological change was higher and the event was triggered earlier on 100- and 200-nm nanodot arrays. The abnormal morphology looks similar to apoptotic body, so we speculated that part of the cells grown on nanodot arrays proceeded programmed cell death (i.e. “apoptosis”). We have presented some evidences supporting our supposition in rear section.
Morphological images demonstrated that nanodot arrays have influenced the growth of cells. There are two possible reasons proposed in previous papers [2-5]: one is surface chemistry like hydrophobicity; the other is surface topology. They were proved to affect
cellular attachment and might share a common pathway to direct cell behavior. We must investigate which one is more dominant in this case.
Figure 3. 3 SEM images of cells seeded on nanodot arrays. NIH-3T3 cells were seeded on flat silicon surface, 10-nm nanodot array (10 nm), 50-nm nanodot array (50 nm), 100-nm nanodot array (100 nm), and 200-nm nanodot array (200 nm). The cells were harvested at 24 hr (Day 1), 48 hr (Day 2), 72 hr (Day 3), and 96 hr (Day 4) after seeding.
Figure 3. 4 Side-view image of cellular morphologies.
3.2.2 Contact angle
The method to quantify the hydrophobicity of surface is measuring its contact angle. So we made the experiment described in CH 2 and showed the results in Figure 3.5A. Contact angle enlarged while the sizes of nanodot arrays increased. It had the peak value at 100 nm nanodot array but decreased at 200-nm nanodot array. The result indicated that surface hydrophobicity mostly increased with dot size. However, after coating BSA on nanodot arrays, the difference of contact angle has diminished (Figure 3.5B). But the data showed in next section indicates that the BSA-coating couldn’t prevent apoptosis. Hence physical factor was more dominant here.
(A) (B)
the nanodot arrays. Contact angles were ys (B) and BSA-treated nanodot arrays.
Figure 3. 5 Contact angle measurements for measured for (A) untreated nanodot arra
ubstrates and kely be one of the cells’ main sensory tools. Formation of focal adhesions reflected by the for cultured cells. The nu
3.2.3 Nanotopography affected formation of filopodia
Filopodia have been reported to be very important to the cellular response to s li
attachment of filopodia to the substratum indicates normal growth
mber of filopodia extended from cells decreased for cells grown on nanodot arrays larger than 50 nm (Figure 3.6). For cells seeded on 200-nm nanodot array, very few filopodia were found. Cells grown on larger-sized nanodot arrays seemed to loose the ability to establish filopodia attachment.
(A)
Figure 3. 6 SEM images of NIH-3T3 cells cultured on nanodot arrays to show filopodia extended from cells.
(b) (B)
(C) (D)
3.2.4 Side-view image of cellular attachment
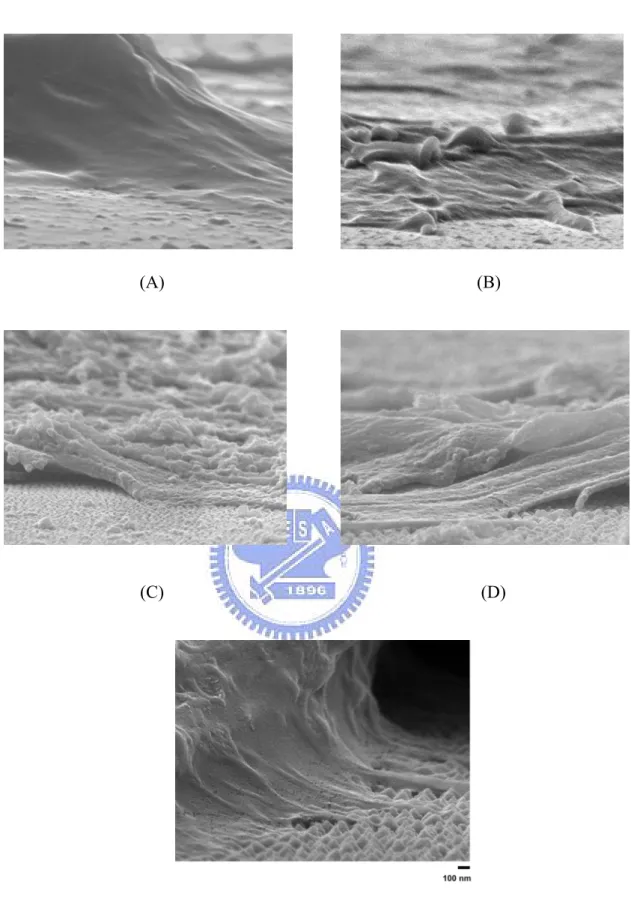
When we used SEM to observe the samples by side-view, we found that although cells could adhere to varies sizes of nanotopography (Figure 3.7), there were partial cells showed poor adhesion and strong response to nanotopography. Figure3.8 presented cells grew varies sizes of nanotopography on day 4. The cells grown on arrays with dot-size larger than 50 nm stuck out and had reduced attachment area to the substratum. Their adhesion sites were fewer and all distributed at the periphery of the cells.
Fibroblastic cells adhere to substrate by forming focal adhesions which are consistent of integrins and cytoplasmic proteins [2]. Actin filaments assemble stress fibers that relate with cellular attachment. The formation of focal adhesions and the development of the cytoskeleton are important for the differentiation of cells [32]. So it is necessary to inspect the cytoskeleton and focal adhesions of the abnormal cells.
Figure 3. 7 The adhesion sites of cells culture (B) 10 nm (Due to the mitation of cross-section view, 10-nm nanodots couldn’t be viewed.) (C) 50 nm (D) 100 nm
) 200 nm.
(A) (B)
(C) (D)
(E)
d on (A) flat wafer. li
3.2.5 Immunofluorescent image of cytoskeleton
Vinculin is a membrane-cytoskeletal prote focal adhesion plaques that mediates the
Figure 3.8 presented actin and vinculin labelled by phalloidin and vinculin antibody (hVIN-1) respectively. After culturing 96 hr, the cells grown on flat and 10-nm nanodot ar
actin filament became blurring. Focal adhesions showed notably less distinct and smaller plaques. Especially morphologies of these cells are sim
and it became less defined in the abnormal cells. Thus we should do some experiment about apoptosis to support our suggestion.
in in
association of actin filaments with integrins. Staining vinculin with fluorophores could make focal adhesions available for observation.
rays showed apparent stress fibers and numerous focal adhesions. But those on 50-nm nanodot arrays, their stress fibers and focal adhesions both decreased. As to the cells grown on 100-nm and 200-nm nanodots arrays,
ilar to Balb/c 3T3 fibroblasts in reference paper [33] which were deprived serum to induce apoptosis. Moreover we randomly picked ten fluorescent pictures for each condition and calculated the number of abnormal cells and the amount of focal adhesions (i.e. green spots of vinculin) per cell. The result showed in Figure 3.9 could clearly quantify the difference between different sizes of nanodot arrays. Our findings were similar to Dalby’s data that scale over 50 nm nanotopagraphies reduced cell adhesion and development of cytoskeleton.
Adhered to substrate is a vital factor of the fibroblast. If a fibroblast lost its adhesions, it would undergo apoptosis. This phenomenon has been studied for a long time and was called “anoikis” or “death of homelessness” [29]. So far our data suggested that the cells grown on oversize of nanotopography might be induced apoptosis due to the reduced attachment area and fewer focal adhesions. Actin filament is another one influenced by nanotopography,
Figure 3. 8 Cells were seeded on nanotopography and cultured for 96 hrs before harvest. The columns are side-view of cellular attachment, actin filaments, and vinculin, respectively.
cells ere cultured for 96 hr and prepared following the steps mentioned in section 2.5 for SEM bservation (Figure 3.10). From the morphological images, pre-treatment of BSA did not revent apoptosis while FN and collagen I coating completely averted apoptosis. FN and (A) (B)
Figure 3. 9 Statistics for (A) the number of abnormal cells per picture and (B) the amount of focal adhesions per cell.
3.3 Surface modification and Cytochalasin D treatment
The immunofluorescent images indicated that nanodot arrays can affect the formation of focal adhesion and actin polymerization. There were some papers [2, 6, 34] mentioned that coating extracellular matrix (ECM) or ECM-like shape of nanomaterials on substrate could promote cellular adhesion. So the inability of cells to establish filopodia attachment on nanolandscape might be prevented by surface modification of ligands. We selected fibronectin (FN) and type I collagen, which were thought associated with cellular adhesion, to coat on 100-nm nanodot array and flat wafer. For the control, we coated BSA, the common protein but not belong to ECM. We were also interested in the phenomenon “actin polymerization”, so we treated the cells grown on the wafers with Cytochalasin D (Cyto D) which was reported as an inhibited agent of actin polymerization and might trigger apoptosis. All of these w
o p
collagen are native substrates of integrins, the Prevention of programmed cell death by the F
key transmembrane proteins of focal adhesions.
indicated that topography-induced
attachment. The Cyto D-treated cells on the flat much flat. It might result from the disruptio polymerization. But the abnormal cells gr transformation of main cell body into more s
owed in the Figure 3.3. This phenomenon is very interesting and will be discussed in the N- or type I collagen-enforced cell anchorage apoptosis could be overridden by receptor-mediated cell wafer lost their fibroblast-shape and looked n of actin filaments and inhibition of actin own on 100-nm nanodot array underwent
ubcellular spheres than the untreated cells sh
later section.
(C) (D)
igure 3. 10 Effects of (B) BSA-, (C) FN-, and (D) type I collagen- coating on the nanotopography-induced apoptosis. (A) untreated and (E) Cyto D-treated cells were also resented here. Cells were seeded on 100-nm nanodot arrays and cultured for 96 hrs before
(E) F
3.4
l cells resemb .
The occurrence of apoptosis was validated by d on cells
seeded on nanodot arrays following the tim
time-dependent accumulation, and size-dependent tched the proportion of cells undergoing mo cal transformation on nanodot arrays. Nanotopography triggered apoptosis for cultured cells in a size-dependent and time-dependent manner. And our data showed arrays with dot-size larger than 50 nm triggered apoptosis.
The cells seeded on protein-coated and treated with Cyto D were examined their caspase-3 activity, too. Except one test topography was flat wafer, others were all 100-nm nd suggested that oating ECM protein on the wafers would help the cells adhere to nanostructure surface. Cyto is a dose-dependent cytoskeletal collapse that causes apoptosis. The cells treated with Cyto were good positive control and showed 1.4 times caspase-3 activity of the untreated cells.
Caspase-3 activity assay
The morphology of abnorma led cells proceeding programmed cell death caspase-3 activity assay performe
e course (Figure 3.11A). The onset, profile of caspase-3 activity ma
rphologi
nanodot arrays. The result (Fig 3.11B) supported our SEM observation a c
D D
surface and treated with Cyto D. Values were averaged from 3 sets of independent
repeated tw
and draw as a chart (Figure 3.12) to show the percentage of abnormal cells associated with nanotopography. This chart indicated the transformation was triggered earlier on 100- and 200-nm nanodot arrays and gradually severe with time.
zes of nanodot arrays were also calculated and draw as the chart by the same method (Figure 3.13A). Comparing the curves of cells grown on 200-nm ananodot arrays (Figure 3.13B), it implicated that cytochalasin D triggered early onset of apoptosis. However, the accumulation rate of apoptosis remained essentially unchanged similar to untreated cells. The co
showed the same situation as 200-nm ananodot arrays. So we supposed that the apoptotic (B)
Figure 3. 11 Caspase-3 activities for cells cultured 72 hrs on (A) nanodot arrays (B) modified
experiments and were expressed as mean value ± standard deviation.
3.5 Statistics for percentage of apoptotic cell
After observing morphology of the cells by SEM, we tried to find out the tendency of cellular response. Hence we counted the number of apoptotic cells per twenty cells and o times for every experimental condition. Results are mean± standard deviation
The Cyto D-treated cells grown on various si
pathways nanodot arrays triggered might be shared by integrins-mediated form
adhesions. And that would lead to rearrangement of cytoskeleton [28, 35]. Cytochalasin D is a eable fungal toxin which binds to the barbed end of actin filame
the association and dissociation of subunits [14]. This causes the disrup
and inhibition of actin polymerization. Cytochalasin D alone induces a dose-dependent e that causes apoptosis [15-18]. Cytochalasin D triggered apoptosis for cells cultured on control surface, too. The result suggested that the nano
ation of focal
cell-perm nts inhibiting both
tion of actin filaments
cytoskeletal collaps
topography induced poptosis through PI-3K pathway [16, 17].
ology calculated from SEM images. Bars
(vertical line), 50-nm nanodot array (empty), 100-nm nanodot array (horizontal line), and a
Figure 3. 12 Percentage of cells with abnormal morph
depict percent apoptotic cells grown on flat silicon surface (grey), 10-nm nanodot array
(A)
alasin D to nanotopography-induced apoptosis. Cells were ultured on nanodot array for the designated time and morphologically aberrant cells were counted. (A) Bars depict percent apoptotic cells grown on flat silicon surface (grey), 10-nm anodot array (vertical line), 50-nm nanodot array (empty), 100-nm nanodot array (horizontal ne), and 200-nm nanodot array (filled). (B) Cytochalasin D-treated (●) and untreated cells (▲) on 200-nm nanodot arrays were drawn to show the early onset of apoptosis triggered by
(B) Figure 3. 13 Effects of cytoch
c
n li
Chapter 4
Conclusions
4.1 conclusions
this study, we manufactured a series size of nanodot arrays and seeded mouse fibroblast NIH 3T3 cells on nanodot arrays to investigate cellular response to nanolandscape. The nanodot arrays were fabricated by anodic aluminum oxide (AAO) processing on Al-T -Si wafers. There were four kinds of mean diameters --- 15.3, 58.1, 95.4 and 211.5 nm--- nanodot arrays presented and their feature sizes have been completely investigated by EM and AFM. In the SEM images, NIH 3T3 Cells seeded on flat wafer surface and on 10 nm nanodot array showed normal morphology well attachment. Abnormal morphology nd poor adhesion were observed on the cells cultured on arrays with dot size larger than 50 nm by SEM. After measuring the contact angle of these nanotppography, we excluded surface chem stry involved in this phenomenon.
the high magnification top-view image and side-view image, less filodopia and reduced attachment were found on the abnormal cells. Filodopia are clustered and assembled by actin filaments. We found the actin filaments of the abnormal cells couldn’t form distinct stres in immunofluorescent image. Their focal adhesions are also fewer and smaller comp al cells. Fibroblast might undergo apoptosis due to lack of adhesions to substrate and bad development of cytoskeleton. The result of caspase-3 activity was corresponding with our observation and this theory. The cells grown on 200-nm nanodot
optotic cells, we supposed that apoptosis induce by nanotopography share the In aN S and a i In s fibers are to norm
arrays exhibited highest caspase-3 activity. Coating of fibronectin (FN) or type I collagen prevented the nanotopography-induced programmed cell death. Cytochalasin D, the inhibited agent of actin polymerization, was added into culture medium and destroyed actin polymerization and cellular growth as showed in our data. According to our statistics for percentage of ap
same pathway with Cyto D treatment. Finally, we come to conclusion and
1. Nanotopography is able to disturb the development of cytoskeleton and reduce er of focal adhesions. In side-view images of SEM, the cells grown on
ger nanodot arrays. present three points as followed:
the numb
over 50-m nanodot arrays stuck out from substratum and appeared dislike to adhere on it. The fluorescent images of vinculin also indicated there were fewer and smaller adhesion sites beneath these cells. And their actin filaments were blurring without apparent stress fibers.
2. Failure of attachment induced by nanotopography leads to apoptosis. In our SEM photos, cells grown on under 50nm-anodot arrays still remained fibroblast-like after cultured for 96 hrs. But cells grown on over 50-m nanodot arrays displayed abnormal morphologies and sub-cellular spherical bodies similar to apoptotic body. Caspase-3 activity has proved our suspicion. It showed great value with cells grown on the lar
3. Proper modification of surface chemistry is helpful to improve physical shortage of nanostructure. When nanodot arrays were only covered with 5-nm platinum, their contact angle increased at large diameter of nanodot and had largest value at 100-nm nanodot. But it decreased at 200-nm nanodot. After coating BSA on these nanotopographies, the difference of their contact angle has diminished. However the morphologies of cells grown on over 50-nm nanodot arrays coated with BSA have still remained abnormal. And their caspase-3 activities showed no apparent difference with those cells grown on uncoated surface. While as we coated nanodot arrays with components of ECM, type I collagen and fibronectin, cells grown on them have attached well to substratum even after cultured for 96 hrs. Their caspase-3 activities also have apparently decreased. This change must
4.2 future works
We . To examine the
phenomena we observed and apoptosis. This w nanotechnology
observe living cell by confocal laser m nanolithography to control cellular
we hope these findings can im day.
have already proved cellular growth effected by nanotopography
, we will examine gene expression about cytoskeleton, focal adhesion ork can help us to understand the interaction between cell and . Moreover we can fabricate nanodot arrays on transparent substrate to icroscopy. Otherwise we can define nano-pattern by growth. The future development of this study is wide and prove human life some
Reference
1567-1570.4. A. Curtis and C. Wilkinson, Biomaterials, 1997. 18: p. 1573-1583.
7. A. L. Teixeira, et al., J Cell Sci, 2003. 116: p. 1881-1192.
631. 10. M. J. Dalby, et al., Biomaterials, 2002. 23: p. 2945-2954.
1. M. J. Dalby, et al., Exp Cell Res, 2002. 276: p. 1-9.
2. M. J. Dalby, D. Pasqui, and S. Affrossman, IEE Proc.-Nanobiotechnol., 2004. 151: p. 53-61.
3. G. M. Cooper and R.E. Hausman, The Cell: A Molecular Approach, ed. 3rd. 2004. 4. J. F. Casella, M. D. Flanagan, and S. Lin, Nature, 1981. 293: p. 302-305.
15. M. A. Partridge and E. E. Marcantonio, Mol Biol Cell, 2006. 17: p. 4237-4248.
6. Celeste Morley, S., G.P. Sun, and B.E. Bierer, J Cell Biochem, 2003. 88: p. 1066-1076. 7. R. Yao and G. M. Cooper, Science, 1995. 267: p. 2003-2006.
18. S. L. DeMeester, et al., Surgery, 1998. 124: p. 362-370. 9. E. Zamir and B. Geiger, J Ce'll Sci, 2001. 114: p. 3583-3590. 0. E. A. Clark and J. S. Brugge, Science, 1995. 268: p. 233-239. 21. J. E. Schwarzbauer, J Cell Biol, 1991. 113: p. 1463-1473.
2. M. D. Jacobson, M. Weil, and M. C. Raff, Cell, 1997. 88: p. 347-354.
3. J. E. Jr. Meredith, B. Fazeli, and M. A. Schwartz, Mol Biol Cell, 1993. 4: p. 953-961. 24. Y. Shi, Mol Cell, 2002. 9: p. 457-470.
5. S. J. Martin, Cell, 2002. 109: p. 793-796.
6. A. Ashkenazi and V. M. Dixit, Science, 1998. 281: p. 1305-1308.
27. A. Brunet, S. R. Datta, and M. E. Greenberg, Curr Opin Neurobiol, 2001. 11: p. 297-305.
8. S. M. Frisch and H. Francis, J Cell Biol, 1994. 124: p. 619-626.
29. S. M. Frisch and E. Ruoslahtit, Curr Opin Cell Biol, 1997. 9: p. 701-706. 0. J. E. Hungerford, et al., J Cell Biol, 1996. 135: p. 1383-1390.
1. H. Masuda and K. Fukuda, Science 1995. 268: p. 1466 - 1468. 32. M. J. Dalby, et al., Biomaterials, 2003. 24: p. 927-935.
3. G. V. Kulkarni and C. A. G. McCulloch, J Cell Sci, 1994. 107: p. 1169-1179. 1. F. H. Ko, C. T. Wu, and H. Y. Hwang, Microelectronic Engineering, 2006. 83: p.
2. C. S. Chen, et al., Ann Biomed Eng, 2006. 34: p. 59-74. 3. M. Mrksich, Curr Opin Chem Biol, 2002. 6: p. 794-797.
5. R. G. Flemming, et al., Biomaterials, 1999. 20: p. 573-588. 6. P. F. Nealey, et al., J Cell Sci, 2004(117): p. 3153-3164.
8. A. L. Teixeira, et al., Biomaterials, 2006. 27: p. 3945-3954 9. S. Meiners, et al., Biomaterials, 2005. 26: p. 5624-5
1 1 1 1 1 1 1 2 2 2 2 2 2 3 3 3