i
國立交通大學
應用化學系碩士班
碩士論文
開發微探針技術應用於藥物影響對心肌收縮功
能之檢測
Pharmacological Intervention to Cardiomyocyte
Contraction Characterized with Microcantilever
Technology
研究生:David Yu (于大衛)
指導教授:Dr. Ian Liau (廖奕翰 博士)
開發微探針技術應用於藥物影響對心肌收縮功
能之檢測
Pharmacological Intervention to Cardiomyocyte Contraction
Characterized with Microcantilever Technology
研 究 生:于大衛 Student: David Yu
指導教授:廖奕翰 助理教授 Advisor: Ass. Prof. Ian Liau
國立交通大學應用化學系碩士班
碩士論文
A Thesis
Submitted to Department of Applied Chemistry
College of Science
National Chiao-Tung University
In Partial Fulfillment of the Requirements
for the Degree of Master
in Applied Chemistry
Hsinchu, Taiwan
January 2011
i
Abstract (Chinese)
心臟的主要功能在於收縮促使血液流動,藉由血液將養分、氧氣及新陳 代謝物質運至或運離組織。心臟的基本功能單位為心肌細胞。心肌細胞功能 異常會導致心輸出下降甚至心臟衰竭。釐清引起心臟疾病的機制以及評估治 療心臟衰竭的療法需要更進一步了解心臟的功能特性。有別於活體動物或器 官層次的研究,研究體外培養的心肌細胞可以排除組織結構和體內激素調節 的影響,更能在細胞層次了解心肌細胞功能異常的原因以及量測收縮力,進 而收集資訊幫助擬定預防與治療心臟衰竭之方針。以往心肌細胞的相關研究 包括量測心肌收縮過程的細胞機械性質變化,或是心肌細胞在藥物處理下之 跳動頻率的改變,較少同時量測心肌細胞收縮過程之收縮能力以及細胞內鈣 離子變化。文章中開發微探針技術,對雞胚胎心肌細胞以非侵入方式即時追 蹤細胞膜位移,獲得脈動強度以及脈動頻率。並將此技術應用於量測荷爾蒙 以及藥物作用下心肌細胞跳動行為的動態變化。並結合細胞內鈣離子量測, 偵測細胞內興奮-收縮偶合作用。此技術對於細胞層次藥物效力測試以及心臟 毒性評估提供一新的檢測方法。Abstract (English)
Cardiomyocytes comprise the fundamental contractile unit of a heart. Dysfunction of cardiomyocytes can lead to deadly pathological conditions. Detailed characterization of cardiac functions on primarily cultured cardiomyocytes can help assess interventions against heart failure and elucidate the pathogenesis of contractile dysfunction of the heart. We have demonstrated the employment of microcantilever technology based on an atomic force microscope to characterize the pulsation dynamics of chicken embryo cardiomyocytes under various pharmacological interventions. We showed that the displacement of the cardiomyocyte membrane, during cardiomyocytes contraction can be kinetically and noninvasively monitored at nanometer resolution. Through short-time Fourier transformation, the dynamic intervention of the contractile behavior of cardiomyocytes by hormones and drugs was intuitively and quantitatively demonstrated on spectrogram. At the end, we have demonstrated our first attempt to simultaneously probe the intracellular Ca2+ and the contraction mechanics of cardiomyocytes treated with doxorubicin on the same platform. Our approach should prove useful for in vitro assessment of efficacies and cardiotoxicity of new drugs. The ability to measure the intracellular level of Ca2+ and the rhythm of contraction simultaneously may also bring new insight into the excitation-contraction coupling.
iii
Acknowledgements
First of all, I would like to deeply appreciate my parents’ support on material and mental aspects since the beginning of my study at the National Chiao Tung University (NCTU). Thanks to their generous support in both the tuition and living expense, I have become a healthy person and reached a milestone on the path of my study. Especially, they always keep me company, back up my thoughts, and teach me how to face adversity and deal with difficulties in a proper way whenever I was upset and under stress. Their support and encouragement have helped me grow matured. I feel so lucky that I live in such a harmonious and happy family, and have a great opportunity to study at the NCTU and to earn my master degree.
Second, I am very grateful to my group members and collaborators for their technical assistance on my research. Since I was an undergraduate, many seniors have helped me and mallow my mind. I especially appreciate Hung-Lung Lin, Hsiu-Lan Yen, Jhen-Wei Jhan, Hung-Che Chen, Chao-Yu Chung, Mei-Fang Chen, Yi-Cyun Yang, Wan-Yu Tai, Shih-Hao Huang, Chia-Jen Chang and Yi-Ling Cheng for their kind instruction of experiments. I also have to thank Hui-Ting Hsu for kindly instruction on the preparation of chicken embryo cardiomyocytes. My classmate, Hsueh-Han Lu, is always enthusiastic in helping me improve my ability of documentation. I also enjoyed discussion with the junior group members including Shao-Kang Huang, Hsin-Chun Huang, Cho-Yen Chou, Kevin Wang, Shi-Hong Zhuang, Yu-Cheng Lai, Ilin, Li and Yen-Ting Li. Ann takes care about all the members, who makes the lab energetic and joyful. I want to thank Drs. Wei-Tien Chang and Yao-ming Wu at the National Taiwan University Hospital and Prof. Hsin-Yun Hsu at National Chiao Tung University for invaluable advice on my research. Moreover, I would like to specially thank all my colleagues and classmates for sharing both good and bad things with me.
Due to their kind company during my research life and bringing lots of happiness for the laboratory, I could get through the difficulties of my research.
Finally, I would like to greatly thank my advisor, Prof. Ian Liau, for instructing me in learning to think widely, to orderly analyze questions and to efficiently solve difficulties. I also appreciate his instruction in my oral presentation and thesis writing. All of these training have gradually matured me in many aspects of my personality.
v
Table of Contents
Abstract (Chinese) ... i
Abstract (English) ... ii
Acknowledgements ... iii
Table of Contents ... v
Table of figures ... vii
1 Introduction ... 1
1-1 Function of the heart and cardiac cycle ... 1
1-2 Model systems for the study of hearts ... 3
1-3 Review of relevant techniques ... 6
1-4 Research scope ... 10
2 Principles ... 11
2-1 Microcantilever technology ... 11
2-2 Fluorescent detection of intracellular Ca2+ ... 15
3 Materials and Methods ... 16
3-1 Reagents ... 16
3-2 Protocols of introducing pharmacological interventions ... 17
3-3 Primary culture of ventricular cardiomyocytes ... 18
3-4 Apparatus for probing the membrane motion ... 20
3-5 Setup for fluorescent detection of intracellular Ca2+ ... 22
3-6 Data processing ... 24
4 Results and Discussion... 25
4-1 Spring constant calibration of cantilevers ... 25
4-2 Optimization of applied force ... 29
4-4 Agonist response of cardiomyocytes ... 38
4-5 Antagonist response of cardiomyocytes ... 41
4-6 Doxorubicin induced toxicity in cardiomyocytes ... 44
4-7 Simultaneous probing of intracellular Ca2+ and contractions ... 51
5 Conclusions ... 54
References ... 56
Appendixes ... 62
Poster “American Society for Cell Biology 2008” ... 62
Poster “The 1st NCTU-NAIST Workshop on Molecular/Nano Science 2009” ... 63
vii
Table of figures
Figure 1 Excitation-contraction coupling of cardiomyocytes... 5
Figure 2 Schematic of microcantilever technology employed to probe cardiomyocyte contractions ... 13
Figure 3 A representative displacement curve and the corresponding pulsation cycle ... 14
Figure 4 Primary culture of chicken embryo cardiomyocyte ... 19
Figure 5 Photograph of the apparatus. ... 21
Figure 6 Schematic of fluorescent detection of intracellular Ca2+ ions. ... 23
Figure 7 A representative force curve measured from an extension-retraction cycle ... 27
Figure 8 Representative power spectrum of a microcantilever. ... 28
Figure 9 Dependence of membrane displacement on the loading force ... 30
Figure 10 Bright field images of 6-day cultured chicken embryo cardiomyocytes under two plating density ... 33
Figure 11 The effect of plating density control on the pulsation behavior represented by time trace ... 34
Figure 12 The effect of density control to cardiomyocytes pulsation behaviors represented by spectrogram. ... 36
Figure 13 Agonist response of cardiomyocytes. ... 39
Figure 14 Antagonist response of cardiomyocytes. ... 42
Figure 15 Doxorubicin induced unstable pulsations. ... 47
Figure 16 Prevention of doxorubicin induced oxidative stress. ... 49
1 Introduction
1-1 Function of the heart and cardiac cycle
Cardiomyocytes are the origin of mechanical works in the heart. The coordinated synchronous contraction and relaxation of cardiomyocytes yield to regular beating of a heart that functions as a pump to propel blood out to the whole body. Cardiomyopathy can lead to heart failure as the pumping efficiency of the heart is diminished. People with cardiomyopathy are often at risk of arrhythmia and/or sudden cardiac death. As a result, much research effort has been directed aiming to understand the pathogenic mechanism of contractile dysfunction and to develop effective therapies against heart failure; both require detailed characterization of cardiac functions. The dysfunction of cardiomyocytes can lead to congestive heart failure, a deadly pathological condition costing tremendous medical expense to both individuals and a society.
Doctors require much detailed structural information of heart in clinical diagnosis. Cardiac output is the most important index for heart function evaluation. The contractile function of a heart is assessed by measuring the cardiac output, a quantity defined as multiplication of the stroke volume and the heart rate. The echocardiography is commonly used in measuring the cardiac output; the real-time imaging depicts the moving heart wall.1, 2 What’s more, the pressure in left ventricular also represents the output ability, which can be measured by implanting a miniature pressure gauge in the left ventricular.3
With evaluation of cardiac output, doctors know the heart function is normal or abnormal. However, the underlying reason that impaired the heart function is more important. To discover factors related to decreased cardiac output, the process of contraction should be studied in detail.
2 The process of heart contraction is cardiac cycle. Cardiac cycle is initiated by the electric impulse produced by sinoatrial node, then the electrical impulse propagated in heart wall, each heart chamber contracts when they received the electrical impulse. In our heart, the mechanical events of cardiac cycle is based on two state. One is systole, the ventricle contracts and propels the blood out. The other one is diastole, the ventricle relaxes and the blood refills the ventricle. If we see the cardiac cycle more detailed.
The first stage in systole is isovolumetric ventricular contraction, with all valve closed, the tension of ventricle increased and the volume of ventricle doesn’t changed; as soon as the ventricle pressure is higher than pulmonary and aortic valves pressure, the second stage happens, the blood is ejected into pulmonary artery and aorta by contracting ventricle. The first stage of diastole is isovolumetric ventricular relaxation, with all valve closed, the tension of ventricle decreased and the volume of ventricle doesn’t changed; as soon as the atria pressure higher than ventricle pressure, the blood refills the ventricle. Isometric contraction means the stage that the volume doesn’t changed, the volume called preload; while the isotonic contraction is the stage that the volume of ventricle is changing, the volume of ventricle called afterload.
The blood ejection is controlled by the pressure difference between the heart chamber and pulmonary artery or aorta pressure. The ejection fraction may decrease due to increased preload and afterload or low contractility of cardiomyocytes. Therefore, researchers tried to develop model systems with lesser confounding factors, systemic circulation, and a host of peripheral complications, such as circulating neurohormonal factors.
1-2 Model systems for the study of hearts
The isolated heart provides a highly reproducible experimental model, which can be studied quickly and in large numbers of species. It allows a broad spectrum of physiological and pharmacological indices to be measured. Langendorff-perfused heart model contains structural information, researchers are able to monitor the energetic and functional parameters of the myocardium ex vivo. The isolated perfused heart system is an excellent test bed for controlling contents and physical parameter of perfusates easily, lesser confounding factors than living subject test. It is important to consider that the isolated heart model allows experiments to be continued in the face of events (e.g., infarction-induced loss of pump function, cardiac arrest, or arrhythmias), which would normally jeopardize the survival of an in vivo experiment.4
Although the cardiac function has been commonly evaluated on intact hearts using echocardiography or by measuring the pressure-volume relationship. However,
in vitro characterization of cardiomyocyte pulsation offers a unique advantage. It
allows direct assessment of intervention with respect to contractile performance in the absence of loading conditions and neurohormonal activity.5 The early development of conduction in the heart has been studied mainly in avian embryos,6, 7 a single pacemaking area established at the inflow tract of the heartwhen 7 to 10 somites have developed (equivalent age of a human embryo of ~20 days).8 During fetal and postnatal development cardiomyocytes become terminally differentiated muscular cells that are connected end to end by gap junctions, allowing concerted contractile activity. Excitation-contraction coupling is a term coined in 1952 to describe the physiological process of converting an electrical stimulus to a mechanical response. As shown in Figure 1, during the cardiac action potential, Ca2+ enters the cell through depolarization-activated Ca2+ channels as inward Ca2+ current. Ca2+ entry triggers
4 Ca2+ release from the sarcoplasmic reticulum. The combination of Ca2+ influx and release raise the free intracellular Ca2+ concentration, allowing Ca2+ to bind to the troponin C, which then switches on the contractile machinery.
During developmental change of the heart, a part of cardiomyocytes specializes in conduction system, and the other cardiomyocytes take charge of mechanical work.9 Adult ventricular cardiomyocytes are only responsible to receive the current propagated from sinoatrial node, we can see the streak pattern of them by optical imaging due to abundant content of alpha-actinin. Mechanical properties of cardiomyocytes were investigated with trabeculae, which are adult cardiomyocytes skinned with triton X-100. Without the membrane permeability, manipulating the content of medium will direct impact the cardiomyocyte mechanical behavior.10
When the experiment of primary culture is performed before birth, we can derive embryo cardiomyocytes. Most of researchers choose chicken embryo, neonatal mouse or neonatal rat for easy preparation. With pacemaker activity, embryo cardiomyocytes are able to contract spontaneously. Compared with stem cell differentiated cardiomyocytes, embryo cardiomyocytes are more close to real case. That is, embryo cardiomyocytes deserve a good model to drug testing for the spontaneous contraction without differentiation issues.
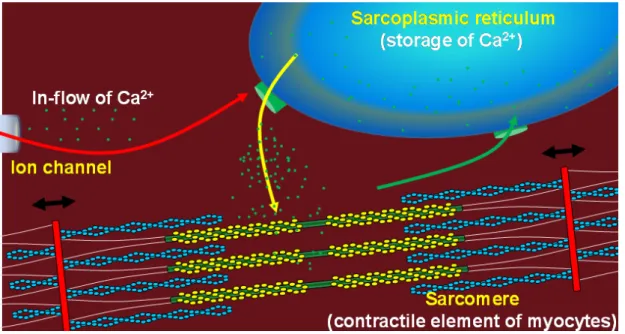
Figure 1 Excitation-contraction coupling of cardiomyocytes
During the cardiac action potential, Ca2+ enters the cell through depolarization-activated Ca2+ channels as a in-flow of Ca2+.(the red arrow) Ca2+ entry triggers Ca2+ release from the sarcoplasmic recticulum. (the yellow arrow) The combination of Ca2+ influx and release raise the free intracellular Ca2+ concentration, allowing Ca2+ to bind to the troponin C, the sarcomere length is shorten by relative motion of actin and myosin. When the intracellular Ca2+ concentration decreased, the sarcomere length will return to the original length. (the black arrow) The sarcoplasmic reticulum Ca2+-ATPase transfer Ca2+ from the cytosol of cell to the lumen of sarcoplasmic recticulum during cardiomyocyte relaxation. (green arrow)
6
1-3 Review of relevant techniques
A classical approach to characterize cardiomyocytes pulsation is based on human inspection; this is obviously not suitable for research that requires high throughput or quantitative results. Advances in the development of instruments have provided researchers unique opportunities to investigate the functional and structural aspects of living cells in unprecedented details. The contraction–relaxation cycle of cardiomyocytes is orchestrated by cyclic increases and decreases in intracellular Ca2+ initiated by depolarization of the sarcolemma and sustained by Ca2+ release and re-uptake by the sarcoplasmic reticulum.11 The free Ca2+ increases contraction of the myofilaments via its interaction with troponin C and subsequent enhancement of the interaction between myofilament proteins actin and myosin, leading to cell shortening.12 The three different kinds of signal, action potential, Ca2+ and contractility contribute to muscle contraction, all of them were studied by different tools for unmasking the excitation-contraction coupling.
The cardiac action potential has been studied by patch-clamp.13 In this technique a small heat-polished glass pipette is pressed against the cell membrane, forming an electrical seal with a resistance of 10 GΩ. The high resistance of this seal ensures that most of the currents originating in a small patch of membrane flow into the pipette, and from there into current-measurement circuitry. Unlike traditional two-electrode voltage clamp recordings, patch clamp recording uses a single electrode to record currents. Many patch-clamp amplifiers do not use true voltage clamp circuitry but instead are differential amplifiers that use the bath electrode to set the zero current level. This allows a researcher to keep the voltage constant while observing changes in current. Alternatively, the cell can be current clamped in whole-cell mode, keeping current constant while observing changes in membrane voltage.14
The intracellular Ca2+ transient has been studied by fluorescent Ca2+ indicators.15,
16 The principal biological Ca2+ indicators in current use are fluorescent compounds
that undergo large fluorescence enhancements or spectral shifts upon binding Ca2+. The success of these dyes in reporting accurate time-dependent [Ca2+] requires not only properly controlled studies but also appropriate choices of dyes for the specific intracellular conditions the Ca2+-probe will encounter. Key characteristics of fluorescent Ca2+-indicators that proven their usefulness include excitation and emission in visible wavelengths, fluorescence enhancements induced by Ca2+-binding and small Ca2+ dissociation constants (345 nM).
Methodologies for contractility assessments are majorly based on optical method. Two parameters for evaluation of contractions are the sarcomere length and length of the cardiomyocyte.
The sarcomere length could be obtained by laser diffraction technique. Adult cardiac muscle cell acts as a tridimensional grating due to the regular array of sarcomeres, and diffracts the laser lines along several orders. The spacing between zero and first-order of the Fraunhofer diffraction pattern was calculated according to the following equation:
/ sin
SL
=
λ
θ
Where SL is the mean sarcomere length, λ= 632.8 nm the wavelength of the laser, and θ the angular separation of the first-order diffraction line relative to the zero-order reference line.17
The length of adult cardiomyocyte could be obtained by determining the edge of the cardiomyocyte. The image of cardiomyocyte was projected onto a photodiode array. This magnification allowed the image of an actual length of 100 μm to cover 80 photosensitive elements. The photodiode array was positioned such that the
8 longitudinal axis of the cell image was always parallel to the array. With proper focusing, the cell image is darker than the cell surround so that those photodiodes underneath the cell image produce a smaller voltage signal than the remaining photodiodes. The cell edges are thus defined with the cell length being proportional to the number of photodiodes covered by the cell image.18-21
During contraction of cardiomyocytes, the cell volume is a constant value. The height of cardiomyocyte will increase when the length of cardiomyocyte is shortening. Therefore, the contractility could be assessed in an axis which is perpendicular to the substrate.
The scanning ion conductance microscope (SICM) consists of a glass micropipette probe filled with physiological medium. Since the medium contains Cl -ions, an ion current can be detected between the Ag/Cl electrode inside the pipette and the reference electrode in the bath when a voltage is applied. As the tip of the micropipette approaches the cell membrane, the ion conductance is reduced because the gap that ions can flow through is decreased. Changes of the ion current are monitored by a current amplifier, and the amplifier output is used by the microscope control unit as a feedback signal to keep the separation distance between electrode tip and sample constant by applying appropriate voltages to the z piezo drive. The micropipette was lowered into a bath toward the surface of the cell layer, measures the cell morphology within a few hundred of nanometer distance. Also the SICM is capable to monitor the displacement of cellular membrane.22
With invention of scanning probe microscopy (SPM), researchers were able to monitor sub-nanometer difference of height of sample surface. SPM was employed to characterize the cellular structure of the cardiomyocyte,23-28 also SPM that enables directly monitoring the displacement of cellular membranes with a sub-millisecond
temporal resolution and a sub-nanometer spatial resolution can open up new avenues to study cellular dynamics of cardiomyocyte.29-31
The SPM was used to quantify micromechanical properties of adult rat cardiomyocytes. Shroff et al. showed the contractile activity under different extracellular solution, adult atrial rat cardiomyocytes were superfused with 1.8 mM and 5 mM extracellular Ca2+ solution. With 1.8 mM extracellular calcium solution, the contraction frequency and amplitude were 0.197 ± 0.059 Hz and 519 ± 133 nm, respectively. After an increase in extracellular Ca2+ concentration to 5 mM, there was a large increase in contraction frequency (0.835 ± 0.188 Hz, P < 0.0001), with an essentially unchanged contraction amplitude (472 ± 109 nm).29 Domke et al. investigated the contraction behavior of chicken embryo cardiomyocytes and compared the characteristics of single cells with confluent layer of cells. They found significant differences in the stability of the contraction frequency. However, the shape of the contractions, in particular their width and the time of depolarization, varied markedly between individual cells.30
The fluorescent Ca2+ indicator was applied in studies of Ca2+ regulation in cardiomyocytes. The fluorescence intensity of Ca2+ indicator represented intracellular Ca2+. The dynamics of intracellular Ca2+ had been monitored under doxorubicin-induced oxidative stress. A decrease of sarcoplasmic reticulum Ca2+ load and hence Ca2+-induced-Ca2+ release has been observed with doxorubicin.32
10
1-4 Research scope
Herein, we report an application of SPM to characterize pharmacological intervention to the pulsation behavior of chicken embryo cardiomyocytes. Due to the high response of SPM, the position of pulsating cardiomyocyte’s membrane can be traced very well. We chose a soft microcantilever, controlling the minimum force applied on cardiomyocytes. The high temporal and spatial resolution of SPM is an excellent candidate for elucidating mechanical behaviors of cardiomyocytes. We directly observe the stimulating and antagonistic effects of the beta adrenergic receptor mediated by the administration of epinephrine and esmolol. A spectrogram based graphic representation that allows intuitive identification of pulsation dynamics has also been demonstrated. The combination of fluorescence detection and SPM allows us to simultaneously probe Ca2+ and contractions, it gives an insight into dynamics of excitation-contraction coupling.
2 Principles
2-1 Microcantilever technology
SPM with a sharp probe is able to depict the sample surface by different interaction between probe and sample, which is talent for nanostructure surface analysis. Binning and Rohrer invented scanning tunneling microscopy (STM) in 1982;33 open a new avenue in surface atomic structure. After that, Binnig et al. invented the atomic force microscopy (AFM) which broke the conductive-sample-only limitation in STM,34 researchers were able to “touch” the nonconductive sample surface with sub-nanometer resolution since 1985. We employ this technique to monitor the cell movement.
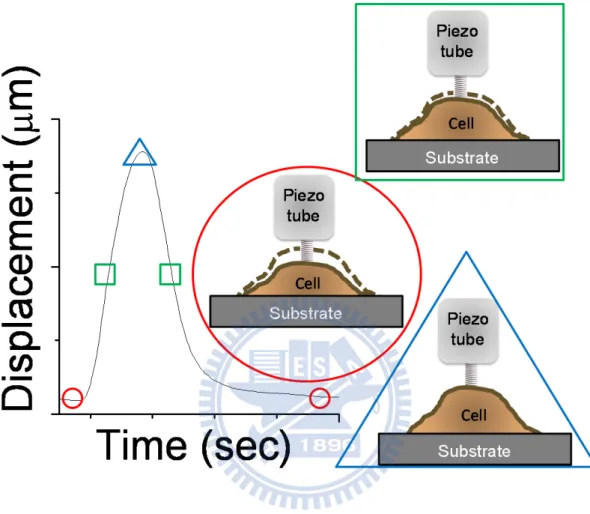
We put a soft microcantilever on a cell for sensing the cell movement in contact mode. As shown in Figure 2, the micorcantilever-deflected laser beam strikes the position sensitive photon-diode detector (PSPD). PSPD consist of four photodiodes, the adjacent photodiode signal difference indicates the position of laser spot and thus cantilever deflection. The position of microcantilever is controlled by piezoelectric scanner. For constant force mode, the cantilever deflection should keeps at a constant value. By applying bias on piezotube inside the piezoelectric scanner, the length of piezotube can be controlled in sub-angstrom level. Therefore, the operation of SPM is the combination of piezoelectric scanner and feedback-loop system. The length of piezotube is adjusted for keeping the same cantilever deflection, while the change of piezotube length represents the cell movement. This technique with sub-millisecond temporal and sub-nanometer spatial resolution is ideal for delicate illustration of transient biological events.35 We showed the linking between physiological meaning and captured time trace data in Figure 3, with marks on the time trace for expressing different state of the cardiomyocyte. The soft cantilever could be considered as a
12 spring when the swing is small, the bended amount of cantilever represented by the reduced length of spring. On the time trace, the round circle represented diastole state of the pulsated cardiomyocyte; the triangular frame represented systole state of the pulsated cardiomyocyte; the rectangular frame represented the transient pulsation state of the cardiomyocyte.
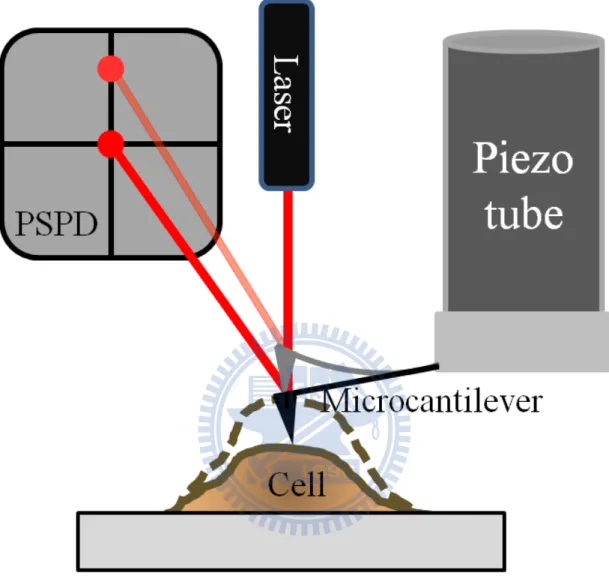
Figure 2 Schematic of microcantilever technology employed to probe cardiomyocyte contractions
When the cardiomyocyte was contracting, as soon as the cell membrane moved the cantilever will trace the position of the cell membrane. The dark microcantilever showed the cardiomyocyte was relaxed. When the position of cell membrane changed, the gray microcantilever was bended and the position of laser spot on PSPD also changed.
14
Figure 3 A representative displacement curve and the corresponding pulsation cycle
With marks on the time trace for expressing different state of measurement. On the time trace, the round circle represented diastole state of the pulsated cardiomyocyte, also the triangular frame represented systole state of the pulsated cardiomyocyte. The rectangular frame represented the transient pulsation state of the cardiomyoycyte.
2-2 Fluorescent detection of intracellular Ca
2+The development of reliable and convenient indicators of intracellular Ca2+ concentration ([Ca2+]) has been of inestimable value for progress in many fields within life sciences and biomedical research. Temporal and spatial variations of Ca2+ concentrations within a single cell can be exceedingly large. In a physiologically active neuron, for example, active Ca2+ transport processes can create a 105 units gradient of [Ca2+] across the plasma membrane, and in a matter of milliseconds a physiological stimulus can induce massive Ca2+ fluxes into the cytosol that reduce the gradient by more than 103 units. That cell might then recover to resting Ca2+ levels by active processes in a few seconds. Studies that have uncovered these remarkable features have relied on a variety of accurate measures of [Ca2+] in several different concentration ranges.
There are several different bulk loading procedures applicable to large populations; the most commonly used is acetoxymethyl (AM) ester loading. This noninvasive technique uses compounds where the carboxylate groups of the indicator dyes have been derivatized as acetoxymethyl esters resulting in a nonpolar compound that is permeable to cell membranes. Once inside the cell, these compounds are hydrolyzed by intracellular esterases. Once acted upon by esterases, the resultant activated indicator is now a polar molecule that is no longer capable of freely diffusing through the cell membrane, essentially trapping the compound inside the cell. AM Ester cell loading, while the easiest and most straightforward method to bulk load cells.
16
3 Materials and Methods
3-1 Reagents
Epinephrine, esmolol hydrochloride, vitamin C, doxorubicin and dimethyl sulfoxide, sodium chloride (NaCl), potassium chloride (KCl), sodium carbonate (NaHCO3), magnesium sulfate (MgSO4), sodium phosphate (NaH2PO4), calcium
chloride (CaCl2) and glucose were purchased from Sigma Aldrich. Calcium- and
magnesium-free Hanks’ balanced salt solution (HBSS), trypsin, trypsin inhibitor, bovine albumin, M199, heat-inactivated fetal bovine serum, fluo-4 Ca2+ indicator and penicillin (100 U/ml)-streptomycin (100 μg/ml) solution, were purchased from Invitrogen.
3-2 Protocols of introducing pharmacological interventions
Before each pharmacological intervention, we recorded data for 300 seconds long as a control group for the initial cardiomyocyte pulsation behaviors. In experiment of agonist response, antagonist responses and doxorubicin toxicity test, solutions containing epinephrine, esmolol hydrochloride and doxorubicin were added in the Petri dish between control group and experiment group, respectively. Before adding drug containing solution into the medium, we diluted denser drug solution with prewarmed medium 1 ml, and then we add the mixed solution into the Petri dish. We waited 3 minutes for the added solution and medium both mixing well and fluctuation in medium ceased. Then we captured data for 600 seconds long as experiment group. For vitamin C protection test, we had tested vitamin C (100 μM) will not affect both the cardiomyocyte membrane displacement and the pulsation frequency (data not shown). In the experiment of prevention of doxorubicin induced oxidative stress, we pretreated the vitamin C (100 μM) overnight before experiment, still we can see the cardiomyocyte membrane displacement and the pulsation frequency were stable in the result part.
18
3-3 Primary culture of ventricular cardiomyocytes
Chicken embryo cardiomyocytes were prepared using a method modified from the literature.36 The heart from 11-day-old chicken embryo was removed aseptically and placed in HBSS, and ventricular tissue was minced into ~0.5 mm fragments. Enzymatic dispersion of the tissue was performed with 0.025 % (vol/vol) trypsin at 37 °C with use of four to six 8min cycles. Supernatant containing dissociated cells was placed in 15 ml of cold 0.015 % (wt/vol) trypsin inhibitor, 2.5 % (wt/vol) bovine albumin, 42 % M199, and 58 % balanced salt solution (BSS: 116 mM NaCl, 2.5 mM KCl, 22 mM NaHCO3, 0.8 mM MgSO4, 1.0 mM NaH2PO4, 0.87 mM CaCl2, 5.6 mM glucose) and centrifuged at 1200 rpm at 4 °C for 5 min. The remaining supernatant was discarded. The pellet was resuspended in culture medium consisting of 6 % heat-inactivated fetal bovine serum, 40 % M199, penicillin (100 U/ml)-streptomycin (100 μg/ml) solution, and 54 % BSS ( 117 mM NaCl, 4.0 mM KCl, 1.2 mM CaC12, 0.8 mM MgSO4, 22 mM NaHCO3, 1.0 mM NaH2PO4, 5.6 mM glucose). This suspension was preplated at 37 °C in an atmosphere with 5% CO2 and
98% relative humidity in a incubator for 45 min at 37 oC to eliminate fibroblast contamination. Cell yield was 5-6 × 10⁵ cells/ embryo. The final suspension of cells was diluted to 105 cells/ml. The medium which contained ~2 × 10⁴ cells was pipette onto 60 mm plastic dish (Corning). Cells were further cultured at 37 °C in an atmosphere with 5 % CO2 and 98 % relative humidity in an incubator. The culture
medium was changed every other day. Cells began to exhibit spontaneous contractions after 24-48 h of culture. Experiments were employed on cells after 6 days of culture.
Heart of 11-day old chicken embryo
Enzymatic digestion of the minced heart 6-day cultured
cardiomyocytes
The ventricle was selected by cutting it from mid-line, then minced by sterile scissors
Plating with suitable cell concentration
Figure 4 Primary culture of chicken embryo cardiomyocyte
The heart of 11-day old chicken embryo was took out and minced. After the minced heart digesting by trypsin solution, released cardiomyocytes were selected by preplating then plated the suspended cells in a culture dish. Experiments were performed after 6-day cultivation
20
3-4 Apparatus for probing the membrane motion
Cardiomyocyte pulsations were measured using a commercial SPM (Bioscope SZ, Veeco, USA) that was integrated with an inverted optical microscope (TE-2000-S, Nikon, Japan). We showed our setup in Figure 5, the whole setup was enclosed in a chamber that was maintained at 37 oC and in an atmosphere with 5 % CO2 to allow long
term measurements on living cells; the cantilever was employed to trace the cell membrane movement. To minimize the force exerted on the cardiomyocyte, relatively soft silicon nitride cantilevers (MLCT, Veeco, USA) with a spring constant about 0.016 N/m were used. This spring constant was estimated from the resonance frequency of the cantilever which was experimentally determined from the spontaneous thermal motion of the cantilever. To probe the pulsation of the cardiomyocyte, the cantilever was brought in gentle contact with the cell membrane by the step motor. During the step motor approaching, the SPM turned on the feed-back loop on the cantilever. The SPM started to record the piezo length while the bended amount of the cantilever reached the setpoint. During measurements, the bended amount of the cantilever kept constant by controlling the length of the piezo via feed-back loop. The bended amount of the cantilever, and thus the force exerted on the cell membrane (~ 4 nN), was maintained constant by dynamically adjusting the separation between the cantilever and the cell membrane. Under this “constant force mode”, scan size was set to 0 nm, the displacement of the cell membrane was traced by the cantilever. The position of the piezo was recorded to represent the pulsation of the cell. Under our environmentally controlled chamber, cells remained spontaneous pulsing for 2 to 4 hrs depending on batches. The amplitude of the pulsation reduced to about 50 % of its initial value after 1.5 hour. All data presented here were obtained within the first 30 min after cells were removed the incubator.
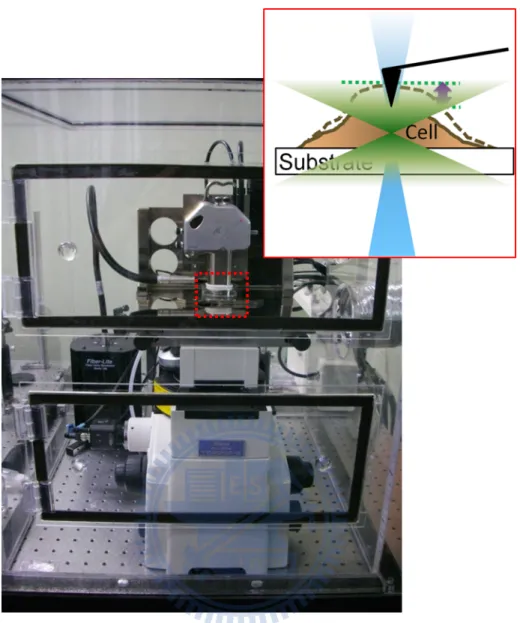
Figure 5 Photograph of the apparatus.
A SPM could operate in a constant-force mode, also we observed the pulsating cardiomyocytes by a 10 X microscope objective lens and a silicon nitride cantilever was employed to trace the membrane displacement during cardiomyocyte pulsations. Also the combination of SPM and inverted microscope allowed us to detect fluorescence signals (the detailed optical setup discussed in 3-6). The acrylic box filled with 37 oC air and 5 % CO2 is suitable for long-term observation.
22
3-5 Setup for fluorescent detection of intracellular Ca
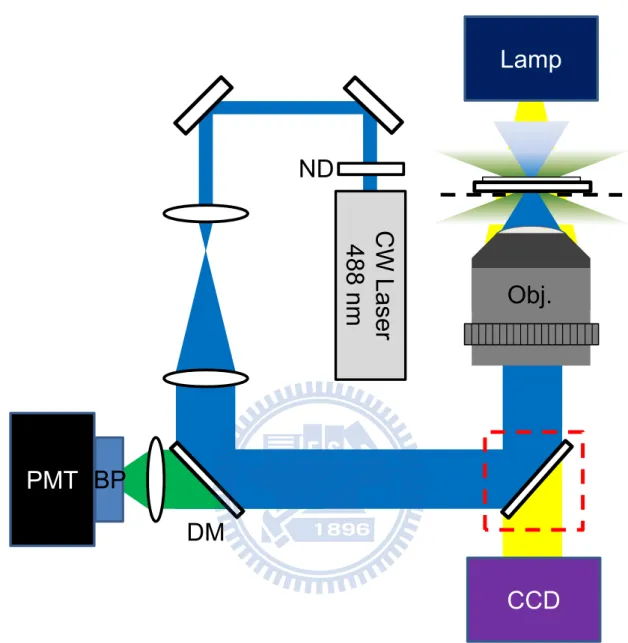
2+The excitation of the system is based on 488 nm laser (IMA1, Melles Griot, USA), the laser power was reduced to 50 μW by a neutral density filter. A number of dielectric-coated mirrors (BB1-E02, Thorlabs, U.S.A.) were used to reflect the visible excitation. In order to fill the back aperture of microscope objective lens, a telescope consisting of two focal lenses with focal length of 50 mm and 200 mm was applied to expand the beam size. The excitation laser beam was reflected and directed into the backport of an inverted microscope (TE2000-S, Nikon, Japan) with a long-wave pass dichroic mirror, and was focused onto the sample with a microscope objective lenses (60X PlanApo, air, numerical aperture 0.95, Nikon, Japan). The emitted fluorescence signal was collected by the same microscope objective lenses, and then transmitted the long-wave pass dichroic mirror. The scattered and reflected excitation laser beam was blocked by a bandpass filter, which was mounted in a lens tube attached to the photomultiplier tube (H7827-012, Hamamatsu, Japan). The emitted fluorescence signal was collected by a photomultiplier tube, then the output voltage signal from photomultiplier tube was recorded by the Bioscope controller.
To probe the cytosolic Ca2+ transient in the chicken embryo cardiomyocytes, the fluo-4 Ca2+-indicator was diluted into 18 μM by the medium; we treated cardiomyocytes with this solution for 30 minutes in the incubator. The fluo-4 Ca2+-indicator-contained medium was replaced by normal medium before experiment.
Lamp
PMT
DM
Obj.
CW Laser
488 nm
ND
BP
CCD
Figure 6 Schematic of fluorescent detection of intracellular Ca2+ ions.
CW laser 488 nm: continuous wave laser 488 nm; ND: neutral density filter; DM: dichroic mirror; Obj.: microscope objective lens; CCD: charge-coupled device; BP: bandpass filter; PMT: photomultiplier tube. Bright field imaging was achieved by removing the mirror. (red rectangular)
24
3-6 Data processing
During tracing the cardiomyocyte membrane position, the length of the piezo was recorded as height signal; the signal was sampled at interval of 0.00488 seconds for 300 or 600 seconds long, which were recorded by SPM inbuild program as a figure. The scan size was zero, the coordinate in the figure represented different time. Firstly, we rearranged the time series of the figure by Matlab 2008 then recorded in a word file. Secondly, we plotted our data, the time trace of cardiomyocyte membrane displacement by Origin 8. We analyzed 100 peaks in the time trace showed in the result part, the time domain of 100 peaks are near to the shown time trace, the peak value of displacement and time of each peak are expressed as mean ± S.E.M. Thirdly, the data was analyzed by short-time Fourier transformation (STFT) which was built in Origin 8.
(
)
(
( )
)
(
(
) ( )
)
(
) ( )
(
)
1 0,
R i n nm
STFT x n
DTFT x n m w n
x n m w n e
ωω
− − =Χ
=
≡
−
=
∑
−
(1)( )
x n is the data we wanted to know the trend of frequency proceeded with time.
( )
w n is a window function for selection of discrete data, for selected window length R, zeros will be padded on both sides of each windowed data segment. The discrete-time Fourier transformation (DTFT) was performed at each data segments. The result of DTFT is Χ
(
ω, m)
, which is a matrix composed of frequency (ω ) and time (m).The output of matrix was plotted in 3D figures, proportional time axis displayed in control group (300 seconds) and experiment group (600 seconds). We can see the frequency is a straight line parallel to time axis in control group, represented the pulsation frequency of the cardiomyocyte is stable with time.
4 Results and Discussion
4-1 Spring constant calibration of cantilevers
The cantilever of SPM vibrates at a small angle and amplitude, it is considered as a spring. We can calculate the force exerted on the spring by applying Hooke’s law, also we know the displacement of the spring, the cantilever spring constant can be calibrated by thermal tune method in NanoScope software (Veeco, USA).
First we have to do force curve on an infinite hard substrate. In Figure 7, the piezo tube elongates along z axis, the bending amount of the cantilever increased with elongation, also the laser beam position reflected by cantilever recorded by a PSPD in voltage unit, by calculating the slope of the relationship between length and voltage, we get the deflection sensitivity of the cantilever. This constant helps us to convert the bending amount of cantilever in voltage unit into length unit in later experiments.
Second we need to calibrate the cantilever spring constant by doing power spectral density analysis. According to the equipartition theorem, which states that energy is shared equally among all energetically accessible degrees of freedom of a system, in simple harmonic oscillation in one axis, the kinetic energy equals its potential energy, we consider elastic potential energy in this case. So we get this relationship between kinetic energy and elastic potential energy:
2 2
0 B
1
1
m z =
k T
2
ω
2
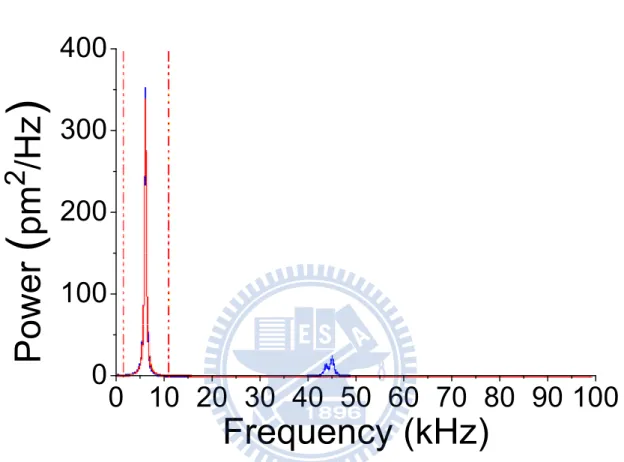
(2)Then we do thermal tune analysis of the cantilever, the thermal fluctuation of the cantilever recorded by detector is calculated by Fourier transform. In Figure 8, we will see the peak in the power spectral density spectrum, which shows characteristic resonance frequency of the cantilever, and we integrate the area below the peak, that is the root-mean square value of the cantilever fluctuation.
26 Third, by introducing 0
=
k
m
ω
, we simplify the equation (2) into equation (3):2 B
k = k T z
(3)With known temperature and Boltzmann constant, we can get the cantilever spring constant. The force exerted on the cardiomyocyte equals the bending amount of cantilever multiplies the cantilever spring constant.
0
500
1000
1500
2000
-8
-6
-4
-2
0
2
0
500
1000
1500
2000
-8
-6
-4
-2
0
2
Extension
Deflection (V)
Z (nm)
Retraction
Figure 7 A representative force curve measured from an extension-retraction cycle
The extension represents the microcantilever was approaching to the sample surface; the retraction represents the microcantilever was leaving the sample surface. The slope of the linear part is the deflection sensitivity, which is 243.8 nm/V.
28
0 10 20 30 40 50 60 70 80 90 100
0
100
200
300
400
Power
(
pm
2
/Hz
)
Frequency (kHz)
Figure 8 Representative power spectrum of a microcantilever.
The characteristic frequency is 6.86 kHz. The integral of area below the peak is the root-mean square value of the cantilever fluctuation.
4-2 Optimization of applied force
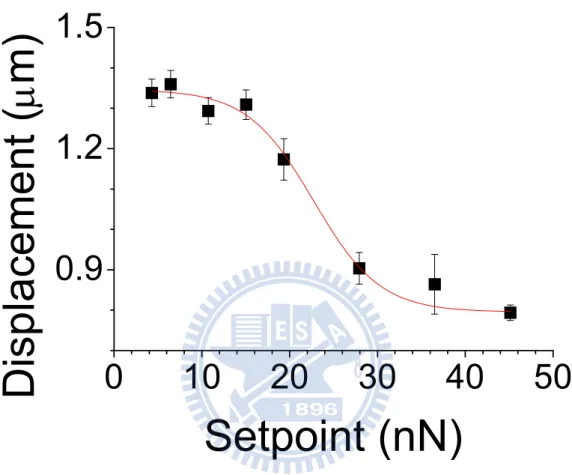
During cardiomyocytes membrane displacement measurements, the pulsated cardiomyocyte pushed up the cantilever on it when systole. However, the cardiomyocyte should be considered as a soft material. We have to optimize the force applied on the cardiomyocyte in case the force is so high that the cardiomyocyte pulsation suppressed by our cantilever. Therefore, we measured the membrane displacement at different forces applied on the cardiomyocyte. In Figure 9, by changing the force applied on the cardiomyocyte, we can see the membrane displacement was suppressed by higher loading on it, the membrane displacement dropped down when the loading force was 20 nN. The feed-back loop in SPM keeps the separation between the cantilever and the cell membrane, but still a limit of SPM feed-back loop there. By increasing the i gain and p gain in the controlling program, we can trace the membrane movement more accurately. Under the maximum integral gain and proportional gain without cantilever oscillation, there are still small cantilever fluctuations. In order to measure isotonic contraction of cardiomyocytes, the force applied on the cell should be higher than the fluctuation. The minimum force we applied on the cardiomyocyte to ignore the fluctuation was about 4 nN. The measured displacement before 4 nN due to instrumental error that the cantilever couldn’t trace the membrane very well just like false engaging, so we saw the membrane displacement was lower than the displacement at 4 nN.
30
0
10
20
30
40
50
0.9
1.2
1.5
Displacement (
μ
m)
Setpoint (nN)
Figure 9 Dependence of membrane displacement on the loading force
When the loading force is higher than 20 nN, the measured cardiomyocyte membrane displacement is smaller due to overloading force applied on the cardiomyocyte. However, when the loading force is near 4 nN, the measured cardiomyocyte membrane displacement reaches a maximum value.
4-3 Effect of density to pulsation behaviors
For monitoring the membrane movement of cardiomyocyte, the constant force applied on it was characterized. Reasonable explanation for the suppressed membrane displacement can be related to the elastic component in cardiomyocytes. When the force increased to 20 nN, we saw the pulsation displacement started to decline, this result also consistent with previous work (the loading force up to 10 nN had no detectable influence on the membrane displacement).30
We first examined the time traces of pulsation for single cells cultured in different cell densities. For a confluent layer of cells, the recorded time trace is very regular indicating that cells cultured in a confluent layer (2 × 10⁴ cells/dish, Figure 10(A)) exhibit synchronous and stable pulsation (Figure 11(A)). In contrast, the pulsation behavior for cells in a sub-confluent layer (104 cells/dish, Figure 10(B)) is irregular (Figure 11(B)); the cells stop pulsing and remain in a quiescent state occasionally exhibiting a characteristic behavior resembling that of arrhythmia. Interestingly, the time trace shows that the pulsation amplitude does not seem to vary significantly despite that the pulsation frequency seems to vary drastically from time to time. This result demonstrates the capability of SPM to delicately characterize the pulsation behavior of cardiomyocytes cultured in different cell densities. To gain insight of the dynamic aspect of these pulsation behaviors, we employ short-time Fourier transform (STFT) to obtain the time-varying frequency of cardiomyocyte pulsations. As expected, the spectrogram of pulsations for cardiomyocytes embedded in a confluent layer shows a characteristic frequency with no appreciable change along with time (Figure 12(A)). In contrast, the spectrogram of pulsations obtained from cells embedded in a sub-confluent layer carries no distinct characteristic frequency (Figure 12(B)). As demonstrated, the spectrogram obtained from STFT analysis clearly illustrates the
32 dynamic behavior of pulsation. We will show that this intuitive while informative representation of a dynamic change is particularly useful to assess the function of cardiomyocytes.
We control the cell density of sub-confluent layer and confluent layer of cardiomyocytes. The tight junction between cells only achieved in confluent layer of cardiomyocytes, synchronize contractions were observed in bright field image. However, the sub-confluent layer of cardiomyocytes contracted in similar amplitude with unstable pulsation frequency compared with confluent layer. We can see the contractility of each cardiomyocyte in sub-confluent layer is almost the same because of the same physiological condition, only the irregular frequency caused by bad junctions. For the drug testing model, the pulsation behavior of confluent layer of cardiomyocytes is more suitable.
20 μm
20 μm
(A)
(B)
Figure 10 Bright field images of 6-day cultured chicken embryo cardiomyocytes under two plating density
(A) The plating density is 2 × 10⁴ cells/dish; tight junctions were formed between cardiomyocytes. (B) The plating density is 104 cells/dish; junctions between cardiomyocytes are rare.
34
(B)
0
50
100
150
200
0.0
0.4
0.8
102 104 106 108 110 112
0.0
0.4
0.8
Displacement
(
μ
m
)
Time (sec)
(A)
0
50
100
150
200
0.0
0.3
0.6
74
76
78
80
82
84
0.0
0.3
0.6
Displacement (
μ
m)
Time (sec)
Figure 11 The effect of plating density control on the pulsation behavior represented by time trace
(A) We can see the pulsation displacement and pulsation frequency of confluent layer of cardiomyocytes is 0.562 ± 0.003 μm and 1.658 ± 0.010 Hz, respectively. (B) Time trace of sub-confluent layer pulsation behaviors, with small differences in
displacements between each pulsation in 600 seconds. We can see the pulsation displacement and pulsation frequency is 0.570 ± 0.014 μm and 1.561 ± 0.065 Hz, respectively.
36
(B)
(A)
Figure 12 The effect of density control to cardiomyocytes pulsation behaviors represented by spectrogram.
(A) Time trace of confluent layer pulsation behaviors showed very stable pulsation behaviors in displacements and frequencies in 600 seconds. The spectrogram of cardiomyocytes embedded in a confluent layer shows a characteristic frequency with
no appreciable change along with time. (B) The spectrogram of cardiomyocytes embedded in a sub-confluent layer carries no distinct characteristic frequency in 600 seconds, which showed the time-varying pulsation frequencies, which pulsation frequencies were irregular.
38
4-4 Agonist response of cardiomyocytes
We moved on to assess pharmacological intervention of cardiomyocyte pulsations. We chose cells that were cultured in a confluent layer and possessed stable pulsations as a control and studied how agonists modulate the pulsation behavior. As shown in Figure 13(A), we did experiments in a continuous time series. The control group pulsation behavior of cardiomyocytes remains stable exhibiting a characteristic frequency of 0.985 ± 0.010 Hz along with time before the administration of epinephrine; the pulsation displacement is 1.655 ± 0.002 μm. After the administration of 10 μM epinephrine, the pulsation frequency is 3.134 ± 0.031 Hz; the pulsation displacement is 2.106 ± 0.009 μm. Control group spectrogram showed in Figure 13(B), there is no appreciable change in the characteristic frequency along with time. Experiment group spectrogram showed in Figure 13(C), the pulsation frequency increased progressively, by a factor of 3.36 from its basal value after 10 minutes; the pulsation amplitude increased 1.27 times right after administration.
0 150 300 600 750 900 1050 0 1 2 3
Displacem
ent (
μ
m)
1044 1046 1048 1050 1052 10540.0 0.7 1.4 2.1Time (sec)
126 128 130 132 134 136 0.0 0.7 1.4 2.1Displacement (
μ
m)
Time (sec)
(A)
(B)
(C)
Figure 13 Agonist response of cardiomyocytes.
(A) Continuous time trace of the cardiomyocyte membrane displacement before and after 10 μM epinephrine intervention. 10 seconds long pre-treatment membrane displacement time trace was enlarged, the pulsation displacement and the pulsation frequencies is 1.655 ± 0.002 μm and 0.985 ± 0.010 Hz, respectively; 10 seconds long post-treatment membrane displacement time trace was enlarged,
40 under agonist intervention, pulsation behaviors strengthen with time, the pulsation displacement and the pulsation frequency is 2.106 ± 0.009 μm and 3.134 ± 0.031 Hz, respectively. (B) The spectrogram of control group showed a characteristic frequency with no appreciable change along with time. (C) Under epinephrine intervention, the spectrogram of experiment group showed an increased trend.
4-5 Antagonist response of cardiomyocytes
The cardiac response to antagonists can also be assessed in the same manner. We demonstrate this effect with a beta receptor blocker, esmolol hydrochloride, which has been known to possess a rapid onset in inhibiting cardiac contraction. As shown in the time trace Figure 14(A), we did experiments in a continuous time series. The control group pulsation behavior of cardiomyocytes remains stable exhibiting a characteristic frequency of 1.968 ± 0.017 Hz along with time before the administration of esmolol hydrochloride; the pulsation displacement is 0.497 ± 0.002 μm. After the administration of 60 μM esmolol hydrochloride, the pulsation frequency is 1.516 ± 0.004 Hz; the pulsation displacement is 0.324 ± 0.017 μm. Control group spectrogram showed in Figure 14(B), the characteristic frequency is no appreciable change along with time. Experiment group spectrogram showed in Figure 14(C), the pulsation frequency decreased progressively, by a factor of 0.77 from its basal value after 10 minutes; the pulsation amplitude decreased 0.65 times right after administration.
42
(A)
(B)
0 150 300 600 750 900 1050 0.0 0.3 0.6Displacement
(
μ
m
)
200 202 204 206 208 210 0.0 0.3 0.6Di
spl
acem
ent (
μ
m)
Time (sec)
1070 1072 1074 1076 1078 1080 0.0 0.3 0.6Time (sec)
(C)
Figure 14 Antagonist response of cardiomyocytes.
(A) Continuous time trace of the cardiomyocyte membrane displacement before and after 60 μM esmolol hydrochloride intervention. 10 seconds long pre-treatment membrane displacement time trace was enlarged, the pulsation displacement and the pulsation frequencies is 0.497 ± 0.002 μm and 1.968 ± 0.017 Hz, respectively; 10 seconds long post-treatment membrane displacement time trace was enlarged, under
antagonist intervention, pulsation behaviors weaken with time, the pulsation displacement and the pulsation frequency is 0.324 ± 0.017 μm and 1.516 ± 0.004 Hz, respectively. (B) The spectrogram of control group showed a characteristic frequency with no appreciable change along with time. (C) Under esmolol hydrochloride intervention, the spectrogram of experiment group showed a decreased trend.
44
4-6 Doxorubicin induced toxicity in cardiomyocytes
Doxorubicin is a drug used in cancer chemotherapy and is known to induce oxidative stress resulting in heart arrhythmias. As shown in the time trace in Figure 15(A), we did experiments in a continuous time series. The control group pulsation behavior of cardiomyocytes remains stable exhibiting a characteristic frequency of 1.307 ± 0.002 Hz along with time before the administration of doxorubicin; the pulsation displacement is 1.082 ± 0.002 μm. We show the administration of 4 μM doxorubicin causes drastically changes the pulsation amplitude. The time-trace of experiment group shows that cells change into quiescent states occasionally. In the enlarged part of time trace, the pulsation frequency is 1.734 ± 0.091 Hz; the pulsation displacement is 0.838 ± 0.084 μm. Control group spectrogram showed in Figure 15(B), the characteristic frequency is no appreciable change along with time. Experiment group spectrogram showed in Figure 15(C), during the pulsation state, the pulsation frequency also varies from time to time, the pulsation frequency decreased with time in each pulsating period.
The development of doxorubicin-induced cardiomyopathy has been proposed to explain by different mechanisms, but most of these changes could be attributed to oxidative stress injury.37-41 Flavoenzymes use NAD(P)H as an electron source, the enzymes mediate the transfer of electrons to the quinone of the anticancer agent chemically reducing it to the semiquinone. Subsequent electrons transfer to oxygen from the semiquinone results in the formation of superoxide radical anion. This redox cycle continues until the system becomes anaerobic at which time the oxygen radical production decreases and the semiquinone begins to accumulate to detectable levels.42
The oxidative stress can be suppressed by antioxidant, we chose vitamin C as an antioxidant in prevention of doxorubicin induced oxidative stress. We pretreated
vitamin C and incubated overnight in the incubator. As the time trace in Figure 16(A), we did experiments in a continuous time series. The pulsation behavior of vitamin C pretreated cardiomyocytes remains stable exhibiting a characteristic frequency of 1.518 ± 0.001 Hz along with time before the administration of doxorubicin; the pulsation displacement is 0.736 ± 0.002 μm. After the administration of 4 μM doxorubicin, the pulsation frequency is 1.616 ± 0.002 Hz; the pulsation displacement is 0.494 ± 0.002 μm. Control group spectrogram showed in Figure 16(B), the characteristic frequency is no appreciable change along with time. Experiment group spectrogram showed in Figure 16(C), we can see the pulsation amplitude and pulsation frequency are both changed but stable with time.
Chicken embryo cardiomyocyte under administration of doxorubicin stopped pulsation temporarily. The regulation of rhythmic pulsation effected by doxorubicin may arise from ion permeability and transport in the cell membranes, also the membrane resting potential was higher after doxorubicin administration.43 The membrane resting potential may recovered during the quiescent state that cardiomyocytes recovered and undergoing tachycardia and arrhythmia pulsations. As many mechanisms were proposed to doxorubicin-induced cardiomyopathy, therapies to keep cardiomyocytes in well-behaved conditions are variety. Here we employed vitamin C as a scavenger to prevent doxorubicin-induced oxidative stress. This mode of transport and accumulation of vitamin C is universal as all cells have facilitative glucose transporters on the cell membrane.44 Oxidative stress produced by doxorubicin and the doxorubicin-induced elevation of reactive oxygen species generation were attenuated by vitamin C had been verified by dichlorodihydrofluorescein diacetate fluorescence.45 However, we found the vitamin C only prevent the cardiomyocyte turning into quiescent state, the post-treatment pulsation amplitude and frequency are both changed, regulation of rhythmic pacing was saving by pretreatment of vitamin C.
46 With vitamin C pretreatment, cardiomyocytes kept pulsated at least more two days, while cardiomyocytes only treated with doxorubicin ceased within several ten minutes.
950 952 954 956 958 9600.0 0.4 0.8 1.2
Time (sec)
(A)
200 202 204 206 208 210 0.0 0.4 0.8 1.2Displacem
ent
(
μ
m)
Time (sec)
0 150 300 600 750 900 1050 0.0 0.4 0.8 1.2Displacement (
μ
m)
(B)
(C)
Figure 15 Doxorubicin induced unstable pulsations.
(A) Continuous time trace of the cardiomyocyte membrane displacement before and after 4 μM doxorubicin intervention. 10 seconds long pre-treatment membrane displacement time trace was enlarged, the pulsation displacement and the pulsation frequency is 1.082 ± 0.002 μm and 1.307 ± 0.002 Hz, respectively; under doxorubicin intervention, displacements showed that cardiomyocytes changed into quiescent states
48 occasionally (the quiescent time was from 30 seconds to 105 seconds); 10 seconds long post-treatment membrane displacement time trace was enlarged, the pulsation displacement and the pulsation frequency is 0.838 ± 0.084 μm and 1.734 ± 0.091 Hz, respectively. (B) The spectrogram of control group showed a characteristic frequency with no appreciable change along with time. (C) Under doxorubicin intervention, the pulsation frequency also varied from time to time during the pulsation state.
0 150 300 600 750 900 1050 0.0 0.3 0.6 0.9
Displacement
(
μm)
210 212 214 216 218 220 0.0 0.3 0.6 0.9Di
spl
acem
ent
(
μm
)
Time (sec)
680 682 684 686 688 690 0.0 0.3 0.6 0.9Time (sec)
(A)
(B)
(C)
Figure 16 Prevention of doxorubicin induced oxidative stress.
(A) Continuous time trace of the 100 μM vitamin C pretreated cardiomyocyte membrane displacement before and after 4 μM doxorubicin intervention. 10 seconds long membrane displacement time trace of vitamin C pre-treated cardiomyocytes was enlarged, the pulsation displacement and pulsation frequency is 0.736 ± 0.002 μm and 1.518 ± 0.001 Hz, respectively; 10 seconds long membrane displacement time trace of doxorubicin treated cardiomyocytes was enlarged, the pulsation displacement and the
50 pulsation frequency is 0.494 ± 0.002 μm and 1.616 ± 0.002 Hz, respectively. (B) The spectrogram of control group showed a characteristic frequency with no appreciable change along with time. (C) Under doxorubicin intervention, the spectrogram of vitamin C pretreated experiment group showed a characteristic frequency with no appreciable change along with time.
4-7 Simultaneous probing of intracellular Ca
2+and contractions
The combination of fluorescence detection and SPM allows us to simultaneously probe Ca2+ and contractions, it gives an insight into dynamics of excitation-contraction coupling. The fluorescence signal is proportional to the intracellular Ca2+ concentration. In Figure 17(A), the time trace of fluorescence showed similar trend with the time trace of membrane displacement, the time interval is 0.011 ± 0.0002 seconds. In Figure 17(B), we can see the time interval between the two signals is 10-3 seconds. From Figure 1, we can see the intracellular Ca2+ concentration increase is prior to contractions.However, we have to concern about that intracellular Ca2+ concentration is not uniform over the whole cell. The time interval with small S.E.M. may indicates small difference between each contraction. By simultaneous probing of Ca2+ and contractions, we can study the mechanism of decreased Ca2+ sensitivity of the myofilaments under oxidative stress. Our combined setup could be a good tool to study relationship between the contractility and intracellular Ca2+ concentration.
52
10.00
0
10.25
10.50
150
300
450
600
750
10.00
10.25
10.50
2.8
3.0
3.2
Displacement (nm)
Displacement
Fl
uoresc
ence
(V
)
Time (sec)
Fluorescence
10
12
14
16
18
20
0
150
300
450
600
750
10
12
14
16
18
20
2.8
3.0
3.2
Displacement (nm)
Displacement
Fl
uoresc
ence
(V
)
Time (sec)
Fluorescence
(B)
(A)
Figure 17 Simultaneous probing of intracellular Ca2+ and contraction.
(A) Merged figure showed continuous time traces of cardiomyocyte membrane displacement and fluorescence signal of fluo-4. The pulsation displacement and frequency is 0.806 ± 0.003 μm and 2.465 ± 0.022 Hz, respectively. The peak value
and frequency of fluorescence signal is 3.234 ± 0.003 V and 2.467 ± 0.022 Hz. (B) The merged figure was enlarged, the time interval between cardiomyocyte membrane displacement and fluorescence signal of fluo-4 was indicated by the gray rectangular, which is 10-3 seconds.
54
5 Conclusions
We have demonstrated the employment of a scanning probe microscope to characterize the pulsation dynamics of cardiomyocytes. The cell condition for quantitative and qualitative cardiomyocyte pulsation measurement has been established. Through intuitive while quantitative graphic representation of the contractile characteristics, the intervention of cardiomyocyte pulsation by epinephrine, esmolol hydrochloride, doxorubicin are demonstrated. The underlying molecule mechanism has been verified by our pharmacological testing model.
Due to spontaneous beating ability of cardiomyocytes, we investigate the pulsation displacement and pulsation frequency. Epinephrine and esmolol hydrochloride used to regulate heart function in clinical diagnosis, the increased and decreased trend of pulsation behavior was demonstrated by our model. From the spectrogram, we see the trend of post-treatment pulsation behavior; the pulsation displacement was affected immediately, but the pulsation frequency was stable with time. After administration of doxorubicin, the post-treated cardiomyocytes change into quiescent states occasionally. This phenomenon was ablated by pretreatment of 100 μM vitamin C. Contribution to prevention of doxorubicin-induced oxidative stress provides new way for scavenger design.
SPM was employed in monitoring yeast oscillation for motions up to 1 kHz frequency and sub-nanometer resolution previously.35 What’s more, the SPM was set on an inverted optical microscope, further optical measurement could be achieved easily. Correlation of actin immunofluorescence image and cardiomyocyte stiffness was demonstrated in previous research.28 Moreover, time interval between events in excitation-contraction coupling are in milliseconds scale, our model can monitor the process delicately. With high temporal and spatial
resolution, application of SPM in cardiomyocyte pulsation measurement is suitable for elucidation of molecular events inside the cardiomyocyte. Our approach should prove useful for evaluation of new therapies of cardiac diseases, and for functional assessment of cardiac toxicity at the level of single cells.
56
References
1. Devereux, R.; Reichek, N., Echocardiographic determination of left ventricular mass in man. Anatomic validation of the method. Circulation 1977, 55, 613-618. 2. Devereux, R. B.; Alonso, D. R.; Lutas, E. M.; Gottlieb, G. J.; Campo, E.; Sachs, I.;
Reichek, N., Echocardiographic assessment of left ventricular hypertrophy: Comparison to necropsy findings. American Journal of Cardiology 1986, 57, 450-458.
3. Lieber, S. C.; Qiu, H.; Chen, L.; Shen, Y.-T.; Hong, C.; Hunter, W. C.; Aubry, N.; Vatner, S. F.; Vatner, D. E., Cardiac dysfunction in aging conscious rats: altered cardiac cytoskeletal proteins as a potential mechanism. American Journal of
Physiology-Cell Physiology 2008, 295, H860-866.
4. Gelpi, R.; Buchholz, B.; D'Annunzio, V., Isolated Heart Langendorff Technique. In Experimental Surgical Models in the Laboratory Rat, CRC Press: 2009; pp 209-213.
5. Sreejit, P.; Kumar, S.; Verma, R. S., An improved protocol for primary culture of cardiomyocyte from neonatal mice. In Vitro Cellular & Developmental
Biology-Animal 2008, 44, 45-50.
6. Lamers, W. H.; Dejong, F.; Degroot, I. J. M.; Moorman, A. F. M., The development of the avian conduction system, a review. European Journal of
Morphology 1991, 29, 233-253.
7. Kamino, K., Optical approaches to ontogeny of electrical activity and related functional organization during early heart development. Physiological Reviews
1991, 71, 53-91.
8. Hirota, A.; Fujii, S.; Kamino, K., Optical monitoring of spontaneous electrical-activity of 8-somite embryonic chick heart. Japanese Journal of