Study on dynamics of photon migration in human breast based on
three-dimensional Monte Carlo modeling
Ching-Cheng Chuang
1, Chung-Ming Chen
1, Chia-Yen Lee
1, Jui-che Tsai
2, Chih-Wei Lu
3, and
Chia-Wei Sun
4,5,*1
Institute of Biomedical Engineering, National Taiwan University, Taiwan, R.O.C.
2
Graduate Institute of Photonics and Optoelectronics and Department of Electrical Engineering,
National Taiwan University, Taiwan, R.O.C.
3
Medical Electronics and Device Technology Center, Industrial Technology Research Institute,
Taiwan, R.O.C.
4
Biophotonics Interdisciplinary Research Center and Institute of Biophotonics, National Yang-Ming
University, Taiwan, R.O.C.
5
Department of Photonics, National Chiao Tung University, Taiwan, R.O.C.
ABSTRACT
The scattering and absorption properties of human breast are very important for cancer diagnosis based on diffuse optical tomography (DOT). In this study, the dynamics of photon migration in three-dimensional human breast model with various source-detector separations is simulated based on a Monte Carlo algorithm. The three-dimensional human breast structure is obtained from in vivo MRI image. The breast model consists of skin, fatty tissue, glandular tissue, sternum and ribcage. The backscattered diffuse photons from each layer in breast are recorded by marking the deepest layer which every photon can reach. The experimental results indicate that the re-emitted photons contain more information from deep tissue regions with the source-detector separations because of the strong dependence to the resolution and sensitivity in DOT imaging. The geometric position of the source-detector separations were optimized in this study. The different sizes of breast tumor were modeled to analysis of optical image characterizations. Finally, the tumor images from different deep information were obtained with temporal profiles.
Keywords: Diffuse optical tomography (DOT), Monte Carlo algorithm, breast tumor.
1. INTRODUCTION
Breast cancer has presented to be one of the most serious threats to female health, especially in the developed countries1. The imaging techniques used to detect breast cancers at present are mammogram and breast sonography.
However, they both are not sensitive enough to detect the early stage breast tumor because breast is a turbid medium2.
MRI and PET have the potential for early detection of breast cancers, but they are both very expensively and unusually used as the first-line defense3. Although the spatial resolution is limited when compared with other imaging modalities,
such as MRI or X-ray computerized tomography (CT), optical imaging provides access to a variety of physiological parameters that otherwise are not accessible, including contrast information that is specific to oxyhemoglobin, deoxyhemoglobin and other fast-changing processes4-6. Diffuse optical tomography (DOT) is emerging as a viable new
biomedical imaging modality. Currently, the main applications are brain, breast, limb and joint imaging. DOT using harmless near-infrared light, probed absorption and scattering properties of biological tissues and provided lesion detection based on functional abnormalities and shows the feasibility for breast cancer diagnosis in early stage7.
Three distinct technologies of DOT have been used for imaging systems, known as Continuous wave, Time resolved and Frequency domain. With time-resolved technology the optical properties of the tissue are inferred from the shape of the temporal point spread function (TPSF). Time-resolved have relied on a ‘‘time gating’’ approach to isolate early photons, to increase the spatial resolution and showed depth resolution 8. The important task before to develop the DOT
Biomedical Applications of Light Scattering IV, edited by Adam P. Wax, Vadim Backman, Proc. of SPIE Vol. 7573, 757319 · © 2010 SPIE · CCC code: 1605-7422/10/$18 · doi: 10.1117/12.842230
Proc. of SPIE Vol. 7573 757319-1
system is to simulate the characteristic of the photons migrate in the breast tissue and to estimate the parameters of the system such as the separations and geometric position of the source-detector.
Breast tissue is a turbid medium, thus light follows a complex path, and the signal strength attenuates rapidly with propagation being inherently three dimensional. Diffusion theory is often used in the model-based interpretation of photon propagation9-11. To improve the accuracy of photon propagation in the complex tissue structures depends on the
development of numerical solution methods for solving the forward photon migration problem of diffuse equation, such as finite-element method (FEM). FEM solutions of the diffusion equation are likely to provide accurate solutions, it need to be compared against solutions of the radiative transport equation to verify accuracy near internal and external boundaries12, 13. The whole TPSF cannot be obtained from the time-independent diffusion equation. Monte Carlo
solution methods are conceptually simpler to implement and rely on fewer assumptions and obtained more time-resolved information than diffuse equation, but at the expense of computational speed. Currently, because of limited spatial resolution, DOT is increasingly being used in combination with imaging methods that provide a priori structural information, such as MRI, CT, and ultrasound imaging12-14. The different geometric position of source-detector
separations is a strong dependence to the resolution and sensitivity of the time-resolved DOT imaging. In order to improve the signal-to-noise ratio in DOT imaging, some approaches were adopted, such as varying of the source-detector separation and the time-gating method. As mentioned above, the information regarding the breast was associated with detected optical signals that strongly depend on the separation distance between the source and the detector. In this study, we observed the photon migration with multiple scattering events in a three-dimensional (3-D) breast model of a human based on Monte Carlo simulations. The model of breast structure is based on the in-vivo MRI image. According to this three-dimensional breast model, the multi-source and multi-detector were located on the breast model surface. The received photons of the detectors were traced with various source-detector separations. The different sizes of breast tumor were modeled in the three-dimensional breast model to analyze the optical image characterizations. Three-dimensional Monte Carlo code has been described to calculate the photon migration through highly scattering media with varying optical properties and arbitrary boundary conditions. In this study, the dynamic photon migration analysis is described in three-dimensional breast model that nearest the real geometric of the breast tissue. Although many papers discuss the photon migration in human breast, as our knowledge, it is a first paper to show the dynamic photons traveling in real geometric of the breast model from multi-source to multi-detector, respectively.
2. METHODS
In this study, our works are stated as follows:
1. The modeling of three-dimensional breast structure with tissue optical properties based on in-vivo MRI image. 2. The modeling of simple cubic geometry with an abnormality as tissue phantom.
3. The coding of three-dimensional Monte Carlo algorithm for dynamic recording of photon migration. 2.1 Breast model
The breast model was reconstructed from in vivo MRI image. A three-dimension image of breast structure with 256×256×130 voxels is modeled for simulation. The breast structure is defined as five layers based on the three-dimensional MRI images. Each voxel is a 0.8×0.8×0.8 mm3 cube in size from the resolution of MRI image and assigned
as air, skin, fatty tissue, glandular tissue, sternum and ribcage. The numbers of voxels, the size of cube, the type of tissue, the light source position and the detector positions were adjusted to various simulations. In this simulation, the voxel size was chosen the same resolution of each cube size for fitting the MRI resolution. In this simulation, the wavelength was determined as 800 nm. For the wavelength of 800 nm, the scattering coefficients of the five tissues are 14 (skin), 7.67 (fatty tissue), 8.94 (glandular tissue), 16 (sternum), and 39 (ribcage) mm-1, respectively. Also, the absorption coefficients
of the five tissues are 0.23 (skin), 0.11 (fatty tissue), 0.06 (glandular tissue), 0.16 (sternum), and 2.8 (ribcage) mm-1,
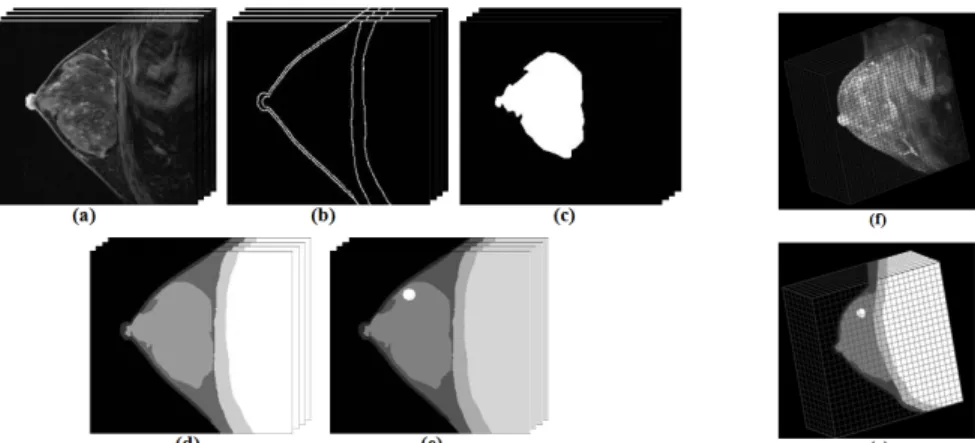
respectively. In order to observe and to comprehend more information of basic physiological signification, the different absorption and scattering coefficients were assigned to the tumor layer. Fig. 1 represented that the image processing of the breast model.
Proc. of SPIE Vol. 7573 757319-2
Figure 1. The three-dimension model of human breast: (a) MRI image, (b) boundary image, (c) glandular layer, (d) breast model with five layers, (e) a tumor in breast, (f) in vivo 3-D MRI image, and (g) 3-D breast modeling.
Figure 1 (a) indicates in vivo MRI images with different slices of the breast. The 130 two-dimensional images were used from the right breast to left, and each image contains 256×256 pixels. The image processing method was performed to segment the boundary images and glandular layer of the breast shown in Fig. 1 (b) and Fig. 1 (c). The image reconstruction and the tumor were simulated into the breast model shown in Fig. 1 (d) and Fig. 1 (e). The 3D image of the in vivo MRI image and breast model reconstruction showed in Fig. 1 (f) and Fig. 1 (g). Each voxel of the space in our simulations could be well defined. The various source-detector separations were located on the breast model that showed in Fig. 2. The different depth of the tumor was modeled in 3-D breast model.
Figure 2. Source-detector separations and tumor model in different depth. (a) Tumor model in the shallow of the breast. (b) Tumor model in the deep of the breast.
2.2 Geometry phantom
In previous study, the Monte Carlo simulations were usually based on the simple geometry of multi-layer tissue phantom. In this study, we modeled the simple geometry of 3-D multi-layer tissue phantom to provide the feasibility of our algorithm. The resolution of the geometry phantom is 256×256×130 pixels. Each voxel is a 1×1×1 mm3 cube in size
assigned as air, skin, fatty tissue, glandular tissue, showed in Fig. 3.
Figure 3. The simple geometry of 3-D multi-layer tissue phantom.
Proc. of SPIE Vol. 7573 757319-3
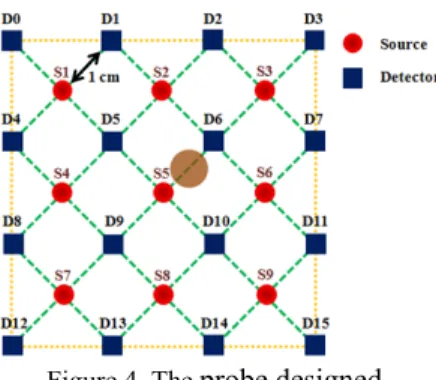
Figure 4. The probe designed.
Figure 4 shows that the breast probe designed. The breast probe consisted 3×3 sources and 4×4 detectors in a square geometry, with each source-detector separation 1 cm. This separation was chosen to maintain an acceptable SNR. The tumor model was located between source 5 and detector 6 in the deep of the breast model.
2.3 Monte Carlo algorithm
Monte Carlo is a method with numerical statistics and that offers a flexible approach to analyze light transport in turbid media. Our method was based on a set of rules that describe the characteristics of a photon behavior in turbid tissues. The propagation behavior of a photon in tissues can be decided with two parameters: (1) the mean free path of a scattering or absorption event, and (2) the scattering angle of a scattering event. In addition, Snell’s law and Fresnel reflection formulas were applied at each boundary. When a photon is encounter with a scattering event, a new step size, deflection angle, and azimuthal angle will be assigned. The formal solution, Mie theory, describes absorption and/or scattering event with a sphere that has been available in previously study15. In our simulation, before the photons start to
emit, we created a matrix to record the spatial arrangement of tissue constituents. Each voxel in the matrix is assigned an integer to represent the type of tissue in this voxel (e.g. 1 = air, 2 = epidermis, etc.). The initial position and direction of photon were defined in each photon emission. In our case, the point source was used that means all the photons start to emit at the same direction. The steps of our simulations are:
a. The pass length of each photon.
b. Boundary conditions - specular reflection and refraction. c. Scattering event - deflection and azimuth angles. d. Absorption event - energy loss.
e. Optical detection.
The first step in building Monte Carlo model is to create random numbers and to define the probability density function of a random variable. The probability density function of free path s1 is:
1
)
(
1 S te
ts
p
=
μ
−μ (1) According to the probability density function of a uniform distribution, we can obtain a sampled value s1:t
S
μ
ξ
)
1
ln(
1−
−
=
(2) where ξ is a sampled value of a uniform random variable within the interval [0,1]. Therefore, Eq. (2) was used to sample the step size of a photon movement. However, before the photon is scattered by a particle, the photon may pass through the boundary of different voxels. Thus the decision of the step size of photon should be modified. In this condition, Eq. (2) should be:∑
=
−
i i tiS
ξ
μ
ln
(3) where i and μti are the index and the extinction coefficient of the voxel, respectively. si is the path length of photon in thei voxel. The free path selection of the photon is illustrated in Eq. (2). Besides, if the photon propagates through a voxel boundary, the step size should be modified as the way in Eq. (3). If the refraction index is different between two adjacent voxels, the effect of refraction or reflection may occur alternatively. During the propagation, all the voxels that the
Proc. of SPIE Vol. 7573 757319-4
photon has passed through are recorded. Therefore, the movie of photon migration in breast model can be made. By the definition of scattering, absorption, and extinction coefficients (μs, μa, and μt), we have known that μtΔs denotes the
probability of interaction with the turbid medium when a photon travels an infinitesimal distance Δs. Some concepts were concerned with μt should be remarked again. The value of μt represents the degree of scattering and absorption
when light transports in a turbid medium. Intuitively, if the concentration of the medium is dense, μt will be large.
Besides the concentration of the medium, the other parameters, including the particle size, incident wavelength, material inside the particles and the composition of solvent, etc., will also influence the value of μt as well. In other words, μt is a
macroscopic parameter of a turbid medium. Total attenuation coefficient, μt, not only abate the intensity of light but also
decrease the polarization degree of light. The optical density Φ was the photons which was be detected in the normal breast model. When the tumor added in the breast model, the optical density was assigned asΦC. Thus, the variation of
the optical density Δ OD can be calculated using the formulas:
scat c
OD
=
−
Φ
Φ
Φ
−
=
Δ
0ln
(4) 3. RESULTSFigure 5(a) demonstrates the total photon migration in the breast model, and Fig. 5(b) show the photon migration that the cases of source-detector separation with 0.8 cm, 1.6 cm, 2.4 cm and 3.2 cm, respectively. In this study, the simulation result presents the optical paths of photon migration with different source-detector separations in a breast mode. Obviously, the photon density is hugely decayed with strong absorption and scattering in the breast tissue. Although the detected photons are few, the information of breast tissue characteristic is quite carried with the optimized source-detector separation. The transmitted photon path, so-called “banana shape,” indicates the optical probing area in breast.
Figure 5. Photon migration. (a) The total photons migrated in the breast model. (b) The photons which were detected with detector 0, 1, 2, and detector 3. (c) Show the received intensity which detected from different layer (Log scale). (d) Show the distributions of ratio
of the received intensity from different layers of breast versus the distance of source-detector separation.
Figure 5(c) shows the received intensity from different layer, the most intensity detected from fatty and glandular layer. Because we recorded all the paths of the received photons in the simulations, the visited layers of each photon were marked. Fig. 5(d) shows the ratios of the backscattered intensities from different layer versus the source-detector separation. Obviously, the ratio of fat layer decreases rapidly with the distance of source-detector separation increases. On the contrary, the ratio of glandular layer increases rapidly with the same condition. However, the total received intensity was decreasing with the source-detector separation increasing. Hence, it is a trade-off problem between the received intensity and the useful information in NIRS measurement.
Proc. of SPIE Vol. 7573 757319-5
Figure 6. Show the distributions of ratio of the received intensity from different layers of breast tumor of variation source-detector separations.
Figure 6 demonstrated the spatial information of the structure with different depth of the tumor. According to the transmitted photon path, so-call “banana shape”, the received intensity from shallow layer of tumor was responded to the detectors which located near the light source. On the other way, the well respondence of the detectors was located on the far position of the light source.
Figure 7. Contrast maps of the geometry phantom with temporal profile from tumor. The left figure shows the image mapping with total intensity. The figure on the top of the right side shows the temporal profile from tumor. The figure below the temporal profile
shows the average contrast maps for deep inclusion.
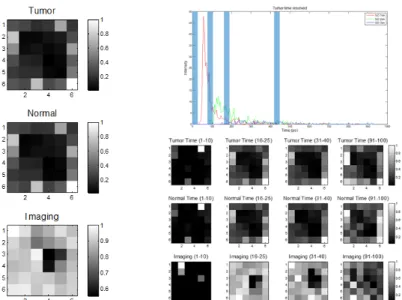
Figure 7 shows the contrast maps of the geometry phantom with source 5 to each detector. The tumor location was showed in Fig. 4. The figure on the right side shows the contrast maps of the tumor. The great contrast image of the tumor location was obtained with our algorithm. From each time course, we define the contrast as the change in intensity between shorter paths to longer paths. This contrast is calculated for source 5 to each detector pair and each temporal profile. The Fig. 7 shows the resulting contrast maps for 5 different delay signals. The deep information was observed in the contrast maps. The contrast maps of the geometry phantom provided the feasibility of our algorithm. Then, the contrast maps of the breast tumor model were obtained with our algorithm for each source-detector pair shows in figure 8. For each source-detector pair the 6×6 pixels maps was made. The great contrast maps were obtained from the breast tumor model. The deep information was observed of the contrast maps with the delay signal of the temporal profile.
Proc. of SPIE Vol. 7573 757319-6
Figure 8. Contrast maps of the breast model with temporal profile from tumor. The left figure shows the image mapping with total intensity. The figure on the top of the right side shows the temporal profile from tumor. The figure below the temporal profile shows
the average contrast maps for deep inclusion.
4. DISCUSSIONS
In this study, the simulation results demonstrate the characteristics of photon migration with different source-detector separations in human breast model and phantom. As mentioned before, we describe the three-dimensional Monte Carlo method that is capable of performing source-detector separation analysis with dynamic photon migration. The transmitted photon path is showed in the Fig. 3. The simulations provide the spatial information and the optical characteristic of the breast tumor. Figure 7 shows the ability to obtain the forward problem with Monte Carlo algorithm directly. The contrast image can map with Eq. (4) and observe the deep information with temporal profile from tumor. Figure 8 shows the contrast maps with the breast tumor model which nearest to real breast. Although the limited photon intensity that can detect, the simulation can help us to optimize the source-detector separations before to develop the time-domain system of DOT. The results also provide more information of the breast tumor such as optical characteristics, spatial information of the tumor in the breast and time domain information with temporal profile from tumor. However, the bottleneck of the DOT is the poor spatial resolution. The improvement of image quality may be achieved with reconstruction algorithm based on the changes of spatial distribution and temporal profile from tumor.
ACKNOWLEDGMENTS
This research was sponsored by the National Science Council of Taiwan under grants NSC97-2118-E-010-001 and the Chung-Shan Institute of Science and Technology of Taiwan.
REFERENCE
1. Feuer, E. J., Wun, L. M., Boring, C. C. et al., “The lifetime risk of developingbreast cancer,” J Natl Cancer Inst. Jun 2; 85(11): 892-7 (1993).
2. Reinikainen, H., "Complementary imaging of solid breast lesions," Oulu University Press, (2003).
3. Smith, J. A., and Andreopoulou, E., “An overview of the status of imaging screening technology for breast cancer,” Annals of Oncology. Jan; 15(Suppl):i18-i26, (2004).
Proc. of SPIE Vol. 7573 757319-7
4. Hielscher, H., Bluestone, A.Y., Abdoulaev, G.S., Klose, A.D., Lasker, J. M., Netz, S. U. and Beuthan, J., “Near-infrared diffuse optical tomography”, Disease Markers 18 313–337, (2002).
5. T. Yates, J. C. Hebden, A. Gibson, N. Everdell, S. R. Arridge, and M.Douek, “Optical tomography of the breast using a multi-channel time-resolved imager,” Physics in Medicine and Biology 50, 2503–2517, (2005).
6. B. W. Pogue, Shudong Jiang Hamid Dehghani, Christine Kogel Sandra Soho, Subhadra Srinivasan Xiaomei Song, Tor D. Tosteson, Steven P. Poplack, Keith D. Paulsen, “Characterization of hemoglobin, water, and NIR scattering in breast tissue: analysis of intersubject variability and menstrual cycle changes”, Journal of Biomedical Optics 9(3), 541–552, (2004).
7. D. R. Leff, O. J. Warren, L. C. Enfield, A. Gibson, T. Athanasiou, D. K. Patten, J. Hebden, G. Z. Yang, A. Darzi, “Diffuse optical imaging of the healthy and diseased breast: A systematic review”, Breast Cancer Res Treat, 108:9–22, (2008).
8. J. Selb, D. K. Joseph, D. A. Boas, “Time-gated optical system for depth-resolved functional brain imaging”, Journal of Biomedical Optics 11(4), 044008, (2006).
9. B. A. Brooksby, H. Dehghani, B. W. Pogue, and K. D. Paulsen, “Near-Infrared (NIR) Tomography Breast Image Reconstruction With A Priori Structural Information From MRI: Algorithm Development for Reconstructing Heterogeneities”, IEEE JOURNAL OF SELECTED TOPICS IN QUANTUM ELECTRONICS, VOL. 9, NO. 2, MARCH/APRIL, (2003).
10. S. R. Arridge et al., “The theoretical basis for the determination of optical pathlengths in tissue: Temporal and frequency analysis,” Phys. Med. Biol., vol. 37, no. 7, pp. 1531–1560, (1992).
11. T. J. Farrell and M. S. Patterson, “A diffusion theory model of spatially resolved, steady-state diffuse reflectance for the noninvasive determination of tissue optical properties in vivo,” Medical Physics 19(4), 879–888, (1992). 12. V. Ntziachristos, A. G. Yodh, M. D. Schnall, B. Chance, “MRI-guided diffuse optical spectroscopy of malignant
and benign breast lesions,” Neoplasia 4, 347-354 (2002).
13. Q. Zhu, N. Chen, S. H. Kurtzman, “Imaging tumor angiogenesis by use of combined near-infrared diffusive light and ultrasound,” Optics Letter 28, 337-339 (2003).
14. Li, A., Miller, E. L., Kilmer, M. E., et al., “Tomographic optical breast imaging guided by three-dimensional mammography,” Applied Optics 42, 5181-5190 (2003).
15. Bohren, C. F. and Huffman, D. R., “Absorption and Scattering of Light by Small Particles,” John Wiley & Sons, (1983).
Proc. of SPIE Vol. 7573 757319-8