國 立 交 通 大 學
企業管理碩士學位學程
碩 士 論 文
The Emergence of a new Chaebol:
Corporate strategy and leadership in successful M&A
of STX in Korea-a case study
硏 究 生:趙俊誠
指導敎授:劉芬美
National Chiao Tung University
Global Master Degree Program of
Business Administration
Thesis
The Emergence of a new Chaebol: Corporate
strategy and leadership in successful M&A of
STX in Korea-a case study
Student: JuneSung Joe
Advisor: Prof. Fen-May Liou
The Emergence of a new Chaebol: Corporate
strategy and leadership in successful M&A
of STX in Korea - a case study
硏 究 生:趙俊誠 Student: JuneSung Joe
指導敎授:劉芬美 Advisor: Fen-May Liou
國 立 交 通 大 學
企業管理碩士學位學程
碩 士 論 文
A Thesis
Submitted to Global Master Degree Program of Business Administration College of Management
National Chiao Tung University In partial Fulfillment of the Requirements
For the Degree of Global Master
in
Business Administration
July 2011
Hsinchu, Taiwan, Republic of China
Acknowledgement
Working on this thesis has been an incredible experience for me. For this, I am really grateful to my advisor and mentor, Professor Fen-May Liou, for her guidance and suggestion
throughout the process of writing this thesis. Her support is of enormous importance to the successful completion of this thesis, and also her prompt replies to my e-mails and her valuable feedback and comments have greatly helped me to complete my thesis on time.
i
The Emergence of a new Chaebol:
Corporate strategy and leadership in successful M&A of STX
in Korea - a case study
Student: JuneSung Joe
1Advisors: Dr. Fen-May Liou
Global Master of Business Administration
National Chiao Tung University
ABSTRACT
South Korea has experienced an extraordinary reconstruction for decades. This remarkable turnaround derived by Chaebols gave people two biases. Firstly Korean big conglomerates were made by State. Secondly, it will not appear a new Chaebol since existing big businesses already occupied almost whole market share. STX, however, tears down the stereotypes since its firm was new born and a medium sized business in an early stage.
This paper, therefore, examines the successful M&A of STX which have used acquisitions as a main driver of its overall growth strategies, converting its firm achieve one of the world‘s best performing acquisitive corporations. So this study shows an active M&A strategy for corporate growth is presented, along with a case study of STX. Besides, this study reviewed literatures to identify and discuss between the related studies and findings. Also this article has provided recommendations on what rivals should do to increase their chances of success through lessons from the STX‘s case study.
ii
TABLE OF CONTENTS
ABSTRACT ... i TABLE OF CONTENTS ... ii LIST OF FIGURES ... iv I. Research Motivation ... 1 1.1 Motivation ... 1 1.2 Background of STX ... 51.3 Overview of International shipbuilding Market ... 12
1.3.1 Key Features of the Shipbuilding Industry ... 16
1.3.2 The shipbuilding market: Key customers ... 18
1.3.3 Major competitors ... 21
1.4 Thesis outline ... 23
1.5 Research Methodology ... 25
II. Analysis of STX Group ... 27
2.1 Businesses of STX ... 27
2.2 STX‘s M&A process ... 30
2.3 Financial performance of STX over time ... 33
2.3.1 Sales Revenue ... 33
2.3.2 Net cash positions expected in 2012 ... 34
2.3.3 Upside seen from price-to-sales & price-to-order book ratio ... 34
2.4 SWOT analysis of STX ... 36
2.5 Analysis of Competitive advantages ... 37
2.5.1 The greatest vertical integration ... 37
2.5.2 Business Diversification: High valued ship building ... 39
2.5.3 In strategic alliance with a LNG Firm of transportation and Regasification Solutions ... 41
2.5.4 Cost leadership: STX Dalian Shipyard ... 41
2.6 du Pont Analysis ... 42
III. Literature review ... 45
3.1. Mergers and acquisitions ... 45
3.2. Overview of Theories in M&A ... 49
3.2.1 Efficiency theories... 50
3.2.2 Monopoly theory ... 51
3.2.3 Valuation theory ... 51
iii 3.2.5 Process theory ... 52 3.2.6 Raider theory ... 53 3.2.7 Disturbance theory ... 53 3.2.8 Information theories ... 54 3.3. M&A leadership ... 54
3.4. Post mergers and acquisitions ... 56
3.4.1 Conglomerate firms ... 57
3.4.2 Related acquisitions ... 57
3.4.3 Method of payment ... 58
3.4.4 Acquisition experience ... 59
3.5. Success factors in mergers and acquisitions ... 60
IV. The Key Principles to Successful M&A of STX ... 65
4.1. A deeper understanding of the value of targets ... 65
4.2. Focus on future value of Targets: nurturing targets after M&A ... 66
4.3. To buy Targets as well as human resources ... 67
4.4. Initial Public Offering as a sound conservation strategy ... 68
4.5. Enter into New Segment through abroad ... 69
V. Findings and Discussions ... 70
VI. Recommendations to Rivals in the Emerging Markets ... 75
Bibliographies ... 77
LIST OF TABLES
TABLE 1THE CHRONICLE OF STX ... 7TABLE 2ORDERBOOK BY SHIPYARD IN KOREA, END OF 1990 ... 8
TABLE 3M&A HISTORY OF STX ... 9
TABLE 4M&A ACTIVITY AND SALES OF STX ... 11
TABLE 5SHIPBUILDING MARKET SHARE IN THE 1900S ... 12
TABLE 6INVESTMENT IN KOREAN SHIPBUILDING INDUSTRY ... 16
TABLE 7ORDERBOOK BY MAJOR SHIP OWNER'S NATIONALITY (JAPAN KOREA CHINA) ... 20
TABLE 8ORDER BOOK BY SHIPBUILDERS AS OF 2010 ... 22
TABLE 9COMPANY RANKING IN KOREA ... 28
TABLE 10SALES REVENUE BY MAJOR COMPETITORS ... 33
TABLE 11ACTUAL NET DEBT TRENDS OF STXO&S ... 34
iv
$BN) ... 35
TABLE 13SWOT OF STX ... 36
TABLE 14 DU PONT IDENTITY ... 44
TABLE 15LITERATURE SUMMARY ON SUCCESS FACTORS IN MERGERS & ACQUISITIONS ... 61
TABLE 16CRITICAL SUCCESS FACTORS IN DIFFERENT INDUSTRIES ... 64
TABLE 17STX‘S M&A ACTIVITIES IN SHIPBUILDING INDUSTRY ... 65
LIST OF FIGURES
FIGURE 1AFFILIATED COMPANIES OF STX ... 6FIGURE 2TOTAL SALES OF STX ... 10
FIGURE 3WORLD NEW ORDERS AND MARKET SHARE BY NATIONALITIES ... 14
FIGURE 4NEWBUILDING PRICES TREND BY GAS CARRIERS ... 15
FIGURE 5VOLUME AND MARKET SHARE IN TERMS OF WORLD NEW ORDERS,2010 ... 19
FIGURE 6WORLD FLEET BY NATIONALITY OF OWNERS ... 20
FIGURE 7OVERVIEW OF THE RESEARCH ... 24
FIGURE 8RESEARCH PROCESS ... 25
FIGURE 9TOTAL SALES AND ASSETS OF STX OVER TIME ... 27
FIGURE 10SALES PORTIONS BY STXGROUP BUSINESS SECTOR IN 2010 ... 29
FIGURE 11SIX STEPS OF STX‘S M&A PROCESS ... 30
FIGURE 12VERTICALLY VALUED CHAIN STRUCTURE OF STX ... 38
FIGURE 13SHIPBUILDING DIVERSIFICATION OF STX ... 40
FIGURE 14CLASSIFICATION OF M&A‘S DEFINITION ... 46
FIGURE 15THEORIES OF M&A MOTIVES ... 49
FIGURE 16TOTAL SALES & ASSETS AND STX‘S M&A ACTIVITIES ... 66
FIGURE 17RELATIONSHIP BETWEEN LITERATURES AND STXM&A ACTIVITY ... 71
1
I. Research Motivation
1.1 Motivation
South Korea has witnessed an incredible transformation in the three decades spanning from the 1960s to 1990s, evolving from an impoverished country to a developed high-income economy today. This remarkable turnaround was achieved through an aggressive, outward-oriented strategy, focusing on developing large-scale industrial conglomerates or chaebols. The incredible economics change gave naturally people stereotypes. The widespread biases in terms of businesses in South Korea have two things:1) Korean big business was portrayed as being created and managed by the state. 2) The appearance of a new Chaebol will be no further.
Firstly, many statist analysts have attempted to demonstrate that economic performance for national development has been led by the "autonomous state (Jones and Sakong, 1980).‖ In these statist analyses, the Korean state is conceived as being a unitary and internally cohesive actor driven by insulated bureaucratic competence, and the bureaucratic state has maintained close ties with big business (Kim, Y T, 1999). A number of social scientists have paid attention to centralized state power in industrial capitalist societies. The statist perspective attributed Korea‘s remarkable economic growth to the strong state‘s role in the economy, focusing on the industrial and financial policies carried out by the state. This explains the
2
crucial role of the state in the making of large business conglomerates under the Chung-hee Park regime since the early 1960s (Stephen Krasner, 1979). The statist analysts also demonstrate that it is a mistake to interpret the advent of the Korean business conglomerates as the only critical breakthrough in the expansion of the free market as a whole. They explain that Korea‘s state officials sought to harness the capability of private corporations by assisting them and inducing them to invest in prioritized industries (Amsden, 1989). Thus Korean big businesses were portrayed as being created, managed, and regulated by the state, and were regarded as having limited autonomy. These views are closely connected with a political logic for nationalist economic strategies as well as greater state intervention in the economy (Stephen Krasner, 1979). They argue that a high degree of state supports was a key factor for big businesses growth since many social scientists tend toward highlighted advantages of dictatorship under the pretense of the so-called developmental dictatorship.
Secondly, Chaebol are Korea's vertically integrated industrial conglomerate controlled by a founding family. While the chaebol have hired an increasing number of professional managers in recent years, family members continue to dominate the top executive positions (Kim, 1991). Dozens of chaebol were formed during the rapid growth period through highly preferential treatment extended by the government to industry champions (Woo, 1991). By the mid-1980s, the chaebol, with 20 to 40 companies in each group, had become domestic powerhouses that
3
had transformed into fully-fledged multinational corporations with billions of dollars in annual revenue (Kim, 2000). The pace of their growth was such that by the mid-1980s, the top 50 chaebol accounted for almost a fifth of Korea's gross domestic product and some 45% of mining and manufacturing sales. This was achieved by aggressive diversification and expansion into new industries, while forming oligopolist positions in major industries (Zeile, 1991: 306). Therefore, there will be happen no further the appearance of a new giant in Korea since big businesses occupy whole market shares in the different segments. For example, Samsung group has many subsidiaries in various different segments such as electronically parts (semiconductor, LCD etc), electronics goods (TV, Camera etc), machinery (shipbuilding etc), constructions, Life insurance, others (Theme park, Hotel, Economic Research Institute) and so on.
The STX (System Technology eXcellence), however, had destroyed two biases in terms of businesses in Korea because a just medium-size business became one of the biggest companies without any privileges from the state within very short period. In South Korean history, its company is the only one which transformed a medium size firm into one of the biggest businesses without the state support in the space of just 10 years. In 2009, another bigger Chaebol, Gumho-Asiana group (ranked 9th, Korea) had tried to do M&A as their growth strategy but their experience was added to the statistic data as a failure example.
4
Besides the owner of STX was one of ordinary salaried workers for 27 years and then became one of richest men in Korea. Thus, this study not only breaks up the prejudices in terms of business in the Korean Peninsula, but also shows a possibility as a good exemplar that Chaebols may be not necessarily fully correlated with the dictatorial government.
Now questions have surfaced over how STX became a Chaebol in Korea. After observations by author for years, one of secrets was M&A since STX have used acquisitions as a central post of its overall growth strategies, transforming its firm achieve one of the biggest businesses in Korea. However academic research has consistently shown that 50 percent to 75 percent of all M&A activity destroys value for the acquirer‘s shareholders (Langford and Brown, 2004).
Therefore this study focuses on STX as a case study and its growth strategies, which were driven by serial acquisitions rather than examine other strategies. The study set out to answer two questions: How STX became a Chaebol in Korea though the owner of its firm was not a rich guy, and What are the key success factors for merger and acquisition in the view of
STX? Also this study provides a good understanding of the key factors in M&A through the
5
1.2 Background of STX
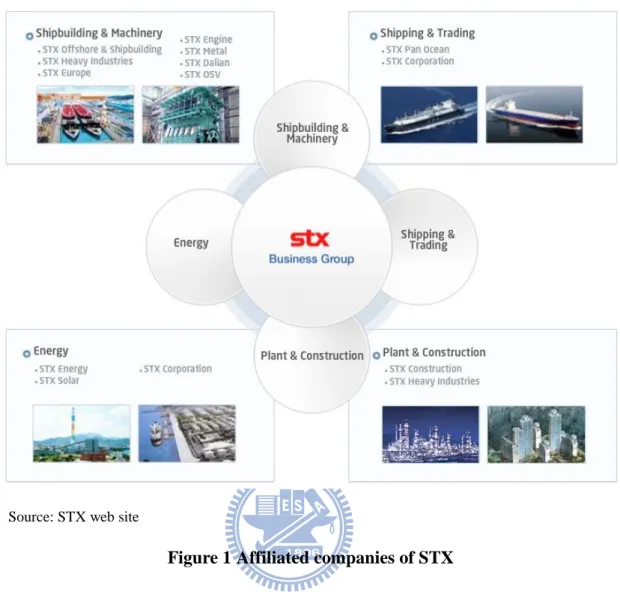
STX Corporation is a South Korean holding company engaged in the provision of trading services. Headquartered in Gyeongsangnamdo, South Korea, the company operates its business through four divisions: Shipbuilding &Machinery, Shipping & Trading, Energy and Plant & Construction. Its shipbuilding machinery sector provides a complete vertical systemization system encompassing the production of shipbuilding equipment and material, blocks, engine parts and marine diesel engines, as well as the construction of ships. Its Shipping Trading business division provides shipping and energy materials, coal, oil, steel and others. Its plant & construction sector business provides shipyards, power plants (combined cycle plant, gas fired power generation plats) and environmental plats (desulfurization systems, water and wastewater treatment plants)
Its Energy business sector operates not only operating Korea largest combined heat and power (cogeneration) plant but also provides a total solution to energy needs, from energy resource development to transport, processing and sales.
6 Source: STX web site
Figure 1Affiliated companies of STX
STX was never born, once a mighty South Korean conglomerate before the Asian financial crisis forced the group to the edge of collapse. The investment fund Hannuri, which bought the Ssangyong Heavy unit in 2000 when its firm was under legal management, promoted Mr Kang Duk-su, then the company's chief financial officer, to chief executive. He was predetermined to revive the company because he could get free only when the company normalized. He already owed Ssangyong's creditors more than Won 40bn ($33m, pound(s) 21m, EUR26m) at that time as he personally guaranteed the debts to pay for wages and other company expenses.
7 Table 1 The chronicle of STX
2010 October Established STX OSV
2009 July Established STX Windpower
2007 March Commenced construction of STX Dalian
Shipbuilding Complex
October Established STX Windpower STX Europe
November Established STX Solar 2005 February Established STX Construction
2004 February Established STX Heavy Industries
April Introduced holding company system
Established STX Engine
November Established STX Pan Ocean
2002 November Established STX Energy 2001 May Established STX Corporation (Changed the
company name of formerly Ssangyong Heavy Industries)
June Established STX Metal
October Established STX Offsore and shipbuilding Source: website of STX
For decades, Mr Kang was an ordinary salaried worker at Ssangyong Group. Although he never intended to buy the group's embattled engine making unit, the circumstances he found himself in persuaded him to do so. He had made a decision for a man nearing retirement to put up all his personal wealth to buy a troubled company since he was confident of its
8
fundamentals in order to turn it around.
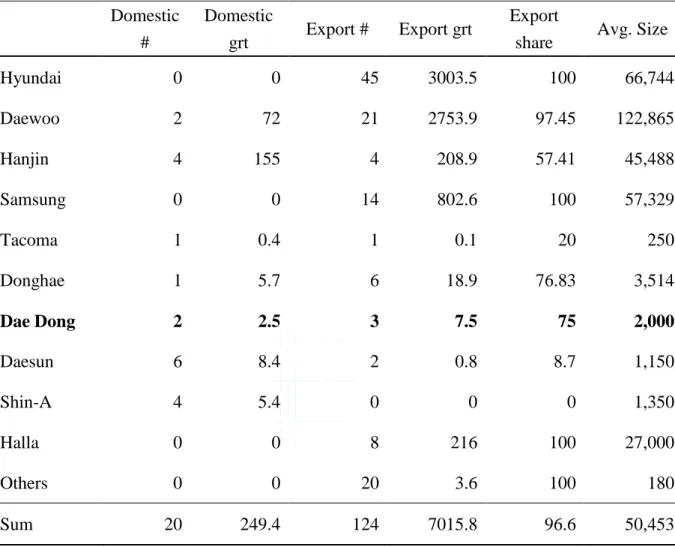
Table 2 Orderbook by shipyard in Korea, end of 1990
Domestic #
Domestic
grt Export # Export grt
Export
share Avg. Size Hyundai 0 0 45 3003.5 100 66,744 Daewoo 2 72 21 2753.9 97.45 122,865 Hanjin 4 155 4 208.9 57.41 45,488 Samsung 0 0 14 802.6 100 57,329 Tacoma 1 0.4 1 0.1 20 250 Donghae 1 5.7 6 18.9 76.83 3,514 Dae Dong 2 2.5 3 7.5 75 2,000 Daesun 6 8.4 2 0.8 8.7 1,150 Shin-A 4 5.4 0 0 0 1,350 Halla 0 0 8 216 100 27,000 Others 0 0 20 3.6 100 180 Sum 20 249.4 124 7015.8 96.6 50,453
Source: Data from Institute of Shipping Economics (1991:75). Tonnage refers to 1000 grt.
Many company workers bought shares in Ssangyong Heavy after he began to run the company and he managed to turn it round by working with clients and suppliers and by winning big orders from China and Japan. He became the company's single largest and controlling shareholder in 2001 after buying an 11 percent stake from the Hannuri fund for Won 2bn out of his own pocket. Then, he renamed the company STX. Since Mr. Kang took control of the company, STX's expansion has appeared to be unstoppable. It embarked on a
9
series of domestic acquisitions to diversify into shipping and shipbuilding.
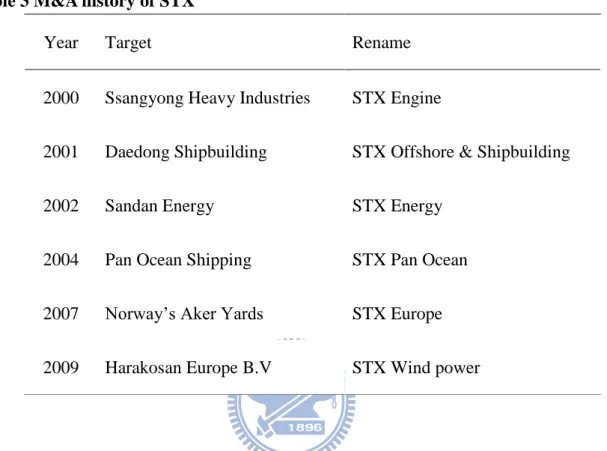
Table 3 M&A history of STX
Year Target Rename 2000 Ssangyong Heavy Industries STX Engine
2001 Daedong Shipbuilding STX Offshore & Shipbuilding 2002 Sandan Energy STX Energy
2004 Pan Ocean Shipping STX Pan Ocean 2007 Norway‘s Aker Yards STX Europe 2009 Harakosan Europe B.V STX Wind power
Within three years, it bought Daedong Shipbuilding, which is one of small-size shipbuilders in Korea as shown in Table 2, and Sandan Energy, Pan Ocean Shipping and renamed them STX Offshore & Shipbuilding, STX Energy and STX Pan Ocean as illustrated in Table 3. Then, the group expanded its horizon abroad, making its first overseas acquisition in 2007, buying a 39.2 percent stake in Norway's Aker Yards, Europe's largest shipbuilder specialized in cruise vessels. It is now renamed STX Europe. The group also bought Harakosan Europe B.V, the Dutch wind generator maker, renamed it STX Wind power. But the acquisition of Aker Yards required long and tough negotiations. STX faced strong resistance from European workers and an antitrust investigation from the European Commission before it took full
10
control of Aker Yards in 2008 - becoming the first Asian shipbuilder to construct a cruise ship for the international market
Source: Annual Report of STX, 2010
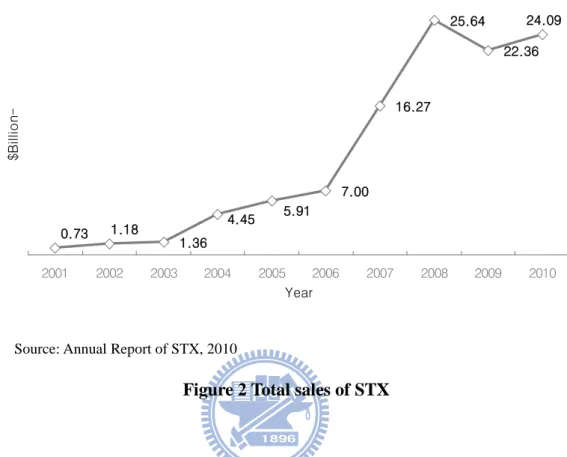
Figure 2 Total sales of STX
Such acquisitions as shown in Table 3 have helped him transform STX into the world's fourth-largest shipbuilder in the space of just 10 years. Now, the group has 21 units2 with combined revenues of $25bn, compared with only $727m in 2001 as shown in Figure 2 and Table 4. It has 18 shipyards in eight countries with more than 90 percent of its sales generated abroad and nearly 60 per cent of the group's 57,000 workers from outside of the country.
2
Subsidiary's current state of affairs from the Citizens Coalition of Economic Justice, 2011
1.36 7.00 16.27 25.64 22.36 5.91 4.45 1.18 0.73 24.09 2001 2002 2003 2004 2005 2006 2007 2008 2009 2010 Year $B ill io n
-11 Table 4 M&A activity and sales of STX
Year Sales ( $ million) Target Deal Value ( $ million) 2001 $727 Daedong Shipbuilding $91 2002 $1,182 2003 $1,364 Sandan Energy $45 2004 $4,455 Pan Ocean Shipping $391 2005 $5,909
2006 $7,000
2007 $16,273 Norway's Aker Yards $667 2008 $25,636
2009 $22,364 Harakosan Europe B.V $22 2010 $24,091
12
1.3 Overview of International shipbuilding Market
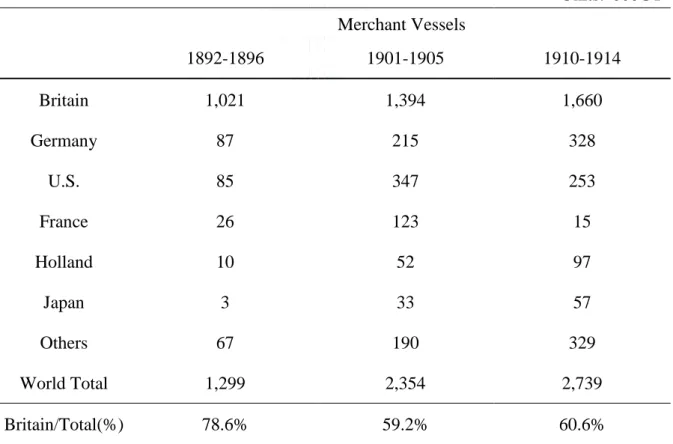
The modern shipbuilding industry that is described by iron structures and steam engines started approximately in the 1860s. Britain firmly established its strong presence in the late 19th century, and it captured 80% of the world's shipbuilding market in 1882 (Porter Competition in Global industries 1986). This could be easily inferred by the seaborne trade volume of Britain and the fleets they owned at the same period. Well developed shipping industry is a precondition for the growth of shipbuilding industry.
Table 5 Shipbuilding market share in the 1900s
Units: '000GT Merchant Vessels 1892-1896 1901-1905 1910-1914 Britain 1,021 1,394 1,660 Germany 87 215 328 U.S. 85 347 253 France 26 123 15 Holland 10 52 97 Japan 3 33 57 Others 67 190 329 World Total 1,299 2,354 2,739 Britain/Total(%) 78.6% 59.2% 60.6%
13
British merchant fleets accounted for 33% of the total world fleets in 1914, and therefore Britain became a world leader both in the shipping market and the shipbuilding market in the 1900s as shown in Table 5.
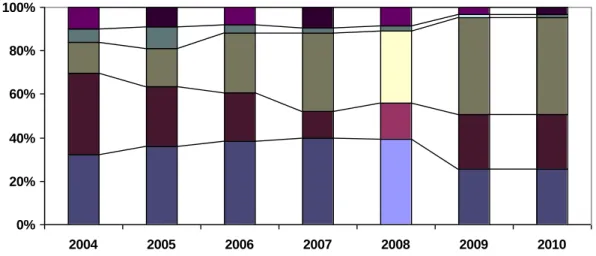
The present shipbuilding industry, however, is dominated by Asian countries as the industry dominance shifted from Europe towards East since the past four decades. Of the Asian nations, Korea, China and Japan hold a majority share in terms of orderbook and volume. During the 1990‘s there was intense competition in the shipbuilding market. Japan and Korea were locked in a battle for market share which, by the end of the decade, it looked as though South Korea was beginning to win. In addition, China started to become a significant force in the shipbuilding market, whilst Western Europe has now retreated into the ―high tech‖ of cruise, LNG and a last foothold in the containership market. The battle between Korea and Japan produced one of the major surprises during the decade.
Early in the 1990‘s it was clear that Korea was targeting Japan‘s market share and it looked as though they had a very good chance of success. The Japanese shipyards were suffering from a strong yen and Korea was pricing its ships very aggressively. So this particular battle is now over with Korea set to take the shipbuilding crown in 2002. The largest shipbuilding companies in terms of capacity are Hyundai Heavy Industries, Daewoo Shipbuilding & Marine Engineering (DSME) and Samsung Heavy Industries (all Korean). Besides, STX is
14
the world's fourth-largest shipbuilder in terms of both capacity and orderbook in 2010.
Source : IHS(Former Lloyd's Register) "World Shipbuilding Statistics".
Figure 3 World new orders and Market share by nationalities
In the other hands, the shipping industry is defined to a large industry because this industry involves huge capital, wide workforce and technology. The industry may need to get a balance between all the three. The process of shipbuilding has been gone through a lengthy in terms of time taken and there are many other ancillary industries associated with shipbuilding as suppliers since it has very good effects and repercussions on industry in this country. As most of the global trade is through sea the shipping industry is mainly driven by the global economic growth. So GDP growth is the main driving factor for this industry. Over the years the industry has shifted its base from the earlier dominating region Europe to Asia. Even within Asia there has been a tussle to gain the top position where South Korea claimed the top
0% 20% 40% 60% 80% 100% 2004 2005 2006 2007 2008 2009 2010
15
position leaving Japan behind until 2008, while China has also leaped ahead of Japan to become the second player. But Figure 3 shows China has got the top position from 2009 to 2010 Moreover, the positions these countries have gained are not just within the Asian region but are on a global level.
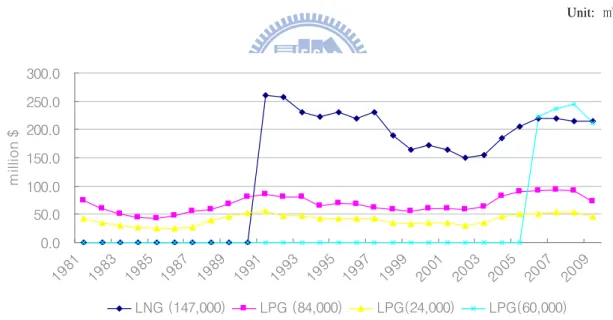
The traditional view of shipbuilding prices, especially gas carriers, was that they behaved much like a commodity, with prices rising and falling along with demand as illustrated in Figure 4.
Unit: ㎥
Source: Clarkson, Shipping Intelligence Network, 2010
Figure 4 Newbuilding Prices trend by Gas Carriers
0.0 50.0 100.0 150.0 200.0 250.0 300.0 1981 1983 1985 1987 1989 1991 1993 1995 1997 1999 2001 2003 2005 2007 2009 m ill io n $. LNG (147,000) LPG (84,000) LPG(24,000) LPG(60,000)
16
1.3.1 Key Features of the Shipbuilding Industry
The shipbuilding industry has predominant traits such as massive investment, competitive market and long term project.
1) Massive Investment
This industry involves huge capital because infrastructure and manufacturing facilities are essential to do business. Beyond upfront investments, constant annual capital expenditure is required to increase shipbuilding capacity and to enhance productivity. As illustrated in Table 6, over a period of five year from 2005 to 2009, Korean shipbuilders invested to catch up with the substantial increase in shipbuilding. In 2008, the percentage of investment reached up to 10% of total exports. Even though the shipbuilders put aggressively money into their investment, they couldn‘t keep their top position in the world from 2009 to 2010.
Table 6 Investment in Korean shipbuilding industry
Unit: Billion $ Item 2005 2006 2007 2008 2009 Investment (percentage) 1.1 (6.2%) 1.5 (6.8%) 2.4 (8.7%) 4.3 (10.0%) 4.0 (8.9%) Exports 17.7 22.1 27.7 43.1 45.1
17
2) Extremely Competitive Market
The shipbuilding market is described as a highly competitive market since shipbuilding industry is considering as a cornerstone industry that could generate huge positive effects on downstream and upstream industries such as shipping, steel, non-metal, electric, and machinery industries. It is a relatively high entry and exit barrier because of huge initial investment but has no residual value of fixed assets. In addition shipbuilders can offer distinguishable ships in terms of quality and performance even though ship buyers have similar needs for certain type of ships. In other words, the shipbuilding market has a characteristic of perfectly competitive market such as numerous sellers and buyers who are price takes. Bulk carriers and tankers, for instance, are so standardized that shipbuilders can‘t be price makers.
Also, shipbuilding market is single global market with information symmetry. The single global market was due in part to high ship prices compared to relatively low transportation costs. For instance, prospective ship owners can generally place a new order with a shipbuilder who offers the best deal from anywhere in the world, and therefore the price of ships eventually converged on a certain level. As a result, when a shipbuilder offers the bidding price that is noticeably out of alignment, the shipbuilder will be squeezed out from the shipbuilding market.
18
3) Long term project
A shipbuilding contract is a rather long-term contract that needs more than two years from a signed contract to a delivery. Because of this long-term characteristic, there are several risks that shipbuilders are face with. Shipbuilders are exposed to risks such as price fluctuation of steel plates and equipments that are more than 15% and 50% of total COGS, respectively. Generally, it takes more than one year from the date of contract signing to the date of steel cutting. In addition, the shipbuilding contract is usually depended on foreign currency, mainly U.S. dollars. Without hedging the foreign currency by derivatives, the profit of shipbuilders may be volatile as a result of the fluctuation of foreign currencies.
1.3.2 The shipbuilding market: Key customers
The shipbuilding industry has gone through the drastic change. Over the past half century it has put on great performances in Europe, but since the mid-1980s it has been an almost entirely Asian show. European predominance was challenged in the late 1950s by Japanese builders, and by the mid-60s Japan had become the dominant player on the shipbuilding scene. Korea started making its presence felt in the 1980s and has been increasing its market share ever since. In 2002 South Korean yards delivered more tonnage (DWT) than the Japanese and has been keeping Top one position in the world until 2008. China has been present as a shipbuilding nation all the time, but did not really offer a commercial alternative until the
19
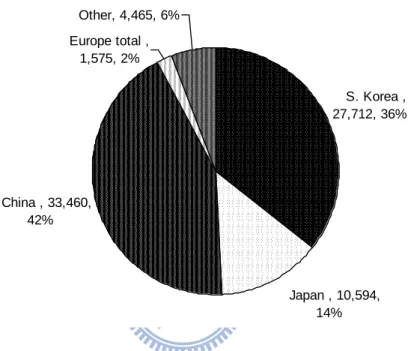
mid-90s. Before then most vessels were built for Chinese interests. However China had become Top one player in 2009. China has dominated 42 percentage of market share in terms of volume in 2010.
Source : IHS(Former Lloyd's Register) "World Shipbuilding Statistics" Unit: ‗000GT
Figure 5 Volume and Market share in terms of world new orders, 2010
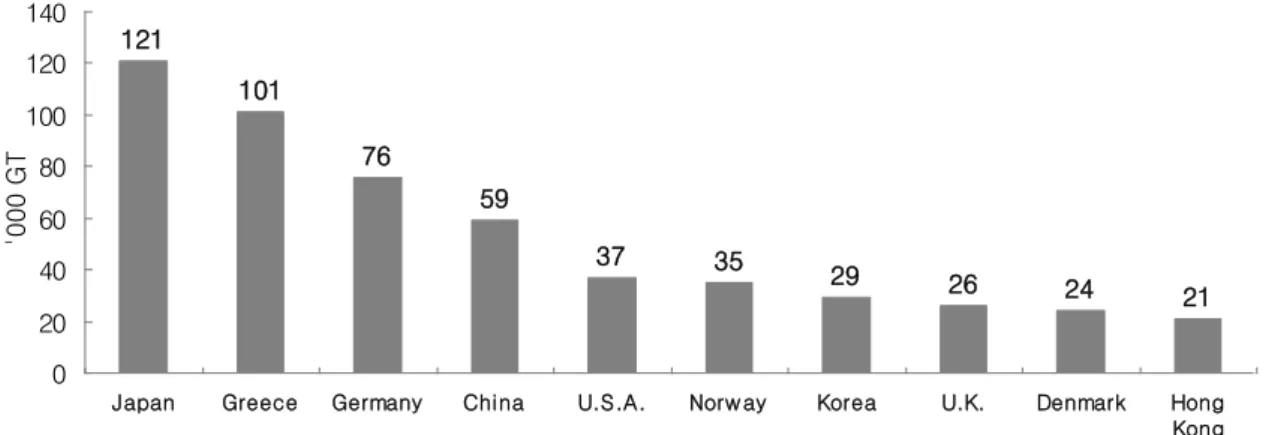
The 10 economies with the largest fleets owned by nationals are shown in Figure 5 according to deadweight tonnage. Nationals of these countries control about 70 percent of the world fleet.
In terms of ownership, the EU 27 share of the World fleet is at 32% which is exactly the same as 30 years ago. Thus European owners still manage to maintain the share of control of the World fleet. S. Korea , 27,712, 36% Japan , 10,594, 14% China , 33,460, 42% Europe total , 1,575, 2% Other, 4,465, 6%
20 Source: Lloyd's Register of shipping
Figure 6 World fleet by nationality of owners
In case of domestic portion in the order book, Chinese government subsidizes 17% of ship price to two state-owned shipbuilders such as CSSC and CSIC. Also, in 2010, 43% of Japanese shipbuilders' orders booked came from the domestic shipping companies and this portion is expected to increase as illustrated in Table 7. Domestic shipping companies can award contracts to their local shipbuilders under government supports.
Table 7 Orderbook by major ship owner's nationality (Japan Korea China)
Rank
Japan China Korea
Owner's Nationality CGT Owner % Owner's Nationality CGT Owner % Owner's Nationality CGT Owner %
1 Japan 43% China 24% Greece 20%
2 Hong Kong 5% Germany 17% Germany 15% 3 Taiwan 4% Greece 12% Korea 7%
Source: The shipbuilders' association of Japan, 2010
121 101 76 59 37 35 29 26 24 21 0 20 40 60 80 100 120 140
Japan Greece Germany China U.S.A. Norw ay Korea U.K. Denmark Hong Kong '0 0 0 G T 1
21
1.3.3 Major competitors
South Korea‘s Biggest three producers, Hyundai Heavy Industries (HHI), Samsung Heavy Industries (SHI) and Daewoo Shipbuilding & Marine Engineering (DSME) dominate the global market in terms of output and orderbook. They offer cost effective and high quality vessels based on their advanced production technologies, good management and process control which helps them utilize their economies of scale and learning effect. Korean shipbuilders have topped the industry with highest market share for a greater part of the last decade. Besides, Chinese shipbuilding players are a powerful rival with the low labor cost and huge amount of domestic demand. Chinese shipyards are rapidly closing the gap with Korean companies and currently hold the largest market share in terms of shipbuilding orders.
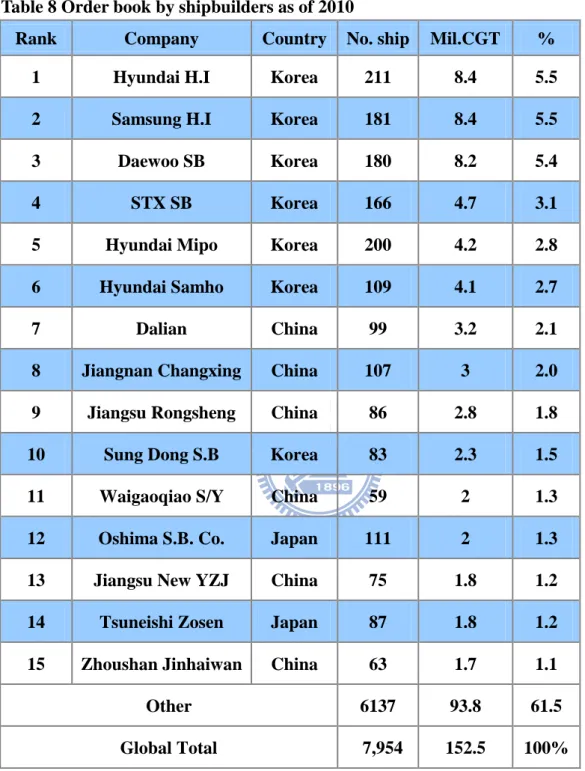
In addition, out of a total of 522 shipyard groups in the world, big four shipyard companies represent 25% and 18 players represent 50% of the total orderbook. Table 8 shows the top 15 shipyard companies in the world, which again confirm the Asian dominance in terms of market volumes. The 15 largest companies are all located in Asia: seven in Korea, five in China and two in Japan. The largest European ship construction company, Meyer Werft in Germany, comes at a mere 38th place. In the Table 8, STX is the world's fourth-largest shipbuilder in terms of both capacity and orderbook and acquired 3.1 percentage of market
22
share in the world.
Table 8 Order book by shipbuilders as of 2010
Rank Company Country No. ship Mil.CGT %
1 Hyundai H.I Korea 211 8.4 5.5
2 Samsung H.I Korea 181 8.4 5.5
3 Daewoo SB Korea 180 8.2 5.4
4 STX SB Korea 166 4.7 3.1
5 Hyundai Mipo Korea 200 4.2 2.8
6 Hyundai Samho Korea 109 4.1 2.7
7 Dalian China 99 3.2 2.1
8 Jiangnan Changxing China 107 3 2.0
9 Jiangsu Rongsheng China 86 2.8 1.8
10 Sung Dong S.B Korea 83 2.3 1.5
11 Waigaoqiao S/Y China 59 2 1.3
12 Oshima S.B. Co. Japan 111 2 1.3
13 Jiangsu New YZJ China 75 1.8 1.2
14 Tsuneishi Zosen Japan 87 1.8 1.2
15 Zhoushan Jinhaiwan China 63 1.7 1.1
Other 6137 93.8 61.5
Global Total 7,954 152.5 100%
23
1.4 Thesis outline
Chapter one described this study‘s motivations including most Korean‘s two biases such as 1) Korean big businesses were built by the state and 2) a new Chaebol will be not appeared more, and research questions, also this chapter for the research mythology that leads to suitable research processes in a case study. Chapter two described analyses of STX group in terms of SWOT analysis, competitive advantages and financial performance. Chapter three reviewed eight theories, leadership, post-acquisition, and success factors of literature on M&A. Chapter four described the key principles to successful M&A of STX. And this chapter provided STX‘s secrets relevant M&A for a synergetic strategy. Lastly, chapter five and six concludes this thesis by key findings & discussions, besides shows a knowledge gap between literature and findings, and provides recommendations to rival in emerging market through this study.
24
Figure 7 Overview of the research Chapter 1 Research Motivation Chapter 3 Literature review - Theories - Post-M&A - Success factors - Leadership Chapter 2 & 4 A Case Study of STX - Financial performance - SWOT - Competitive advantagies - Principles of M&A Research Methodology Chapter 5 Findings and Discussion
Chapter 6 Recommendation
25
1.5 Research Methodology
The research process plays a critical role in research. To support researches and researchers, it is essential to understand the research process and its phases. Although the literature provides different research processes, these are often concentrated on specific research paradigms and methods. This study has applied research process by Graziano and Raulin (2009) since the method acquired its knowledge through observation (empiricism), but also through reasoning (rationalism) (Graziano & Raulin, 2009).
Figure 8 Research process
In adopting the adjacent model to this study, the process starts with the generation of an initial idea and the literature review in M&A since personal experience and existing research have served as an inspiration for a new research process. Since most academic studies have
Personal experience
Other's research
Initial Idea Research
definition Procedures design Observation Data analysis Interpretation
26
conducted almost every aspect of M&A, this study focuses on: 1) Theories of M&A, 2) Leadership, 3) Post-M&A, and 4) Success factors. In the next step, therefore, the research definition to be addressed is described in the form of research questions. The research procedure that should lead to the solution of the research question is defined in the procedure-design phase. The resulting research procedure-design determines the study participants and conditions as well as the data-collection and data analysis methods. After the observation has been carried out, the data is analyzed and interpreted (Graziano & Raulin, 2009).
In addition, the emphasis of a case is upon a deeper examination of the issue (Bryman and Bell, 2003) and the case study has been very popular in social science as time-honored approach for studying topics in organization science and management (Jensen and Rodgers, 2001). So this case study is conducted mainly based on explorative data obtained from their publications and press releases, local newspapers, magazines and annual reports and so on.
27
II. Analysis of STX Group
2.1 Businesses of STX
Since the establishment in 2001, STX has improved at an unprecedented pace including both sales and asset for a last decade as shown in Figure 9. The driving forces of such achievements were seizing new opportunities with M&A.
Figure 9 Total sales and assets of STX over time
STX continued with its M&A spree under a method in which it bought companies at low prices and listed them through initial public offering to recoup investment capital. Through these efforts, the group established a portfolio of four major business areas: shipbuilding and machinery, shipping and trade, plant engineering and construction, and energy. As a result, STX Group has ranked 12th in 2010 among Korean conglomerates excluding state-run
0.0 2.5 5.0 7.5 10.0 12.5 15.0 17.5 20.0 22.5 25.0 27.5 30.0 2001 2002 2003 2004 2005 2006 2007 2008 2009 2010 Year $B il li on- --Sales Asset
28
corporations as shown in Table 9.
Table 9 Company ranking in Korea3
Rank Company $ billion KRW billion 1 Samsung 173 192,850 2 Hyundai Motors 90 100,775 3 SK 78 87,522 4 LG 71 78,918 5 Lotte 60 67,265 6 POSCO* 47 52,877 7 GS 38 43,084 8 HHI 36 40,189 9 Gumho 31 34,942 10 Hanjin 27 30,387 11 KT** 24 27,099 12 Doosan 24 26,788 13 Hanhwa 23 26,391 14 STX 18 20,901 15 LS 14 16,179
Source: Korea Fair Trade Commission (April. 2010)
Its STX Group has been preparing for a new leap through enhancing the plant, construction and energy segments. The group plans to secure future energy sources through overseas construction projects, various kinds of plants and resource development as well as planting itself as one of global biggest companies in the shipbuilding and shipping segments, which
3
29
has led to the growth of the group over the last decade. Its company has successfully advanced into Africa, the Middle East, North America and Australia to carve out new markets. The Figure 10 illustrates the biggest sale is from Shipbuilding & machinery as one of sales portion by STX Group business sectors.
Source: Annual report of STX, 2010
Figure 10 Sales Portions by STX Group Business Sector in 2010
STX Group, however, will focuses on the percentage of the sales of non-shipbuilding and shipping segments to 25% for 2012, and add the green energy business sector into its four core business segments - shipbuilding & machinery, shipping & trade, construction & plant and energy - to attain $5.4bn (KRW 6trn) of sales in the green energy sector by 2015. Besides, it will enhance the competitiveness of wind & solar power sector, which is coming to the front, actively fostering the energy business.
Shipping & Trading 35% Shipbuilding & Machinery 46% Construction & Plant 6% Energy 13%
30
2.2 STX‘s M&A process
This study has improved STX‘s M&A steps based on ‗Five steps in evaluation M&A studies‘ of Langford and Brown, 2004. The following process in the case of STX is illustrated specifically for M&A with different strategies such as IPO and new entry segment strategies as shown in Figure 11.
Figure 11 Six steps of STX’s M&A process
Step 1: Planning
In the first step, STX has planed to identify targets and goals with their organizational strategy. For example, STX pursue to achieve synergies with its existing business so that the firm could find the target, Dae-dong shipbuilding which was under legal management; most managers might not see its value in terms of market power and vertical value chain. Thus, STX made a good deal because Dae-dong shipbuilding at the time had changed hands five times then nobody was having any of it.
Step 3 Screening •Synergy effects •IPO as a sound conservation strategy •New entry segment •Identify highest value targets •Generate a list of potential candidates Step 4 Evaluation •Estimation of Post-acquision value -Value-creation estimation -Valuation of targets Step 5 Negotition •Comparison of lowest- and highest value expectations Step 6 Integration & Tracking •Combined entity •Integration plan •Key lessons Step 1 Planning Step 2 Strategy •Identify acquisition goals
31
Step 2: Strategy
STX strategies could be roughly divided into two things such as IPO as a sound conservation strategy and new entry market segment based on vertical value chain. Firstly, being a public company comes with certain benefits, which can allow STX dramatic solid growth and redeem a huge capital invested. Secondly, the firm tried to build a new strong resource of growth through acquired Aker yard and gives STX a strong trace in the cruise ship and offshore service market.
Step 3: Screening
The third phase within the M&A Process is to search for possible takeover candidates which are thousands of businesses that could be potential candidates, but only a few that will ultimately meet its desired criteria. Finding them from the thousands of candidates is one of the important processes. The target companies must fulfill a set of criteria so that the target company is a good strategic fit with the acquiring company.
Step 4: Valuation
During this stage STX had conducted a study about the potential target company in terms of its assets, liabilities, equity, organizational structure, and market. The advising team analyses and assesses the optimum value of the company and how the value is realized in terms of cash, share exchange, etc. This phase of M&A is to perform a more detail analysis of the target company.
32
Step 5: Negotiation
The most common approach to acquiring another company is for both companies to reach agreement concerning the M & A. In this step, resistance might be expected from the target. For example, STX had experienced long and tough negotiations when to acquired Aker yard in Europe because of strong resistance from European workers and an antitrust investigation from the European Commission before it took full control of Aker Yards in 2008.
Step 6: Integration and Tracking
In the integration phase, STX could formulate an integration plan, implement the integration process following the plan, and facilitate the integration process regarding the organizational structure, procedures and processes, and human resource concerns. Also the firm have cumulated amount of valuable data through M&A in order to avoid further fail activities.
33
2.3 Financial performance of STX over time
2.3.1 Sales Revenue
Over the previous five year, major Korean competitors' sales have positive CAGR such as 13%, 17%, and 21% in dollar bases, a feat that is very rare in large companies.
HHI, the world's number one shipbuilder, grew only at 13% CAGR which is less than that of other competitors including STX. This means that, for instance, STX invested more aggressively than HHI to catch up with the recent peak.
Table 10 Sales Revenue by major competitors
Unit: $Million Sales 2005 2006 2007 2008 2009 CAGR % % % % HHI 10,111 13,139 30 16,717 27 18,100 8 16,564 (8) 13 SHI 5,416 6,647 23 9,168 38 9,672 5 10,259 6 17 DSME 4,603 5,652 23 7,646 35 10,044 31 9,748 (3) 21 STX OS 1,121 1,716 53 2,291 34 2,726 19 3,284 20 31 Total 21,251 27,154 28 35,822 32 40,542 13 39,855 (2) 17
34
2.3.2 Net cash positions expected in 2012
STX O&S is expected to show the fastest improvement of financials among all top-tier shipyards. In the middle of 2012, and expected to show net cash positions since currently (as of end of year 2010), the company has a net debt position of only $1.22 bn, with several cash drivers, as follows:
Table 11 Actual net debt trends of STX O&S
Unit: $billion
2009 2010 2011E 2012E 2013E Total debt 4.92 3.88 3.03 2.55 2.14 Cash and cash equivalents 1.27 1.48 1.20 1.62 1.86 Net debt reported 3.64 2.40 1.83 0.94 0.28 Construction loan 2.40 1.18 1.18 1.18 1.18 Actual net debt 1.25 1.22 0.66 -0.24 -0.90
Source: Mirea asset, 2010
2.3.3 Upside seen from price-to-sales & price-to-order book ratio
The appropriate valuation tools for STX O&S are price-to-sales ratio and price-to-order book ratio. Due to restructuring and the turn around of its subsidiaries, STX O&S is not yet providing earnings comparable with its peers. Also, considering its fast growth potential, profit-based multiples can distort its upside potential.
35
trading at 0.21x; less than half of DSME, and 1/3-1/4 of other major Korean yards. Based on price-to-order book, the company is further discounted. STX O&S is trading at only 0.10x, while others are trading at 0.25-0.75x. As STX O&S is expected to show 16-17% sales growth per annum, bigger discounts are found from price-to-order book ratio comparisons.
Table 12 Comparison with other major competitors yards (2010 consolidated basis, $bn)
HHI DSME SHI STX O&S Mipo
Consolidated revenue in '10 40.98 11.84 11.96 8.10 3.74
Consolidated net debt in '10 4.88 2.10 1.16 1.53 -1.54
Shareholders' equity as of 2010 14.05 3.54 3.16 1.22 4.02
Market cap (5 April 2011) 35.51 5.99 8.64 1.67 3.55
Enterprise value 40.39 8.10 9.80 3.20 2.01
Net debt to equity 0.00 0.00 0.00 0.00 Net value
Contract advances 8.92 4.07 4.52 2.00 1.63
Order book 47.62 24.36 26.77 16.76 7.96
2010 EBITDA 5.70 1.27 1.28 0.34 0.66
Price to book 2.53 1.7 2.73 1.36 0.88
Price to sales 0.87 0.51 0.72 0.21 0.95
Market cap/order book 0.75 0.25 0.32 0.1 0.45
Advances/order book 19% 17% 17% 12% 21%
EV/EBITDA 7.1 6.4 7.7 9.3 3.1
36
2.4 SWOT analysis of STX
The major strength of STX is its vertically integrated value chain. Besides, on-time delivery, economies of scale, quality, and highly skilled labor are also the strong points of STX. The weakness of the industry is basically its high labor costs as compared with China. Also, the firm has excess capacity due to the economic recession in the country so that its firm is highly vulnerable to the business fluctuations due to a portfolio of business concentrated on shipbuilding and shipping.
Table 13 SWOT of STX
Strengths Weakness
• Vertically integrated value chain • Access to skilled labors
•A portfolio of business concentrated on shipbuilding and shipping
•High labor costs relative to competitors as labor cost leaders
Opportunity Threats
•Specialization in Cruise market as a new segment
•Greening of shipbuilding industry •Increasing demand of High valued ships
•Competitors moving up the ladder
•Demand shift from Korean to Chinese buyers •Flexible and swift competitor‘s governments to support their industry
The opportunities afforded to STX are investment in Research & Development for green energy using its subsidiaries such as STX wind power and solar, and entry into both emerging markets and new segments. After acquiring Aker yards specialized in cruise fleet, STX is the first Korean shipbuilder to ever reach the cruise market. The sources of threat to STX are mainly China, India, and Vietnam who compete with Korea on price. Another major threat is
37
decrease in shipbuilding orders in recent years due to the economic recession and the big three ship players‘ announcement to enter into the cruise market and green energy segment.
2.5 Analysis of Competitive advantages
STX group pursues an ambidextrous strategy. Ambidexterity means on the one hand seeking for more efficient (low cost) operations with Dalian Shipyard, while on the other hand seeking more diversification through both innovation and specialization in Cruise market.
2.5.1 The greatest vertical integration
STX has built a vertically-integrated business structure, covering the areas of ship component, ship engine, shipbuilding, shipping and even energy and power plant since STX pursues a rather different strategy than Chinese, Japan and European shipbuilders. The vertical integration will give STX various advantages such as timely supply of components, consistent quality control, stability of cash flow and faster growth opportunities.
Advantages of vertical integration can be found in:
1) Timely supply of components: Shipyards can sustain timely deliveries of ships and expand capacity faster, to follow plenty market demand due to having ship component makers as affiliates.
38
2) Consistent quality control: Quality of ships could be secured by having ship component makers, as they can control the quality of the assembled.
3) Stability of cash flow: Proper cash flow control can be achieved by having shipping company and shipbuilder together, offsetting the highly volatile cash flows of both. Shipyards‘ cash inflows tend to lag behind those of shipping companies.
4) Faster growth opportunities: Having secured supplies, STX can expand capacity faster than peers, whenever required. Also, through its affiliates, STX Pan Ocean can secure shipbuilding slots ahead of competitors.
Moreover the company has the ability to build every type of vessels ranging from LNG carriers, containerships, tankers and bulk carriers to drill ships, cruise ships, offshore service vessels and ice breakers.
Source: Clarksons
Figure 12 Vertically valued chain structure of STX
The scope of the STX shipbuilders is also much larger since vertically integrated value chain Ship component Ship engine Shipbuilding & plant Shipping & Trade Energy & power plant •STX Metal •STX Engine •STX Heavy Industries •STX Dalian •STX ONS •STX Europe •STX Dalian •STX Heavy Industries •STX Construction •STX Panocean •STX Corp •STX Energy •STX Solar •STX Corp
39
allows the firm to run in different businesses. For instance STX entered the wind turbine market after buying Harakosan Europe B.V in 2009. Thus, losses in the shipbuilding units can be compensated by other business units. Furthermore the firm avails of much more equity than the smaller sized Chinese and European firms.
2.5.2 Business Diversification: High valued ship building
Given their structure, size and value chain, STX can diversify more easily than other competitors; it has equity to acquire businesses in new shipbuilding market segments for instance the acquisition of Aker Yards by STX and technology to innovate with the changing demands of their customers. Already from the 2007, STX is moving more and more from the low end to higher market segments as shown in Figure 12. STX Shipbuilding Company now incorporates an offshore business. Its company all endeavor to be specialist of both offshore and general shipbuilding. For instance, STX Shipbuilding recently changed its name to STX Offshore and Shipbuilding (STX O&S). This focus will clearly result in heavier competition for the European (mainly Norway) shipbuilders that are specialized in this segment.
STX is stepping up efforts on Cruise ships as one of the High Value ship segment, with STX Offshore & Shipbuilding acquiring a stake in Aker Yards (of Norway) to penetrate this segment, while only SHI among Korean‘s competitors has announced plans to develop cruise ships.
40 Source: Korea Shipbuilder‘s Association and STX website
Figure 13 Shipbuilding diversification of STX
Oil Tanker Bulk Carrier
Container Ship Roll on/Roll off (Ro-Ro)
Chemical Tanker Ferry
Designed to cary crude oil in bulk.
Designed to carry relatively small parcels of higher value chemicals, such as acids or polymers.
Desinged to carry dry cargo in bulk.
Desinged to carry wheeled cargo such as automobiles or railroad cars.
Desinged to carry primarily passengers, and sometimes vehicles and cargo.
Standard ships
FPSO (FLOATING Production Storage offloading ) LPG Carrier
LNG Carrier
Cruise Ship
Designed to carry liquid natural gas at
temperatures of around -160˚C.
A tank ship designed to carry liquefied propane or butane in a rpessurized environment.
Designed for holiday voyages, where the voyage itself and the ship's amentities are part of the experience.
Vessel fitted with drilling apparatus. Used for exploratory offshore Oil & Gas drilling or scientific purposes.
High Value Ships
Load carrried in truck-size intermodal containers (containerization technique).
41
2.5.3 In strategic alliance with a LNG Firm of transportation and Regasification Solutions
STX Offshore & Shipbuilding ties with Norway's TORP (Terminal Offshore Regas Plant) LNG AS to cooperate in LNG transportation and regasification. TORP LNG holds proprietary technology in the sector and is actively carrying out many related projects on back of the advanced technology. Both strengthen their partnership through exchanging information, attending bids together and jointly conducting construction projects to respond to the fast growing LNG market.
In particular, STX is responsible for designing construction, purchasing equipment and building: EPC (Engineering, Procurement & Construction). The biggest synergy effect expects to be seen in the LNG project market through the latest strategically agreement since TORP's advanced and proprietary technology makes a harmony with STX's shipbuilding capacity. STX takes advantage of a dominant position in the LNG market supposed to grow dramatically in the near future through the recent cooperative agreement.
2.5.4 Cost leadership: STX Dalian Shipyard
STX shipbuilder is also faced with increasing labor costs. This has already resulted in a shift to a low cost country in the region. For instance, STX established Dalian Shipyard in China. Dalian shipyard, in operation from 2008, is the first shipyard that STX constructed at abroad
42
site. STX expects this shipyard will play a role as a center for 'global STX'. Dalian shipyard started to construct at the site of 5.5million ㎡ in March 2009 as a offshore & shipbuilding total production base. So STX Dalian in China allows its company to be a labor cost leader.
2.6 du Pont Analysis
The DuPont identity is generally accepted as a strategy assessment tool with which to evaluate a company‘s capital efficiency and management capability (Firer, 1999; Grant, 2008). The ROIC, which stands for management‘s ability to advance and sustain shareholder value (Cao et al., 2006), is an appropriate measure of profitability for strategy formulation (Porter, 2008: p. 83). The ROIC is the return the company earns on each dollar invested in the business (Koller et al., 2005:61) and can be segregated into two parts: (1) how efficiently the resources are allocated and utilized (measured by NOPM, Net Operating Profit Margin), and (2) how effectively the resources are leveraged and managed (measured by Capital Turnover):
Turnover Capital NOPM IC S S NOPLAT IC NOPLAT ROIC , (1)
Where, ROIC (Return On Invested Capital), NOPLAT (Net Operating Profit Less Adjusted
Taxes) = EBIT × (1 – tax rate), and IC (Invested Capital) = (Fixed Assets + Current Assets) –
Non-Interest-Bearing Liabilities. EBIT refers to Earnings before Interest and Tax, and S to Sales. The NOPM can be further decomposed into a function of selling price and unit cost:
43
p Q c Q
p Q
p c
p
c p
NOPM / / 1 / , (2)
where p = selling price, c = the firm‘s cost of producing the product, and Q = sales volume. Equations (2) shows that the sustainable competitive advantage of firm i can be obtained by pursuing either Porter‘s (1991) two generic strategies or by a blue ocean strategy (Kim and Mauborgne, 2004; Leavy, 2005: 14) that is by; (1) setting a high price level, such as by product differentiation, to yield high resource-produced value, given appropriate cost (Porter, 1991); (2) setting a relatively low unit cost, such as by efficient use of machines, human resources and other resources—to create economics of scale, given appropriate price (Porter, 1991); and (3) the blue ocean strategy, the simultaneous pursuit of differentiation and low cost (Leavy, 2005: 14) by enlarging profit margin through a high price from customers while maintaining a low cost of supply.
Equation (1) indicates that, outside of cost-leading and differentiation strategies, the value of the sustainable competitive advantage can be magnified by the effective use of a firm‘s infrastructure and tangible assets (Ichniowski, Shaw and Prennushi, 1997, Peteraf and Reed, 2007). For example, Dell‘s ―direct‖ business model brings the firm a higher price and a lower cost structure than those of its rivals. The competitiveness of Dell‘s cost advantage is revealed in its high inventory turnover rate, which results in a low cost-of-goods-sold and inventory cost (Rivkin and Porter 2001). Zara, another example, generates competitive advantage from an extremely quick response system. The high profit margin (p – c), the low working capital
44
to sales ratio, and the high asset turnover contribute to its high return on equity (Ghemawat, 2004; Ghemawat and Nueno, 2006). From equation (2), we know that, if the firm has a positive profit margin, the invested resource bundles in which it invests are efficaciously consolidated to stimulate revenue.
Table 14 du Pont identity
Profit margin Total assets turnover Equity multiplier ROE
Company 2010 2009 2008 2010 2009 2008 2010 2009 2008 2010 2009 2008
STX 0.01 -0.08 0.01 1.1 0.9 1.1 3.2 3.0 2.3 0.03 -0.20 0.02 HHI 0.17 0.10 0.11 0.8 0.9 0.8 2.1 2.5 4.5 0.27 0.22 0.40 SHI 0.07 0.05 0.06 0.7 0.6 0.4 4.7 7.1 11.2 0.23 0.24 0.27 DSME 0.06 0.05 0.04 0.9 0.8 0.7 3.5 4.6 7.7 0.19 0.18 0.19 Source: Annual report of four companies from 2008 to 2010
In Table 14, the profit margins of STX are lower than numbers of other competitors though those of its company increased from 2009 to 2010. HHI, the biggest competitor in the world, has the highest profit margin compared to other players. In terms of total assets turnover, those of STX are slightly higher than others, which mean STX‘s efficiency using assets to increase sales is better than other shipbuilding giants. Lastly, numbers shows financial leverage measured by equity multiplier, which means how much companies rely on debt to finance its assets. The equity multiplier of SHI is higher than other shipbuilders; those of STX are stable in comparison with peers, but slightly increased.
45
III. Literature review
In simple describes literature review can be explained as an account of what has been published by various accredited researchers and scholars on a particular subject or topic (Taylor and Procter, 2008). Thus in this chapter, this paper will review the various findings that have been done on the subject of Mergers and acquisitions. Before I begin with my own investigation and research, it is very important to know what are the diverse findings done till date by various researchers.
3.1. Mergers and acquisitions
The terms ―merger‖ and ―acquisition‖ are often used interchangeably in many studies. The topic of mergers & acquisitions has been increasingly researched in the literature in the last two decades (Appelbaum et al., 2007) in response to the rise in M&A activities as well as the increasing complexity of such transactions themselves (Gaughan, 2002). The advantages of having this kind of business combinations include achieving economies of scale, combining complementary resources, garnering tax advantages and eliminating inefficiencies (Coffee, Louis & Susan, 1988). M&A have been seen as a corporate strategy that receives wide acceptance. The distinction (between merger and acquisition) may not actually matter, since the net result is often the same: two (or more) companies that previously had separate
46
ownership operate as one firm after the M&A deal takes place, usually in order to attain some strategic or financial objectives (Sherman and Hart, 2006). However, the objective of this section is to define what is meant by mergers and acquisitions (researched by Stephen R. Foerster, & Dominique Fortier, 2000) to be classified into small groups below.
Figure 14 Classification of M&A’s definition
1) Merger means any transaction that forms one economic unit from two or more previous ones. There are several different types of mergers.
Horizontal mergers involve two firms operating in the same kind of business. Vertical mergers involve different stages of production and operations.
M&A Horizontal mergers Vertical mergers Conglomerate mergers Merger Acqusition Leveraged buy-outs Management buy-out Joint ventures Sell-offs Spin-off Divestiture
47
Conglomerate mergers involve firms engaged in unrelated business activity. 2) Acquisition means that company X buys company Y and acquires control. When
Discussing M&A activity, there a number of other terms that are often used.
Leveraged buy-outs (LBOs) involve the purchase of the entire public stock interest of a firm, or division of a firm, financed primarily with debt.
Management buy-out (MBO) refers the transaction is by management. If the shares are owned exclusively by the acquiring party (e.g., management), rather than third-party investors, the transaction is called going private, and there is no market for trading its shares.
Joint ventures involve the joining together of two or more firms in a project or enterprise. In these cases, equity participation and control are decided by mutual agreement.
3) Sell-offs are considered the opposite of mergers and acquisitions. The two major types of sell-offs are spin-offs and divestitures.
Spin-off involves a separate new legal entity is formed with its shares distributed to existing shareholders of the parent company in the same proportions as in the parent company.
Divestitures involve the sale of a portion of the firm to an outside party wit cash or equivalent consideration received by the divesting firm.
48
The volume of mergers and acquisitions (M&A) has greatly expanded over the past quarter century, particularly in developed markets. Once a U.S. business phenomenon, M&A deals are now commonly used by corporations throughout the world to pursue their goals and objectives related to strategic growth (Gaughan, 2005). M&A have long played a critical role in the growth of firms: Growth is generally viewed as vital to the well-being of a firm (Stephen R. Foerster, & Dominique Fortier, 2000).
All U.S industries have been impacted by mergers and acquisitions deals, with most large firms in the U.S. economy being to some extent products of past M&A (Mueller, 1997). At the same time, academics have developed a series of theories and hypotheses to explain and predict the M&A phenomenon. These theories and hypotheses cover many issues related to mergers and acquisitions, from motives, attitudes, and approaches to the consequences of the transactions, from short-term to long-term performance, and from corporate governance to joint ventures and strategic alliances, which are alternatives to mergers and acquisitions deals. These ideas, derived from theoretical and/or empirical studies based on U.S. data, have been shown to be valid in explaining M&A deals in continental European markets (Tichy, 2001).
49
3.2. Overview of Theories in M&A
Merger and acquisition has brought forth a total of seven different theories (Lubatkin, 1983). Gort‘s (1969) disturbance theory and those approaches that view mergers as process outcomes belong in the second category. Firstly, the category most theories focus on shareholders‘ interests while one group focuses on managers‘ interests and their deviations from shareholder value maximization as showed in Figure 15.
Merger as rational choice
Merger benefits bidder's
shareholders
Net gains through
synergies Efficiency theory
Wealth transfers from
customers Monopoly theory
Wealth transfers from
target's shareholders Raider theory
Net gains through
private information Valuation theory
Merger benefits managers Empire-building
theory
Merger as process outcome Process theory
Merger as macroeconomic phenomenon Disturbance theory
Source: Trautwein, 1990
Figure 15 Theories of M&A motives