Measurement of the concentration of a solution
with surface plasmon resonance heterodyne
interferometry
Kun-Huang Chen Cheng-Chih Hsu
Der-Chin Su,MEMBER SPIE National Chiao Tung University Institute of Electro-Optical Engineering 1001 Ta-Hsueh Road, Hsin-Chu 300 Taiwan
E-mail: [email protected]
Abstract. A linearly polarized light beam is incident on the boundary surface between the thin metal film of a surface plasmon resonance (SPR) apparatus and the tested solution. If the incident angle is very near to the resonant angle, then the phase difference betweenp- and s-polarizations of the reflected light is changed with the concentration of the solution. The phase difference can be measured accurately by het-erodyne interferometry. Based on these effects, a method for measuring the concentration of a solution is presented. Because the reflected light is measured, only a small quantity of the solution is required. In addition, the method has the advantages of both common-path interferometry and heterodyne interferometry. © 2003 Society of Photo-Optical Instrumentation Engi-neers. [DOI: 10.1117/1.1577115]
Subject terms: surface plasmon resonance; concentration measurement; hetero-dyne interferometry.
Paper 020333 received Jul. 31, 2002; revised manuscript received Dec. 2, 2002; accepted for publication Dec. 10, 2002.
1 Introduction
Concentration measurements are often operated in chemical,1,2 biochemical,3 and biomedical3 analysis pro-cesses. To make the processes smooth, it is necessary to develop an easy and simple method for measuring the con-centration of a solution in real time. Several optical methods4 –7have been presented for measuring the concen-tration of a solution. Almost all of them measure the inten-sity variation of the transmitted light. The method using the surface plasmon resonance effect was also proposed,7but it also measures the intensity variation of the reflected light. However, the stability of light source, the scattering light, the internal reflection, and other factors influence the accu-racy of the measurement. On the other hand, an optical polarized heterodyne polarimeter3 was proposed by mea-suring the phase variation of the transmitted light. But be-cause it measured the transmitted light, it is necessary to know the optical path length of the solution in advance and the optical setup becomes more complicated. Moreover, the quantity of the test solution should be more than a threshold amount to make the measurand detectable.
To overcome these drawbacks, we propose an improved method for measuring the concentration of a solution by using surface plasmon resonance 共SPR兲 heterodyne inter-ferometry. A linearly polarized light passes through the glass material and the thin metal film coated on this glass material, as shown in Fig. 1. Then, it is incident on the boundary surface between the thin metal film and a test solution. If the incident angle is very near to the resonant angle, the surface plasmons can be excited.7,8The surface plasmons are the longitudinal electron density fluctuations excited on the boundary surface and are accompanied by an evanescent electromagnetic field at the boundary surface emitted from the thin metal film to the solution.
Conse-quently, the phase difference between the s-and the p-polarizations of the light reflected at the boundary surface between the thin metal film and the solution is changed with the refractive index of the solution. Its refractive index is related to the concentration. The phase difference can be accurately measured using heterodyne interferometry. From the data of the phase difference, the concentration of the test solution can be estimated. Because the light reflected from the test solution is measured, only a small quantity of solution is required. In addition, the method has the advan-tages of both common-path interferometry and heterodyne interferometry.
2 Principle
2.1 Phase Difference of Reflected Light
A linearly polarized light beam enters one surface of the SPR apparatus, as shown in Fig. 1. This apparatus has a Krestschmann configuration9and is an isosceles right-angle prism with a thin metal film of thickness d2 deposited on the hypotenuse surface. This linearly polarized light beam is incident at an angle on the hypotenuse surface. For convenience, the numbers 1, 2, and 3 are labeles in Fig. 1 to represent the media of glass共prism兲, metal 共film兲, and the test solution. Their refractive indices are n1, n2, and n3, respectively. If is very near to the resonant angle sp, then surface plasmons are excited. Thus, the reflection co-efficient can be expressed as7
rq⫽ r12q ⫹r23q exp共i2kz2d2兲 1⫹r12q r23q exp共i2kz2d2兲 ⫽兩rq兩exp共iq兲q⫽p,s, 共1兲 where rab p and rab s
are the Fresnel reflection coefficients of
1884 Opt. Eng. 42(7) 1884–1887 (July 2003) 0091-3286/2003/$15.00 © 2003 Society of Photo-Optical Instrumentation Engineers
p- and s-polarizations as the light beam propagates from medium a to medium b, and kza is the component of the
wave vector in medium a along the z direction. They can be written as rabp ⫽nb 2 kza⫺na 2 kzb nb2kza⫹na 2 kzb a, b⫽1, 2, 3, 共2a兲 rabs ⫽kza⫺kzb kza⫹kzb , 共2b兲 and kza⫽k0共na 2⫺n 1 2 sin2兲1/2, 共2c兲
respectively, where k0 is the free-space wave vector. Then the phase difference variations between p- and s-polarization components is given as
⫽p⫺s. 共3兲
It is obvious from Eqs.共1兲 to 共3兲 that the phase difference is strongly dependent on n3. In general, the refractive in-dex n3of a solution relates to its concentration5,7,10c. If the relation curve of the phase differenceversus the concen-tration c is specified, then the concenconcen-tration c can be esti-mated with the measurement of the phase difference. 2.2 Phase Difference Measurements with
Heterodyne Interferometry
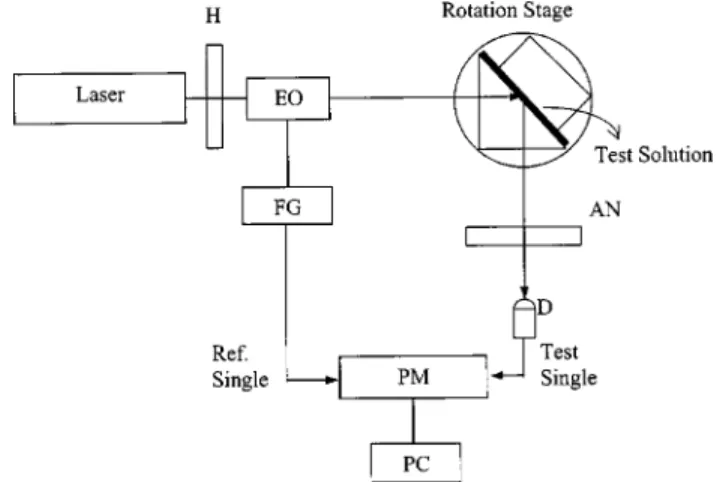
A schematic diagram of the optical arrangement of our method, which is based on Chiu et al.’s11 considerations, was designed and is shown in Fig. 2. A linearly polarized light passes through a half-wave plate H and its polariza-tion plane is at␣with respect to the horizontal axis. Then it passes through an electro-optic modulator EO, and is inci-dent on the boundary surface between an SPR apparatus and a test solution. The incident angle to the boundary surface is very near to the resonant angle sp of the SPR apparatus. The reflected light passes through an analyzer AN with the transmission axis at 45 deg to the horizontal axis and it is detected by a photodetecor D. The fast axis of EO is in the horizontal direction, and a sawtooth voltage signal with angular frequency and amplitude V/2, the half-voltage of EO, is applied to EO. Consequently, the intensity measured by D can be derived as11
It⫽兩Et兩2⫽1 4关rp
2cos2␣⫹r
s
2sin2␣
⫹2rprscos␣sin␣cos共t⫹兲兴, 共4兲
and It is the test signal. On the other hand, the electrical
signal generated by the function generator FG is filtered and becomes the reference signal. It has the form as Ir⫽1
2关1⫹cos共t兲兴. 共5兲
Both of these two sinusoidal signals are sent to a phase meter PM, hencecan be measured accurately. By substi-tuting the data of into the specified relation curve of phase difference versus concentration c, the associated concentration can be estimated.
3 Experiments and Results
To demonstrate the feasibility of this method, saltwater, glucose solution, acetone, and ethanol were tested at room temperature, 20°C. An SPR apparatus consisting of a BK7 prism and a thin gold film of thickness 35 nm was used. A He-Ne laser with wavelength 632.8 nm and an electro-optic modulator共Mode 4002, New Focus, Inc.兲 with a half-wave voltage of 125 V were used in these tests. The frequency of the sawtooth signal applied to the EO modulator was 1 kHz. The refractive indices of a BK7 prism and a thin gold film were measured with an ellipsometer共Model eta, Stag Inc.兲 and they are 1.5151 and 0.1973⫹i3.5631 at wave-length 632.8 nm, respectively. A high-resolution rotation stage 共Model URM 80, Newport兲 with angular resolution 0.001 deg was used to mount the SPR apparatus and the test solution. The azimuth angle␣of the half-wave plate H was 10 deg with respect to the horizontal axis. A phase meter with angular resolution 0.01 deg was used to measure the phase difference. A personal computer was used to record and analyze the data. First, we estimated the reso-nant angle for each solution of concentration 5 mg/ml by measuring the critical minimum reflectance.6,7 They are 71.1, 71.09, 71.04, and 71.03 deg for saltwater, glucose
Fig. 1 Reflection in an SPR apparatus.
Fig. 2 Schematic diagram for measuring the phase difference of the
reflected light: H, half-wave plate; EO, electro-optic modulator; FG, function generator; PM, phase meter; AN, analyzer; D, detector; PC, personal computer.
Chen, Hsu, and Su: Measurement of the concentration . . .
1885 Optical Engineering, Vol. 42 No. 7, July 2003 Downloaded From: http://opticalengineering.spiedigitallibrary.org/ on 04/27/2014 Terms of Use: http://spiedl.org/terms
solution, acetone, and ethanol, respectively. Then we set the incident angles to be 71.1, 71.09, 71.04, and 71.03 deg for these four test solutions in our experiments, respectively. Although they did not exactly equal the associated resonant angles for the concentrations of the test solutions, they were still very near to the associated resonant angles. The mea-sured results and their fitting curves are shown in Fig. 3. In this figure, the symbols䊏, 䉱,*, and䊉 represent the mea-surement data of saltwater, glucose solution, acetone, and ethanol, respectively. It is seen that the four fitting curves are nearly straight lines with different slopes. Hence this method can be realized if the relation curve of phase dif-ferenceversus concentration c for another test solution is specified in advance, then the concentration c can be esti-mated from the measurement of.
4 Discussion
Because is very near to the resonance angle sp, the reflection coefficient rp is very small. A half-wave plate H
is located before the EO so as to increase the component of p-polarization of the incident light. Consequently, the con-trast of the test signal is enhanced. In our experiments, the angle between its fast axis and the horizontal axis is set to 10 deg, the contrast of the test signal is about 0.88.
The slopes of the fitting curves for saltwater, glucose solution, acetone, and ethanol in Fig. 3 are 1.092, 0.917, 0.474, and 0.364 deg ml/mg, respectively. Considering the second-harmonic error, the polarization-mixing errors, and the angular resolution of the phase meter, the total phase difference errors ⌬ can be decreased to 0.03 deg in our experiments.12Substituting these data and the slope of each fitting curve into the equation
⌬⫽s⌬c, 共6兲
the error ⌬c of the concentration can be calculated. They are 2.75⫻10⫺2, 3.27⫻10⫺2, 6.33⫻10⫺2, and 8.24 ⫻10⫺2mg/ml for saltwater, glucose solution, and ethanol, respectively.
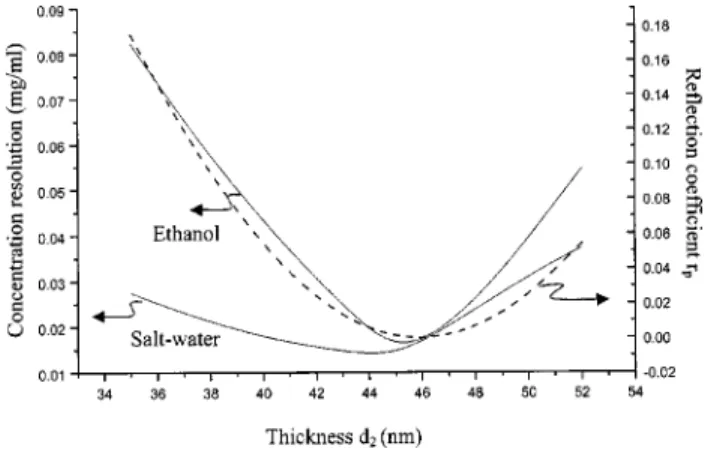
Substituting the measured results into Eqs.共1兲 to 共3兲, the relation curves of the concentration resolution and the re-flection coefficient rp for saltwater and ethanol can be
de-picted as shown in Fig. 4. From Fig. 4, it is obvious that
high resolution may be obtained as d2ⱌ45 nm, but its as-sociated rp is too low and its associated test signal cannot be detected. To comprise these conditions, the condition d2⫽35 nm is chosen in our experiments.
The resonant angle varies slightly with the concentration of a test solution. In our experiments, the concentration of each test solution was varied from 5 to 50 mg/ml. Thus, the resonant angle for saltwater, glucose solution, acetone, and ethanol, changes from 71.1 to 72.08, 71.09 to 71.9, 71.04 to 71.46, and 71.03 to 71.35 deg, respectively. In the experi-ment, we fixed the incident angle to be the resonant angle of 5 mg/ml solution for convenience, that is, 71.1, 71.09, 71.04, and 71.03 deg for saltwater, glucose, acetone, and ethanol, respectively. Hence the fitting curves in Fig. 3 are suitable only for these four tested solutions with the con-centration is in the range between 5 and 50 mg/ml. If the relation curve of the phase differenceversus the concen-tration c for another solution is specified in advance, then its concentration c can be estimated from the measurement of under the specified range. In addition, this method is suitable only for a solution with a refractive index smaller than that of the prism.
5 Conclusion
An optical method for measuring the concentration of a solution was presented based on the surface plasmon reso-nance effect and heterodyne interferometry. It was experi-mentally confirmed that under our experimental conditions, it is convenient to obtain the concentration of a solution such as saltwater, glucose solution, acetone, and ethanol. Their resolutions are about 2.75⫻10⫺2, 3.27⫻10⫺2, 6.33 ⫻10⫺2, and 8.24⫻10⫺2 mg/ml, respectively. Only a small quantity of solution is required for the measurements. In addition, the method has the advantages of both common-path interferometry and heterodyne interferometry, such as high stability, high resolution, and easy operation.
Acknowledgment
This study was support in part by National Science Coun-cil, Taiwan, under contract NSC 90-2215-E-009-077.
Fig. 3 Measurement data and the fitting curves of phase difference
at different concentrations.
Fig. 4 Relation curves of concentration resolution and reflection
co-efficientrpversus thicknessd2. Note that the reflection curves for saltwater and ethanol are almost identical and superimpose each other.
Chen, Hsu, and Su: Measurement of the concentration . . .
1886 Optical Engineering, Vol. 42 No. 7, July 2003
References
1. K. Matsubara, S. Kawata, and S. Minami, ‘‘Optical chemical sensor based on surface plasmon measurement,’’ Appl. Opt. 27, 1160–1163
共1988兲.
2. J. Fraden, ‘‘Chemical sensors,’’ Chap. 17 in Handbook of Modern
Sensors, 2nd, pp. 504 –512, American Institute of Physics Press, New
York共1997兲.
3. T. P. Vikinge, K. M. Hansson, J. Benesch, K. Johansen, M. Ranby, T. L. Lindahl, B. Liedberg, I. Lundstom, and P. Tengvall, ‘‘Blood plasma coagulation studied by surface plasmon resonance,’’ J. Biomed. Opt.
5共1兲, 51–55 共2000兲.
4. C. M. Feng, Y. C. Huang, J. G. Chang, M. Chang, and C. Chou, ‘‘A true phase sensitive optical heterodyne polarimeter on glucose con-centration measurement,’’ Opt. Commun. 141, 314 –321共1997兲. 5. Y. Lin, P. Hering, and M. O. Scully, ‘‘An integrated optical sensor for
measuring glucose concentration,’’ Appl. Phys. B: Lasers Opt. 54, 18 –23共1992兲.
6. K. S. Johnston, K. S. Booksh, T. M. Chinowsky, and S. S. Yee, ‘‘Per-formance comparison between high and low resolution spectropho-tometers used in a white light surface plasmon resonance sensor,’’
Sens. Actuators B 54, 80– 88共1999兲.
7. Y. C. Cheng, W. K. Su, and J. H. Lion, ‘‘Application of a liquid sensor based on surface plasma wave excitation to distinguish methyl alcohol from ethyl alcohol,’’ Opt. Eng. 39, 311–314共2000兲.
8. C. H. Liao, C. M. Lee, L. B. Chang, and J. H. Tsai, ‘‘Effects of a metal film and prism dielectric on properties of surface plasmon resonance in a multilayer system,’’ Jpn. J. Appl. Phys. 36, 1105–1111共1997兲. 9. E. Kretschmann, ‘‘The determination of the optical constants of
met-als by excitation of surface plasmons,’’ Z. Phys. 241, 313–324共1971兲. 10. W. Lu and W. M. Worek, ‘‘Two-wavelength interferometric technique for measuring the refractive index of salt-water solution,’’ Appl. Opt.
32, 3992– 4002共1993兲.
11. M. H. Chiu, J. Y. Lee, and D. C. Su, ‘‘Refractive-index measurement based on the effects of total internal reflection and the uses of hetero-dyne interferometry,’’ Appl. Opt. 36, 2936 –2939共1997兲.
12. M. H. Chiu, J. Y. Lee, and D. C. Su, ‘‘Complex refractive-index measurement based on Fresnel’s equations and the uses of heterodyne interferometry,’’ Appl. Opt. 38, 4047– 4052共1999兲.
Kun-Huang Chen received his MS degree in 2001 from the
Insti-tute of Electro-Optical Engineering of National Chiao Tung Univer-sity, Taiwan, where he is currently working toward a PhD degree in optical metrology. His current research activities involve a surface plasmon resonance sensor and an optical sensor.
Cheng-Chih Hsu received his MS degree from the Institute of
Ap-plied Physics, Chung Yuan Christian University, Taiwan, in 1998 and he is now working toward his PhD degree in optical metrology at the Institute of Electro-Optical Engineering, National Chiao Tung Univer-sity. His current research activities concern optical metrology and nondestructive testing.
Der-Chin Su received his BS degree in physics from the National
Taiwan Normal University in 1975 and his MS and PhD degrees in information processing from the Tokyo Institute of Technology in 1983 and 1986, respectively. He joined the faculty of the National Chiao Tung University in 1986, where he is currently a professor with the Institute of Electro-Optical Engineering. His current re-search interests are in optical testing and holography.
Chen, Hsu, and Su: Measurement of the concentration . . .
1887 Optical Engineering, Vol. 42 No. 7, July 2003