A New Microsphere-Based Immunoassay for Measuring
the Activity of Transcription Factors
Yu-Ling Lin&Yun-Ju Lai&Nu-Man Tsai& Tai-Chu Peng&Yen-Ku Liu&Ru-Ping Lee& Chueh-Jen Tsai&Kuang-Wen Liao
Received: 14 September 2009 / Accepted: 16 March 2010 / Published online: 14 April 2010 # The Author(s) 2010. This article is published with open access at Springerlink.com
Abstract There are several traditional and well-developed methods for analyzing the activity of transcription factors, such as EMSA, enzyme-linked immunosorbent assay, and reporter gene activity assays. All of these methods have their own distinct disadvantages, but none can analyze the changes in transcription factors in the few cells that are
cultured in the wells of 96-well titer plates. Thus, a new microsphere-based immunoassay to measure the activity of transcription factors (MIA-TF) was developed. In MIA-TF, NeutrAvidin-labeled microspheres were used as the solid phase to capture biotin-labeled double-strand DNA frag-ments which contain certain transcription factor binding elements. The activity of transcription factors was detected by immunoassay using a transcription factor-specific antibody to monitor the binding with the DNA probe. Next, analysis was performed by flow cytometry. The targets hypoxia-inducible factor-1α (HIF-1α) and nuclear factor-kappa B (NF-κB) were applied and detected in this MIA-TF method; the results that we obtained demonstrated that this method could be used to monitor the changes of NF-κB or HIF within 50 or 100 ng of nuclear extract. Furthermore, MIA-TF could detect the changes in NF-κB or HIF in cells that were cultured in wells of a 96-well plate without purification of the nuclear protein, an important consideration for applying this method to high-throughput assays in the future. The development of MIA-TF would support further progress in clinical analysis and drug screening systems. Overall, MIA-TF is a method with high potential to detect the activity of transcription factors.
Keywords transcription factor . microsphere-based immunoassay . NF-κB . HIF-1
1 Introduction
Transcription factors (TFs) are nuclear proteins that bind to the elements upstream of promoter genes, thereby regulat-ing gene expression [1]. Thus, aberrant activity of TFs (such as oncogenic transcription factors) may lead to a broad range of dysfunctions of human and animal cells,
Yu-Ling Lin, Yun-Ju Lai and Tai-Chu Peng contributed equally to this work.
Dr. Kuang-Wen Liao and Dr. Ru-Ping Lee contributed equally to this work.
Y.-L. Lin
:
Y.-J. Lai:
Y.-K. Liu:
K.-W. Liao Institute of Molecular Medicine and Bioengineering, National Chiao Tung University,Hsinchu, Taiwan, Republic of China N.-M. Tsai
School of Medical Laboratory and Biotechnology, Chung Shan Medical University,
Taichung, Taiwan, Republic of China T.-C. Peng
Department of Nursing, Tzu Chi College of Technology, Hualien, Taiwan, Republic of China
R.-P. Lee
Department of Nursing, Tzu Chi University, Hualien, Taiwan, Republic of China C.-J. Tsai
Department of Family Medicine, Hualien Hospital, Department of Health, Executive Yuan,
Hualien, Taiwan, Republic of China K.-W. Liao (*)
Department of Biological Science and Technology, National Chiao Tung University,
300 Room 205 Zhu-Ming Building, 75 Bo-Ai Street, Hsin-Chu, Taiwan, Republic of China
e-mail: [email protected] DOI 10.1007/s12575-010-9030-z
causing diseases such as cancers [2,3]. Therefore, TFs are potential cellular bioindicators for medical diagnosis and targets for drug development [4]. Examples of such important TFs are nuclear factor-kappa B (NF-κB) and hypoxia-inducible factor-1 (HIF-1).
To analyze the potential activation of transcription factors in tumors, it is necessary to develop a simple method to measure the DNA binding capacity of target proteins. Although Western blotting is a good method to detect the content of specific proteins, it can only provide information regarding the total number of the target TFs. Western blotting cannot be used to distinguish between active or inactive TFs [5]. The activity of transcription factors are not always correlated with the TF amounts present in the cells; only the active TFs bound to the transcription factor binding site represent instances of gene expression [6]. Electrophoresis mobility shift assay (EMSA) is the current method used to detect the activity of TFs. Essentially, dsDNA probes containing the TF binding sequences are labeled with the [32P]-radioisotope, and the activity of TFs is determined after electrophoresis based on radioactivity levels. In addition, non-radioactive EMSA has been developed, but it is limited by high background and long detection time [5]. Although EMSA can be used to measure the activity of TFs, the devices required and steps of the EMSA procedure do not provide possibilities to develop a high-throughput assay. Although modified enzyme-linked immunosorbent assay (ELISA) assays were developed for measuring the activity of transcription factors in nuclear proteins [7], the procedures for extracting nuclear proteins hindered the application of a high-throughput platform. A reporter gene assay, using transfection of plasmids that contain a mini-promoter with several copies of TF binding elements followed by reporter genes (such as luciferase and GFP), can also be used to determine the activity of TFs in cultured cells. The trans-fectants generated by reporter plasmids can be used to detect the changes in the activity of TFs after treatment with drugs. Therefore, this technique is suitable for use in high-throughput assays for new drug discovery. However, the efficiency of transfection of variant cells is unreliable and ranges from susceptible to resistant. This variable efficiency may lead to false results when the activity of TFs is compared between different cells.
NF-κB is a transcription factor that controls the expression of genes involved in cell proliferation, cycle progression, invasion, angiogenesis, metastasis, apoptosis suppression, multiple drug resistance, and inflammatory response in tumor cells [8]. HIF-1 is another TF that regulates gene expression in response to hypoxia and is involved in angiogenesis/ vascular remodeling, erythropoiesis, glucose transport, gly-colysis, iron transport, and cell proliferation/survival [9,10]. These two TFs were our targets to validate the method we developed to measure the activity of TFs in cells. In this
study, NeutrAvidin-labeled microspheres were used as the solid phase to capture the biotin-labeled double-stranded DNA with TF responded elements on it. The flowchart in Fig. 1adepicts the strategy to probe the binding activity of transcription factors using this modified microsphere-based immunoassay. The biotin-labeled dsDNA probes were first made to react with a nuclear extract of the cells. Later, subsequent to blocking with polyethylene glycol (PEG), NeutroAvidin microspheres were added to the reactions. After incubation, the mixtures were probed with an anti-transcription factor antibody, washed by centrifugation, detected with a fluorescent secondary antibody, and washed again. Finally, the microspheres were analyzed using flow cytometry. In addition to analyzing the nuclear extract, MIA-TF can be also used to analyze the activity of MIA-TFs from total cell lysates of cells cultured in a 96-well culture plate. This may lead to the application of MIA-TF as a high-throughput assay to enable further progress in clinical analysis and drug screening systems.
2 Material and Methods
2.1 Antibodies and Reagents
Rabbit anti-human NF-κB p50 antibody was purchased from Santa Cruz Biotechnology, Inc. (Santa Cruz, CA, USA). Fluorescein isothiocyanate (FITC)-conjugated goat anti-rabbit antibody was purchased from Jackson Immu-noResearch Laboratories, Inc. PA, USA. Goat anti-mouse FITC-labeled antibody was purchased from Chemicon International, Inc. (Temecula, CA, USA). Mouse anti-human HIF-1α monoclonal antibody was purchased from R&D systems, Inc. (Minneapolis, Minnesota, USA). Deferoxamine mesylate salt (DFO) and hydroquinone were purchased from Sigma Corporation (St Louis, MO, USA). FluoSpheres NeutrAvidin™-labeled microspheres were purchased from Invitrogen (Carlsbad, California, USA).
2.2 DNA Probe Preparation
Five types of double-stranded oligonucleotides were used in this study. These were biotin-labeled double-stranded DNA (dsDNA) containing seven times HIF binding site (HBS), biotin-labeled dsDNA containing five times NF-κB binding site (NBS), biotin-labeled HBS (cHBS), non-biotin-labeled NBS (cNBS), and non-non-biotin-labeled dsDNA VP16 without HBS and NBS (VP16). The HBS probe and cHBS probe were prepared by PCR using the pCRII-C2-9 vector which was constructed by our lab and the following primer pairs: 5′-Biotin-GCATCAAGCTTGGTACCG-3′ as the forward primer and 5′-AGCTATCGATATCTGCA GAATTCGG-3′ as the reverse primer for the HBS probe;
5′-GCATCAAGCTTGGTACCG-3′ as the forward primer and 5′-AGCTATCGATATCTGCAGAATTCGG-3′ as the reverse primer for the cHBS probe. The NBS and cNBS probes were prepared by PCR using the pNF-κB-hrGFP vector (Stratagene Corporation, Cedar Creek, TX, USA) and the following primer pairs: 5′-Biotin-TCATGTCTGGATC CAAGCTA-3′ as the forward primer and 5′-CCGGGGATC CATCTA GATTACCCTCTAGAGTCT-3′ as the reverse primer for the NBS probe; 5′-TCATGTCTGGATCCA AGCTA-3′ as the forward primer and 5′-CCGGGGATC CATCTA GATTACCCTCTAGAGTCT-3′ as the reverse primer for the cNBS probe. The VP16 probe was prepared by PCR using the pCMV-ampR-linker-VP16 vector which was constructed by our lab and the primer pair below: 5′-TATCCTGCAGTCCGCGTACAGCCGCGCG-3′ as the forward primer and 5′-TGACCTCGAGCTACCCACCG TACTCGTCAA-3′ as the reverse primer for VP16 probe. The sequences of DNA probes are given below:
HBS probe: Biotin-gcatcaagcttggtaccgagctcggatccactagtaacggccgc cagtgtgctggaattcggcttgtt ggagtgtacgtgtgtgctcccccagg cattggttgttggagtgtacgtgtgtgctcccccaggcatggttgttgg agtg tacgtgtgtgctccccaggcatggttgttggagtgtacgtgtgtgctccc cagg catggttgttggagtg tacgtgtgtgctcccccaggcatggttgttggagtg tacgtgtgtgctccccaggcatggttgttggagtgtacgtgt gtgctcccccagacg tatatacgtatataagccgaattctgcagatatcgatagct (the bold sequences indicate the HIF binding sites).
NBS probe:
B i o t i n - t c a t g t c t g g a t c c a a g c t a g g g g a c t t t c c g c t t g g g gactttccgctggggactttccgctggggactttccg ctggggactttccgcgga gactctagagggtatataatggatccccgg (the bold sequences indicate the NF-κB binding sites).
VP16 probe: Tatcctgcagtccgcgtacagccgcgcgcgtacgaaaaacaattacgggtct accatcgagggcctgctcgatctcccggacgacgacgcccccgaag aggcggggctggcggctccgcgcctgtcctctccccgcgggacacacgcgca gactgtcgacggcccccccgaccgatgtcagcctgggggacgagctccactta gacggcgaggacgtggcgatggcgcatgccgacgcgctagacgatttcgacg gacatgttgggggacggggattccccgggtccgggatttaccccccacgact ccgccccctacggcgctctggatatggccgacttcgagtttgagcagatgtttaccg atgcccttggaattgcggtacggtgggtagctcgaggtca.
Fig. 1 Experimental design of a microsphere-based immunoas-say for measuring the activity of transcription factors (MIA-TF). a Flowchart of MIA-TF. The biotin-labeled dsDNA probes were made to react with TFs in a nuclear extract of the cells. Subsequently, NeutrAvidin microspheres were added into the reactions. After incubation, the mixtures were probed with transcription factor anti-body and detected with a fluorescent secondary antibody by flow cytometry. b Dot plot (SSC vs. FSC) of the MIA-TF method. The DNA-bound TFs were detected by an immunoas-say using a transcription factor-specific antibody and then analyzed using flow cytometry. Microspheres not incubated with nuclear extract were used as negative controls (left) to gate the range of effective signals (R1). The microspheres incubat-ed with the nuclear extracts increased the fluorescence values in the range of effective signals (right). bio-DNA biotin-labeled dsDNA, TF transcription factor
The cHBS and cNBS probes were used for a specific competition test, and VP16 was used for a nonspecific competition test.
2.3 Cell Culture
The human cervical cancer HeLa cell line was purchased from the American Type Culture Collection (Manassas, VA, USA). The HeLa cells were cultured in Dulbecco’s modified Eagle medium (DMEM) supplemented with 10% fetal bovine serum, 100 U/ml of penicillin/strepto-mycin, and 10% (w/v) of sodium hydrocarbonate. The cells were incubated at 37°C in a humidified atmosphere of 5% CO2.
2.4 Drug Treatment
The iron-chelator desferrioxamine (DFO) induces HIF-1α in normoxia. DFO prevents HIF-1α from proteolysis by inhibiting the activity of iron-dependent prolyl hydroxy-lases [11]. To activate HIF-1, HeLa cells were seeded (1× 10⁵ cells per well) in a 24-well plate and cultured in DMEM for 8 h. Cells were treated with 100μM of DFO in triplicate and then incubated for 16 h at 37°C. Hydroqui-none, a reactive metabolite of benzene, is known to inhibit NF-κB activity. The cells were also treated with 25 μM of hydroquinone in triplicate and then incubated for 16 h at 37°C. After the medium was aspirated from the wells, the cells were rinsed with phosphate-buffered saline (PBS) and lysed with lysis buffer (10 mM 4-(2-hydroxyethyl)-1-piperazineethanesulfonic acid (HEPES), 1.5 mM magne-sium chloride (MgCl2), 10 mM potassium chloride (KCl),
1 mM DTT, 10% (v/v) protease inhibitor cocktail, and 0.1% (v/v) Nonidet P-40).
2.5 Nuclear Extract
After incubation with or without the target drugs, the HeLa cells were scraped into DMEM medium, washed in cold PBS, and centrifuged at 500×g for 5 min. Next, HeLa cells at a concentration of 2.5×10⁷cells/ml were lysed in lysis buffer (10 mM HEPES), 1.5 mM MgCl2, 10 mM KCl,
1 mM DTT, 10% (v/v) protease inhibitor cocktail, and 0.1% (v/v) Nonidet P-40) by pipetting up and down. The lysed cells were centrifuged in a microcentrifuge tube at 16,000×g for 5 min at 4°C, and the cytosolic supernatant was removed. The nuclear pellet, consisting of 1×10⁸cells/ ml, was dissolved in extraction buffer (20 mM HEPES, 1.5 mM MgCl2, 0.42 M NaCl, 0.2 mM EDTA, 25% (v/v)
glycerol, 1 mM DTT, and 1% (v/v) protease inhibitor cocktail), incubated for 30 min on ice, and centrifuged at 16,000×g for 5 min [12]. The supernatants containing nuclear proteins were collected and stored at−80°C. The
protein concentrations were determined by the Coomassie Plus (Bradford method) protein assay reagent (Pierce, Oud-Beijerland, the Netherlands) according to the manufacturer’s instructions.
2.6 Development of the MIA-TF System
Exactly 1.5×10⁻¹¹ nmol of FluoSpheres NeutrAvidin™-labeled microspheres were mixed with PEG to a final concentration of 25 mM to block the microspheres in each reaction. After incubation at room temperature for 30 min, the blocked microspheres were diluted to 100 μl with bovine serum albumin (BSA) buffer (1% BSA in PBS) and centrifuged at 9,300×g for 5 min. The supernatant was decanted and discarded; the pellet was then resuspended with 10μl PBS.
Biotin-labeled dsDNA (1.5×10⁻⁸ nmol), prepared as described in the DNA probe preparation section, was added to an appropriate concentration of nuclear extract. The final volume of the reaction was adjusted with extraction buffer to 30 μl and incubated at room temperature for 30 min. The same amount of non-biotin-labeled dsDNA was added at the same step. After 30 min of incubation, the prepared micro-spheres were added to each sample and shaken gently for 15 min at room temperature. The sample was washed with 500μl of washing buffer (0.02% Tween-20 in PBS) and then centrifuged at 9,300×g for 5 min. After carefully discarding the supernatant, 40μl of the primary antibody was added to each tube and incubated at room temperature for 1 h. After centrifugation at 9,300×g for 5 min, the supernatant was discarded. Next, 500μl of washing buffer was added into the sample, and the sample was centrifuged once more to remove the supernatant. Then, 40 μl of the secondary antibody (2.5μg/ml in 1% BSA buffer) was added to each tube and incubated at room temperature for another 1 h. After the washing steps, the sample was resuspended in 500 μl BSA buffer and was ready for flow cytometry (Becton Dickinson, Mountain View, CA, USA). The parameters for the measurement of fluorescence intensity were as follows:
Param Detector Voltage Amp/Gain Mode
P1 FSC E01 7.00 Lin
P2 SSC 545 1.00 Lin
2.7 Whole Cell Extract
HeLa cells were seeded (3,500 cells per well) in a 96-well plate. After incubation for 24 h, cells were scraped in medium, washed in cold PBS, and centrifuged at 500×g for 5 min. The cells were extracted in 50 μl of whole cell extraction buffer (20 mM HEPES, 20% (v/v) glycerol, 1%
(v/v) Nonidet P-40, 1 mM MgCl2, 0.5 mM EGTA, 1 mM
phenylmethylsulfonyl fluoride, 1 mM DTT, and 10% (v/v) protease inhibitor cocktail) by pipetting up and down and incubated on ice for 20 min. After centrifugation at 3,700 rpm (Swing-bucket rotor A-2-DWP, Eppendorf, Hamburg, Germany) for 5 min, the whole cell extract was in the supernatant, the sample was analyzed by modified-MIA-TF after the protein concentrations of the whole cell extracts were determined by the Coomassie Plus (Bradford method) protein assay reagent (Pierce, Oud-Beijerland, the Netherlands) as specified in the instruction manual.
2.8 MIA-TF Directly Detect Transcription Factor in 96-Well Plates
Each well of 96-well microtiter plates was blocked with 300μl of PBS buffer containing 5% BSA (BSA buffer) at room temperature for 1–2 h. Then, the BSA buffer in each well was discarded and the plate was washed three times with PBST buffer (0.05% Tween-20 in PBS buffer). MIA-TF was performed in the prepared 96-well microtiter plate. Briefly, the whole cell lysate was transferred into the wells of the blocked 96-well microtiter plate, and the blocked microspheres were added and mixed gently for 15 min. After centrifugation at 3,500 rpm for 5 min, the superna-tant was carefully discarded and 40 μl of the primary antibody was added into each well and allowed to incubate at room temperature for 1 h. The wash procedure described above was repeated using centrifugation; 40μl of the secondary antibody (2.5μg/ml in 1% BSA buffer) was then added to each well and incubated at room temperature for 1 h. The samples were washed, resuspended in 200μl BSA buffer, and finally their fluorescent activity was determined by flow cytometry.
2.9 Statistical Analysis
Data were analyzed using the SAS statistical software package (SAS Institute, Inc., Cary, NC, USA). The results were expressed as the mean ± SD. Differences in mean values were evaluated by a one-way ANOVA. The level of significance considered was p<0.05.
3 Results
3.1 Strategy for the Microsphere-Based Immunoassay for Measuring the Activities of Transcription Factors
The dot plot (forward scatter vs. side scatter) of micro-spheres without incubation with the nuclear extract was the negative control used to gate the range of effective signals
(R1) and to exclude interference in the buffer (Fig.1b). The results indicated that the nuclear extract caused the of SSC and FSC values of the microspheres to increase (Fig. 1b). The effects may be due to the binding activity of the DNA binding proteins in nuclear extract.
3.2 Determining the Activity of Transcription Factors in Nuclear Extracts by MIA-TF
To test whether the MIA-TF method can be used to detect the activity of transcription factors in the nuclear extracts of cells, the NF-κB probe (NBS: dsDNA fragment with biotin-labeled and containing NF-κB binding ele-ments) was first used to detect the NF-κB activity in the nuclear extracts of cells. The results showed that the fluorescence values of microspheres incubated with nuclear extracts were higher than those of microspheres incubated without nuclear extracts for NBS. The increase in fluores-cence could be abolished by non-biotin-labeled NBS (cNBS), but was not decreased using unrelated competitive dsDNA fragments with the VP16 binding element (Fig.2a). Another probe, the HIF binding element, HBS, was also used to validate the effects of MIA-TF for the activity of HIF in nuclear extracts. The results also indicated that the HBS probe could be used to detect the activity of HIF as a NBS probe (Fig.2b).
3.3 The Sensitivity of MIA-TF
Recombinant human NF-κB proteins (rhNF-κB) were used to determine the sensitivity of the MIA-TF method. The results showed that more than 0.5 ng of rhNF-κB significantly increased the relative fluorescence in a dosage-dependent manner (Fig. 3a). Moreover, the sensi-tivity of the MIA-TF method for NF-κB in the nuclear extracts was also determined, and the results indicate that the MIA-TF method measured the activity of NF-κB in 50 ng of the nuclear extracts. The increases in fluorescence activity were correlated to the amounts of nuclear extracts, which ranged from 50 to 1,000 ng (Fig.3b). In contrast, the HBS probe showed effective sensitivity that ranged from 100 to 1,000 ng for the activity of HIF in the nuclear extracts (Fig.3c).
3.4 Determining the Effects of Drugs on the Activity of Transcription Factors Using the MIA-TF Method
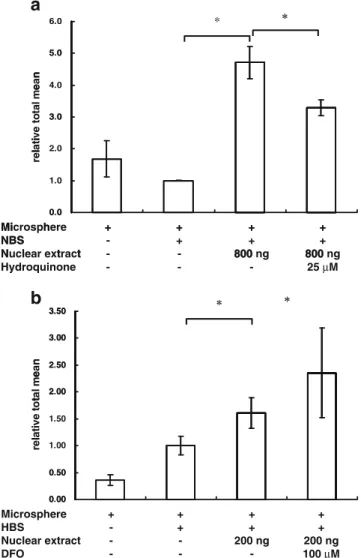
Hydroquinone is an inhibitor that suppresses the activity of NF-κB. To monitor whether the MIA-TF method could detect the effects of drugs on the activity of TFs, cells were treated with hydroquinone (25μM) and the nuclear extracts were assayed. We observed that the suppression of NF-κB activity by hydroquinone was detectable using the MIA-TF
assay system (Fig.4a). DFO, an inducer of HIF, was also used to verify the MIA-TF assay for evaluating the effects of drugs on the activity of TFs. The ability of DFO to enhance the activity of HIF was confirmed using the MIA-TF method (Fig.4b).
3.5 The Activity of Transcription Factors in Cells were Displayed Using the MIA-TF Method in a 96-Well Culture Plate
The results described above revealed that the MIA-TF method could determine the activity of TFs in nuclear extracts. For application in a high-throughput system, we
needed to determine whether the MIA-TF method could be used to analyze the effects of drugs on cells that were cultured in 96-well plates.
8.0 * 7.0 6 0 n 6.0 an 5 0 me 5.0 al m * 4 0 ot a * 4.0 e t o 3.0 iv e 3.0 la ti 2.0 re l * 0 r * 1.0 0.0 Microsphere + + + + + + + Microsphere NBS + + + + + + + + + + + + + NBS rhNF B (ng) - + + 0 1 + 0 5 + 2 5 + 10 + 40 rhNF-κB (ng) - - 0.1 0.5 2.5 10 40 6 0 6.0 * * 5 0 5.0 * an 4.0 me a l m 3 0 ot a * 3.0 to * ve 2.0 at iv * re la r 1.0 0 0 0.0 Microsphere + + + + + + + Microsphere NBS - + + + + + + NBS Nuclear extract - - 50 100 500 1000 2000 Nuclear extract (ng) 50 100 500 1000 2000 (ng)
a
b
c
8 08.0 * 7 0 * 7.0 * 6 0 n 6.0 * ean 5.0 me 5.0 * al m 4.0 ot a 4.0 e t 3.0 ti v e * la t * 2.0 re 1.0 0.0 Microsphere + + + + + + + Microsphere HBS + -+ + + + + + + + + + + + HBS Nuclear extract -+ -+ 50 + 100 + 500 + 1000 + 2000 Nuclear extract (ng) - - 50 100 500 1000 2000 (ng)Fig. 3 Sensitivity of MIA-TF detection. a The MIA-TF method was used to detect different contents of recombinant human NF-κB p50 transcription factors. b The MIA-TF method was used to detect NF-κB activity in different contents of nuclear extract. c The MIA-TF method was used to detect HIF-1 activity in different contents of nuclear extract. The results are expressed as mean ± SD. *p<0.05 and, compared with the control group (column II), n=6. NBS biotin-labeled dsDNA containing five times NF-κB-binding site, HBS biotin-labeled dsDNA containing seven times HIF-binding site
* * 14 12 12 10 a n 10 m e a 8 l m 8 ta l to 6 v e a ti v 4 e la re 2 0 0 Microspherep + + + + + HBS - + + + + Compete DNA - - - cHBS VP16 Compete DNA Nuclear extract - - 500 ng cHBS 500 ng VP16 500 ng Nuclear extract 500 ng 500 ng 500 ng * 6.0 * 5.0 a n 4.0 m e a l m 3 0 o ta 3.0 to v e 2 0 a ti v 2.0 rel a r 1 0 1.0 0.0 0.0 Microsphere + + + + + Microsphere NBS + + + + + + + + + NBS Compete DNA - + + + cNBS + VP16 Compete DNA Nuclear extract - - -500 cNBS 500 VP16 500 Nuclear extract - - 500 ng 500 ng 500 ng
a
b
Fig. 2 The MIA-TF method was used to detect the activity of transcription factors. a The MIA-TF method was used to detect the changes in NF-κB expression in 500 ng of nuclear extract. b The MIA-TF method detected the changes of HIF-1 expression in 500 ng of nuclear extract. Relative total mean = EventsR1× MeanR1/EventsR2× MeanR2. The results are expressed as mean ± SD. *p<0.05, n=6. NBS biotin-labeled dsDNA containing five NF-κB binding site, cNBS non-biotin-labeled NBS, HBS non-biotin-labeled dsDNA containing seven HIF binding sites, cHBS non-biotin-labeled HBS, VP16 non-biotin-labeled dsDNA containing no HBS and NBS
The results showed that the MIA-TF method could also be used to explore the NF-κB activity of cell lysates in a 96-well plate, even with only 3,500 cells per well (Fig.5). In addition, the reduced fluorescence of the group subjected to hydroquinone treatments were also displayed using the MIA-TF method (Fig.5).
4 Discussion
A convenient, sensitive, and specific MIA-TF assay was developed to detect the intracellular activity of TFs. MIA-TF could detect the activity of MIA-TFs from 50 ng of nuclear extracts (Fig. 2a, b). Because this method provided the
fluorescent values in a dosage model, it also determined the precise amount of active TFs in the presence of a TFs standard (Fig.3). Thus, the MIA-TF method may be a good system to determine the degree of tumorigenicity [13] and cellular physiology [14]. Furthermore, this assay could be used to measure the activity of TFs from the cell lysates without extracting nuclear proteins (Fig. 5), an important point when considering its application in the discovery of new drugs using a high-throughput platform [15].
The MIA-TF method has several advantageous charac-teristics, including fast detection, high sensitivity, specific detection, and flexible as well as wide application. Several blocking reagents were tested to circumvent the false positive signals resulting from nonspecific binding of TFs to microspheres; PEG provided the best blocking effect [16]. The 3,500 cells cultured per well in a 96-well plate were directly lysed with cell lysis buffer to obtain about 500 ng whole cellular proteins; the activity of TFs of the latter was directly determined in the well (Fig.5). Although whole nuclear proteins can be detected using ELISA which was created by Jagelska et al. [17], the advantage of the MIA-TF method is that it works without the requirement to purify the nuclear proteins. Furthermore, the MIA-TF method could be conveniently extended to measure any interesting TFs by simply switching the dsDNA probe; it is possible to synthesize short DNA primer pairs with the binding elements of TFs and using specific antibodies.
* 4 00 * * 4.00 3 50 3.50 3 00 3.00 an 2 50 ea 2.50 m tal 2.00 to ve 1.50 at iv re la 1.00 r 0.50 0 00 0.00 Microsphere + + + + Microsphere NBS - + + + NBS Cell lysate -+ -+ 200 ng + 200 ng Cell lysate Hydroquinone -200 ng -200 ng 25 M Hydroquinone - - - 25 μM
Fig. 5 Modified-MIA-TF directly measured the TF activity in 96-well plates. The activity of NF-κB was analyzed using a modified-MIA-TF system. After seeding 3,500 HeLa cells/well in 96-well plates, cells were treated with 25μM hydroquinone for 16 h. The cells were lysed and the activity of transcription factors in cell lysates in 96-well plates was measured. The results are expressed as mean ± SD. *p<0.05, n=6. NBS biotin-labeled dsDNA containing five times NF-κB-binding site * 6.0 * * 5 0 5.0 n 4.0 ean me 3 0 ta l 3.0 to iv e 2.0 la ti re l 1.0 0 0 0.0 Mi h + + + + Microsphere NBS + + + + NBS N l t t - + + 800 + 800 Nuclear extract - - 800 ng 800 ng Hydroquinone - - - 25 μM * * 3.50 * * 3.50 3 00 3.00 2 50 n 2.50 ean 2 00 me 2.00 ta l to t 1.50 ve la ti 1.00 re l 0.50 0 50 0 00 0.00 Microsphere + + + + HBS - + + + Nuclear extract - - 200 ng 200 ng DFO - - - 100 μM
a
b
Fig. 4 MIA-TF detected the activity of transcription factors in cells after drug treatment. a After treatment with 25μM hydroquinone for 16 h, the MIA-TF method was used to detect the changes of NF-κB expression in HeLa cells. b After treatment with 100μM desferriox-amine (DFO) for 16 h, the MIA-TF method was also used to detect the changes of HIF-1 expression in HeLa cells. The results are expressed as mean ± SD. *p<0.05, n=6. NBS biotin-labeled dsDNA containing five times NF-κB-binding sites, HBS biotin-labeled dsDNA containing seven HIF-binding sites
ELISA-based kits were used for the detection and quantification of TF activation. Both nuclear and whole cell extracts could be assayed using such kits. ELISA has limitations, like the need for a large sample volume, a narrow dynamic range, and complicated dilution proce-dures [18, 19]. No matter which kit is used, the optimal detection of TF activity ranges between 0.5 and 100 µg of nuclear extract. Wang et al. [20] showed that the detection range was between 0.625 and 10 µg of nuclear extract. In our study, the sensitivity of TF activity was quantified as about 0.05–2 µg of nuclear extract. de Jager and Rijkers [21] also indicated that the cytokine detection of bead-based multiplex immunoassays (MIA) was more sensitive than ELISA. Therefore, a three-dimensional solid carrier may be better than the plane-solid carrier to decrease the conformational barriers and raise the sensitivity.
Marligen Biosciences (www. marligen.com) has developed a multiplex TF assay that uses TF probes to determine changes in signaling pathways. The design of the multiplex TF assay is similar to our MIA-TF assay. Theoretically, the multiplex TF assay can be used to detect the activation of different TFs in a single sample by distinguishing between the reactions with different fluorescent microspheres or fluorescence-labeling probes, a useful design for multiple detections of TFs. Like the multiplex TFs assay, the MIA-TF method also can be used to determine the activation of different TFs using a single sample as long as it is combined with antibodies labeled with different fluores-cent quantum dots. However, the MIA-TF method has more advantages than the multiplex TF assay. First, the sensitivity of the MIA-TF method was higher: the multiplex TFs assay needs at least 500 ng of nuclear extracts for the detection of TF activity according to the instructions, while the MIA-TF method detected the activity of TFs using 50 ng of nuclear extracts (Fig. 3). Although the multiplex TF assay can be used to perform the reactions in a microtiter plate when combined with the nuclear extraction kit, the MIA-TF assay directly mea-sured the activity of TFs from the whole cell lysates in the 96-well microtiter plates. In addition, the multiplex TF assay method highlighted the differences between the TF-bound probe and the unTF-bound probe by the addition of a “proprietary reagent” provided by the company. Without antibody recognition, this proprietary reagent could interfere with the TFs by nonspecific binding of certain DNA binding proteins. In comparison, analysis using the MIA-TF method provided sensitive and reliable detection of the activity of TFs.
5 Conclusion
Previously, researchers developing microsphere-based assays used captured antibodies bound to an immobile
phase on polystyrene microspheres for multiplexed assays of cytokines, antibodies, hormones, nucleic acids, viruses, and other biomolecules [22,23]. The new MIA-TF method we developed for TF detection shows potential in furthering progress in clinical analysis and drug screening. Overall, the MIA-TF method is a highly promising method for detecting the activity of TFs.
Open Access This article is distributed under the terms of the Creative Commons Attribution Noncommercial License which per-mits any noncommercial use, distribution, and reproduction in any medium, provided the original author(s) and source are credited.
References
1. Latchman DS (1995) Eukaryotic transcription factors. Academic, London
2. Lee SB, Huang K, Palmer R, Truong VB, Herzlinger D, Kolquist KA, Wong J, Paulding C, Yoon SK et al (1999) The Wilms tumor suppressor WT1 encodes a transcriptional activator of amphiregulin. Cell 98:663–673
3. Dunn KL, Espino PS, Drobic B, He S, Davie JR (2005) The Ras-MAPK signal transduction pathway, cancer and chromatin remodeling. Biochemistry and Cell Biology (Biochimie et biologie cellulaire) 83:1–14
4. Pandolfi PP (2001) Transcription therapy for cancer. Oncogene 20:3116–3127
5. Li JL, Chen H, Li M, Hua D, Lu Z, Wang J (2007) An optimized assay for transcription factor NF-kappaB with dsDNA-coupled microplate. Colloids Surface 55:31–37
6. Lewin B (2004) Genes VIII: Pearson Education International. Prentice Hall, London
7. Gubler ML, Abarzua P (1995) Nonradioactive assay for sequence-specific DNA binding proteins. BioTechniques 18 (1008):11–14
8. Escarcega RO, Fuentes-Alexandro S, Garcia-Carrasco M, Gatica A, Zamora A (2007) The transcription factor nuclear factor-kappa B and cancer. Clin Oncol (Royal College of Radiologists (Great Britain)) 19:154–161
9. Semenza G (2002) Signal transduction to hypoxia-inducible factor 1. Biochem Pharmacol 64:993–998
10. Thrash-Bingham CA, Tartof KD (1999) aHIF: a natural antisense transcript overexpressed in human renal cancer and during hypoxia. J Natl Cancer Inst 91:143–151
11. Prass K, Ruscher K, Karsch M, Isaev N, Megow D, Priller J, Scharff A, Dirnagl U, Meisel A (2002) Desferrioxamine induces delayed tolerance against cerebral ischemia in vivo and in vitro. J Cereb Blood Flow Metab 22:520–525
12. Dignam JD, Lebovitz RM, Roeder RG (1983) Accurate transcription initiation by RNA polymerase II in a soluble extract from isolated mammalian nuclei. Nucl Acids Res 11:1475–1489
13. Little CD, Nau MM, Carney DN, Gazdar AF, Minna JD (1983) Amplification and expression of the c-myc oncogene in human lung cancer cell lines. Nature 306:194–196
14. Shen Z, Peedikayil J, Olson GK, Siebert PD, Fang Y (2002) Multiple transcription factor profiling by enzyme-linked immunoassay. BioTechniques 32:1168, 70–72, 74 passim
15. Liu PQ, Tan S, Mendel MC, Murrills RJ, Bhat BM, Schlag B, Samuel R, Matteo JJ, de la Rosa R et al (2005) Isogenic human
cell lines for drug discovery: regulation of target gene expression by engineered zinc-finger protein transcription factors. J Biomol Screen 10:304–313
16. Winblade ND, Schmokel H, Baumann M, Hoffman AS, Hubbell JA (2002) Sterically blocking adhesion of cells to biological surfaces with a surface-active copolymer containing poly(ethyl-ene glycol) and phenylboronic acid. J Biomed Materi Res 59:618–631
17. Jagelska E, Brazda V, Pospisilova S, Vojtesek B, Palecek E (2002) New ELISA technique for analysis of p53 protein/DNA binding properties. J Immunol Methods 267:227–235
18. Jia XC, Raya R, Zhang L, Foord O, Walker WL, Gallo ML (2004) A novel method of multiplexed competitive antibody binning for the characterization of monoclonal antibodies. J Immunol Methods 288:91–98
19. Biagini RE, Sammons DL, Smith JP, MacKenzie BA, Striley CA, Semenova V (2004) Comparison of a multiplexed fluorescent
covalent microsphere immunoassay and an enzyme-linked immu-nosorbent assay for measurement of human immunoglobulin G antibodies to anthrax toxins. Clin Diagn Lab Immunol 11:50–55 20. Wang J, Li ML, Hua D, Chen Q (2006) Exonuclease-mediated
ELISA-like assay for detecting DNA-binding activity of transcrip-tion factors: measurement of activated NF-kappaB. BioTechniques 41(79–88):90
21. de Jager W, Rijkers GT (2006) Solid-phase and bead-based cytokine immunoassay: a comparison. Methods 38:294–303 22. Hulse RE, Kunkler PE, Fedynyshyn JP, Kraig RP (2004)
Optimization of multiplexed bead-based cytokine immuno-assays for rat serum and brain tissue. J Neurosci Method 136:87–98
23. Martins TB, Pasi BM, Litwin CM, Hill HR (2004) Heterophile antibody interference in a multiplexed fluorescent microsphere immunoassay for quantitation of cytokines in human serum. Clin Diagn Lab Immunol 11:325–329