Constitutional foundations of economic freedom: a time-series cross-section analysis
31
0
0
全文
(2) CONSTITUTIONAL FOUNDATIONS OF ECONOMIC FREEDOM: A TIME-SERIES CROSS-SECTION ANALYSIS The tragic illusion was that the adoption of democratic procedures made it possible to dispense with all other limitations on governmental power. It also promoted the belief that the ‘control of government’ by the democratically elected legislation would adequately replace the traditional limitations, while in fact the necessity of forming organized majorities for supporting a programme of particular actions in favour of special groups introduced a new source of arbitrariness and partiality and produced results inconsistent with the moral principles of the majority. F. A. Hayek. Introduction: Some countries implement consistently good economic policy, while some others systematically fail to do so. Over time, some countries improve their governance while others do exactly the opposite (Spiller & Tommasi 2003: 281). In short, when it comes to economic policy, there are great variations over time and across countries. We are reminded of these facts every time a new international survey comes out. These surveys may cover the level of corruption (e.g., from Transparency International), ethnicity and/or culture (Fearon 2003). Others are concerned with the level ‘economic freedom’ (e.g., the Fraser Institute and the Heritage foundation). There are also more business oriented surveys such as the “International Country Risk Guide” (which is a composite index combining measures of corruption, bureaucratic quality, rule of law and the risk of expropriation of propriety published by the Political Risk Services Group). Economists have studied and documented at length the effects of these variables. For instance, the consequences of corruption are well established (Mauro 1995), ethnicity and cultural influences are sometimes important (Alesina, et al. 2003), while the impact of economic freedom on economic growth has been shown to be quite robust and generally efficiency increasing (e.g., de Vanssay & Spindler. 1 企業家精神、創新與經濟發展研討會 A Symposium on Entrepreneurship, Innovation and Economic Development.
(3) 1994; Easton & Walker 1997; de Haan & Sturm 2000, and Scully 2002). Further, Keefer & Knack (1997) have studied the role of institutional variables, such as business risk and country risk, on economic growth and convergence. There have been fewer studies dealing with the root causes of economic freedom. Specifically, why do some countries have consistently higher levels of economic freedom than others? Why does the level of economic freedom increase over time for some countries, while it decreases for others? In other words, do some institutional settings perform better than others do when it comes to delivering economic freedom, which allows for more efficient economic policies to be pursued both publicly and privately? This paper attempts to answer some of these questions and is organized as follows. The first part deals with the concept of economic freedom and link with efficient economic policy. The second part presents the theoretical model developed by Adserà, et al. (2003), which supports and provides the foundations for the empirical work. The third part deals with the data and the empirical results. The fourth part provides our concluding observations. The government is best which governs least. Thomas Jefferson. Economic Policy and Economic Freedom The most basic paradigm in economics is the concept of constrained optimization. For example, consumers choose their behavior to maximize utility subject to their budget constraints and producers choose their behavior to maximize profit subject to production relations between input and output, and to input prices and output prices. Typically, the constraints on optimization can be categorized as natural (i.e., resource constraints set by the physical world), technological (i.e., input-output. 2 企業家精神、創新與經濟發展研討會 A Symposium on Entrepreneurship, Innovation and Economic Development.
(4) processes set by existing knowledge), and institutional (i.e., the “rules of the game” set by social organizations). Resource availability varies due to depletion and discovery, knowledge varies with obsolescence and discovery, and social organizations evolve through adaptation, as best practice rules come to dominate voluntarily, or through political activity aimed at changing and enforcing the “rules of the game” coercively. Generally, given natural, technological, and voluntary social constraints, the greater the number and degree of coercive socially imposed constraints on optimization, the lower the value of the optimized outcome. For example, consumers subjected to rationing typically achieve a lower level of utility, while producers subjected to price controls typically achieve a lower level of profit. The “rules of the game” may evolve in private association or be chosen though governing institutions, which, in turn, may choose optimally (i.e., social choice) or politically (i.e., public choice) subject to natural, technological and other social constraints (that is, choose subject to the “rules” of the “rules making game”). From this simple relation between constraints and utility, profit and/or welfare outcome sprung the notion that freedom from constraints was a superior economic policy. This led Milton Friedman in such publications as Free to Choose (1980, Ch. 2; written jointly with Rose Friedman) to suggest that measuring government-imposed economic constraints would be a worthwhile way to measure the efficiency of economies and, by implication, the efficiency of government economic policy, whether active or passive. The lower the level of such constraints, the higher is the potential welfare, profitability, and hence, the higher is the level of wealth of an economy.. 3 企業家精神、創新與經濟發展研討會 A Symposium on Entrepreneurship, Innovation and Economic Development.
(5) Over approximately a decade from the mid-eighties to the mid-nineties, under Friedman’s influence and the Liberty Fund’s support, The Fraser Institute organized a series of conferences, which ultimately led to the worldwide measurement of Economic Freedom Indices (EFI) (See Gwartney, et. al. 2003). In general, the Fraser Institute EFI are inversely related to government-imposed constraints. The implication is that government economic policies are more efficient when they are less constraining. Currently, there are no alternative direct measurements of economic policy efficiency. As an indirect alternative, Osborne (2004) uses the contribution to economic growth of four policy-outcome components’ (inflation, exchange rate premium on the black market, government expenditure, and trade openness, with relative weights based on regression analysis) to measure ‘economic policy’. Just like Osborne’s indirect measure, EFI is a linear combination of various policy outcome indicators. However, the list of components in the EFI is much more comprehensive than Osborne’s, EFI components typically measure the degree of constraint provided by the “rules of the game” rather that the “outcomes” of the “game” that Osborne’s measure tracts, and the EFIs have been subjected to more empirical and critical analysis. Given the extensive validation and the general availability of time-series, cross-section EFI data, they are arguably the best currently available proxy for the efficiency of government policies. This conclusion is strengthened by over a decade of research and publication of studies showing the positive relationship between EFI and economic performance as conventionally measured in aggregate by Gross Domestic Product (GDP), the growth rate of GDP (g), and various measures of economic distribution (For a recent. 4 企業家精神、創新與經濟發展研討會 A Symposium on Entrepreneurship, Innovation and Economic Development.
(6) survey, see Berggren 2003). This literature is not without its critics (Easterly 2002, de Haan & Sturm 2003, and Hanson 2003), raising questions of causality, identifiability, and indices weighting that are more or less typical of any empirical work. However, given the variety of specifications and weightings tested empirically, results using EFI data are amazingly robust (de Haan & Sturm 2000, Gwartney & Holcombe 1999, Hanke & Walters 1997, Scully 2002, and Cole 2003). This provides some incentive for further exploration with EFI data, until some demonstrably superior alternative is provide by EFI critics. One path already opened by de Haan & Sturm (2003) concerns the genesis of Economic Freedom – specifically, the role played by political institutions in determining the level and evolution of Economic Freedom as measured by EFI. Democratic institutions are apparently important if political freedom contributes to the evolution and enjoyment of economic freedom. However, as noted in the quote above from Hayek, an important aspect of democracy is whether its exercise is constituted in ways that will more often, and uniformly, lead to the public good. This depends, in turn, on whether political institutions provide for “incentive compatibility” between the “will of the people” and the actions of politicians. We will explore that question in the next section where we extend the model of Adserà for different dependent and independent variables for time-series of cross-section data. Sed quis custodiet ipsos custodes?. Principal-Agent Theory and Practice Adserà, et al. (2003: 447-8) develop a theoretical model based on a principal-agent framework. Barro (1973) first applied this framework to politics as the “delegation problem”. Later, this framework was applied to finance by Jensen & Meckling (1976). 5 企業家精神、創新與經濟發展研討會 A Symposium on Entrepreneurship, Innovation and Economic Development.
(7) and is now commonly known as the “principal-agent problem”. As applied to political economy, the “principal” is the representative (or median) citizen and the “agent” is the (dominant) politician. These assumptions can be justified by reference to the public choice literature on median voter modeling (e.g., Mueller 2003: 231-2). In this model, citizens, in their role as the principal, want good economic policies enacted on their behalf. For the usual economic reasons that flow from specialization and exchange, principals delegate such functions to their agents. Agents, in turn, are required to represent faithfully the views of their principals. This is where a problem may arise. The interests of the principal and the agent may diverge. For instance, once in power, a politician may enrich herself or pursue policy objectives that are at odds with those of her principal. The problem is compounded by an asymmetry of information available to principals and agents (concerning the effects of various policies, for instance). In political exchange between principals and agents, an imperfect solution to this principal-agent problem is to establish a credible threat of removing politicians from office through periodically scheduled elections. This solution is imperfect because principals may not find it optimal to be fully informed about agents’ activities, while agents may find it optimal to deceive their principals continually and especially periodically as election dates approach. However, those prospective agents who are competing to take-over incumbent agents’ offices provide an imperfect counter to agents’ rational distortion and principals’ rational ignorance. Thus, with effective competition, the threat may be real enough to push incumbent politicians to behave responsibly.. 6 企業家精神、創新與經濟發展研討會 A Symposium on Entrepreneurship, Innovation and Economic Development.
(8) If the politicians are not under any threat of forced removal, there is less incentive to implement and enforce efficient economic policies. For instance, politicians relying on a particular special interest group support for systematic reelection will cater to that special interest group’s needs – generally, at the expense of the “public interest” (as perhaps measured by the preferences of the “median voter”). Competitive pressures on politicians will tend to be greater in a “composite state”, where horizontal competition exists between branches (i.e., the executive, the legislatures, and the judiciary) and vertical competition exists between levels (i.e., federal, state, and local), than in a “unitary state” with a unified hierarchy, such that competition only occurs for the top position. At the extreme, a military dictator is even less likely to deliver efficient economic policies. This is because in the principal-agent model, the safeguard of regular elections has been removed or, to put it in another way, the cost of removing the agent has become prohibitive. One can even argue that, with a (military) dictatorship, the roles have been reversed: the citizens are now the agents of the dictators (Mueller 2003: 406-7). Here, competition is still possible but it is more costly – generally involving a military takeover, either from within, as with a coup d’état, or from outside, by invasion, as with a coup de Bush (!). These considerations lead us to hypothesize that the presence of free and fair elections, competition among politicians, checks and balances, the absence of military dictatorship, the absence of politicians relying on special interest groups for reelection, and the presence of electoral competition all contribute to the implementation of efficient economic policies. Whereas, Adserà et al. (2003) used. 7 企業家精神、創新與經濟發展研討會 A Symposium on Entrepreneurship, Innovation and Economic Development.
(9) corruption, quality of public service, and rule of law as dependent variables measuring various aspects of “accountable government” or “good governance”, we propose using only the Economic Freedom Indices (EFI) as the dependent variable to proxy “efficient government” or “efficient public policy”. Whereas Adserà et al. (2003) used both economic and political variables as independent variables, we propose using only political variables representing constitutionally determined or regime determined political institutions. This is because Adserà’s independent economic variables, such as “trade openness” and “level of capital controls”, are variables to be explained as a consequence of government policy, and, indeed, are actually components of EFIs. We describe our data and our alternative specifications in the following section. If you torture the data long enough, Nature will confess. Ronald Coase.. Data and Regression Analysis In order to test our hypothesis that democratic institutions tend to foster better economic policy than non-democratic ones, we posit that: EFI = f(PVi),. (1). where EFI is the Economic Freedom Index and PVi are the political variables, both are described below. We are using time-series cross-sectional (panel) data. They cover the years 1975, 1980, 1985, 1990, 1995 and 2000. Due to the complex nature of the data set, we have had to limit the number of countries to 54. Specifically, in order to have a constant sample size across various models, we have dropped countries for which we have 2 (out of 6) observations or less. While we would have preferred to use a. 8 企業家精神、創新與經濟發展研討會 A Symposium on Entrepreneurship, Innovation and Economic Development.
(10) larger number of countries, we are confident that the benefit of the constant sample size outweighs the cost. The list of countries, along with other descriptive statistics, is provided in the Appendix. The data on Economic Freedom Indices (EFI) are from the latest Fraser Institute study at the time of our empirical analysis (Gwartney et al., 2003). We use data for the years 1975, 1980, 1985, 1990, 1995 and 2000. In our sample, they cover from 16 countries for the earliest data up to 54 countries for the latest data. More precisely, the data include 16 countries in 1975, 30 countries in 1980, 50 countries in 1985, 54 countries in 1990 and 1995, and 51 countries in 2000. The data on political institutions (PVi) are selected from the DPI2000 (Database of Political Institutions Version 2.0, (Beck et al., 2001, Keefer & Stasavage, 2003)). These are yearly data from 1975 to 2000. They have been modified so as to facilitate regression analysis. [We have transformed them so that can be used as dummy variables and we also made them readable by our econometric software (STATA 8)]. They are divided into 4 sections below: 1. Variables concerning the Chief Executive: a. Political setting: The “political setting” of the Chief Executive is captured by four dummy variables: assembly-elected President - takes the value of one if there is an assemblyelected president ; takes the value of zero otherwise. parliamentary - takes the value of one if there is a parliamentary system; takes the value of zero otherwise.. 9 企業家精神、創新與經濟發展研討會 A Symposium on Entrepreneurship, Innovation and Economic Development.
(11) military - takes the value of one if the Chief Executive is a military officer (that is, if there is a rank in his title); takes the value of zero otherwise. finittrm - takes the value of one if there is a finite term to the mandate of the Chief Executive; takes the value of zero otherwise. b. Special-interest orientation: The “special interest orientation” of the Chief Executive is captured by one dummy variable: execspec - takes the value of one if the party of the executive represents any special interests (i.e. rural, religious, regional, nationalist), takes the value of zero otherwise. c. Extent of control: Finally, the “extent of control” of the Chief Executive is captured by one dummy variable: allhoused - takes the value of one if the party of the Chief Executive controls the legislature (i.e., both houses when there is more than one house); takes the value of zero otherwise. 2. Party variables in the Legislature: A standard measure of concentration drawn from the industrial organization literature, Herfindahl-Hirschman concentration ratio, is applied to measure the extent of “legislature concentration”. Herfgov – is the Herfindahl Government Index calculated as the sum of the squared seat shares of all parties in the government. It equals NA if there is no parliament, or, if there are any government parties where seats are unknown; in either case, the cell is blank. Note that 0 < herfgov < 1. This index is a measure of power concentration. It increases as the number of. 10 企業家精神、創新與經濟發展研討會 A Symposium on Entrepreneurship, Innovation and Economic Development.
(12) parties in the government decreases and the disparity in size between these parties increases. Herfopp – is the Herfindahl Opposition Index calculated in the same manner as Herfgov. It equals NA if there is no parliament, if there are any opposition parties where seats are unknown, or if there are no parties in the legislature; in either case, the cell is blank, and the Herfindahl is blank. Note that 0 < herfopp < 1. This index is a measure of opposition party concentration. 3. Extent of Federalism:. The extent of federalism (ranging from unitary state, federal government, confederate government), and devolution of power to states and provinces, is characterized by the following three dummy variables. auton - takes the value of one if there are contiguous autonomous regions; takes the value of zero otherwise. locallegis - takes the value of one if the executive is appointed but the legislature is locally elected, takes the value of zero otherwise. localexec&legis - takes the value of one if both the legislative and the executive are elected locally, takes the value of zero otherwise. 4. Control variables: These control variables are introduced to check the robustness of our coefficients and the overall validity of our approach. a. Party orientation: The “party orientation” of the Chief Executive with respect to economic policy is captured by three dummy variables: right - takes the value of one if the affiliation is “right”, takes the value of zero otherwise.. 11 企業家精神、創新與經濟發展研討會 A Symposium on Entrepreneurship, Innovation and Economic Development.
(13) left - takes the value of one if the affiliation is “left”, takes the value of zero otherwise. center : takes the value of one if the affiliation is “center”, takes the value of zero otherwise. b. Religious affiliation: The “religious affiliation” of the Chief Executive is captured by 2 dummy variables: christian - takes the value of one if the affiliation is “Christian” (including Catholic), takes the value of zero otherwise. islamic - takes the value of one if the affiliation is “Islamic””, takes the value of zero otherwise. c. Electoral Rules: prd - takes the value of one if there is proportional representation; takes the value of zero otherwise. 5. State of Development Finally, we also use a dummy variable to separate countries according to their political and economic development level. This is not used in the regression per se, but is used to separate the sample, when necessary, between OECD and NonOECD Countries. oecd - takes the value of one if a country is a member of the OECD; zero otherwise The majority of OECD members joined in the 1960’s. Others, however, joined in the 1990’s. The latest member is the Slovak Republic, which joined in December 2000. (The 30 OECD members are listed in the Appendix). Accordingly, the dummy variable does not take the value of one until the year the country joins the OECD. 12 企業家精神、創新與經濟發展研討會 A Symposium on Entrepreneurship, Innovation and Economic Development.
(14) (and the years after). For instance, oecd for Poland takes the value of 0 prior to 1996, 1 afterwards. The reason for separating (albeit artificially) between OECD and developing countries is that “the level of political freedom hardly changed in the industrial countries, in contrast to developing countries” (de Haan & Sturm 2003, 549). A different dynamic is likely at work in each sample. 6. The regression results: We report the results of various linear regressions using the Beck & Katz (1995) methodology using PCSEs (panel-corrected standard errors). This methodology, also used by Adesrà, et al., yields the same coefficients as would an OLS regression, but with (larger) standard errors of the estimated coefficients (Beck & Katz 1995, 638). According to its authors, it corrects for the overconfidence of the FGLS t-values. Finally Beck & Katz (1995, 637) also note that their methodology is particularly appropriate when the panel data set is ‘cross-section dominant’ (when there are more countries than time-periods), which is the case here (Podestà 2002, 16). We have regressed Economic Freedom Indices (EFI) against the various institutional variables detailed above. First, we start with the variables concerning the Chief Executive. Table 1 below, which summarizes the results for all countries (OECD and non-OECD). The first regression (Model A) focuses on the characteristics of the Executive. Model B adds the composition of the legislature. Finally Model C adds the level of political decentralization as independent variables. The regression results give broad support to “principal-agent model of government” Table 1: All countries (OECD and non-OECD). Dependent variable: Economic Freedom Index. 13 企業家精神、創新與經濟發展研討會 A Symposium on Entrepreneurship, Innovation and Economic Development.
(15) Model B. A Independent Variables: constant assembly-elected President parliamentary system military finittrm execspec allhoused herfopp herfgov auton locallegis local exec&legis N Number of countries r2. C. 5.945*** 0.025 0.605** -0.415 0.134 -0.211 -0.423***. 5.956*** 0.011 0.599** -0.393 0.16 -0.216 -0.408*** 0.146 -0.157. 6.001*** 0.115 0.634** -0.348 0.229 -0.221 -0.252*** 0.015 -0.409 -0.176*** -0.226* 0.440***. 254 54 0.152. 254 54 0.154. 254 54 0.208. legend: * p<0.05; ** p<0.01; *** p<0.001. These results give broad support to “principal-agent model of government”. We can see, from Table 1, that the benchmark for our model (where the coefficients for our all dummy variables takes the value of 0) is a country which does not have an assembly-elected president, nor a parliamentary system. It also a country where the Chief Executive does not have a military title attached to his/her name, where he/she does not have a finite term to his/her mandate and does not represent any special interest group and does not control both houses of the Legislature. Pakistan, in our sample, is such a country. It should be noted that the choice of our benchmark does not influence our fundamental results. While this may seem cumbersome, this functional form has the advantage of showing what can be gained in terms of predicted level of economic freedom when one institutional characteristic changes. For instance, still from Table 1, the passage from a dictatorship (or a presidential system) to a parliamentary system increases the predicted level of economic. 14 企業家精神、創新與經濟發展研討會 A Symposium on Entrepreneurship, Innovation and Economic Development.
(16) freedom by .6. To put that value in context, the mean value of economic freedom (out of 254 observations) is 6.2 and the standard deviation is 1.13. In a parliamentary system, the Chief Executive has an incentive to adopt good economic policy in order to ensure her reelection. On the other hand, when a military officer becomes the Chief Executive (military = 1), the impact on economic freedom is negative (but not statistically significant). This is because the military government is under no immediate threat of being replaced following an election. A popular vote can be delayed, cancelled, annulled or rescheduled at a time chosen by the military. The incentive to adopt good economic policies in the general interest has been replaced by the incentive to adopt economic policies destined to ensure the continuing support for the Chief Executive within the military and by elite groups served by the military. When the party of the executive represents a special interest (execspec =1), the predicted impact on economic freedom is also negative (although still not significant). This is consistent with the principal agent model of government. When the Chief Executive is beholden to special interests (i.e. rural, religious, regional, and nationalist), he has an incentive to adopt economic policies destined to placate them. These economic policies may be counter to the general interest. We should expect that the stronger the link between a special interest and the Chief Executive, the stronger the quid pro quo between them and the greater the continued political support for economic policies serving special interests. The coefficient for allhoused is negative and significant. This means that, ceteris paribus, when the party of the Chief Executive controls both houses, this has a negative impact on economic freedom. The predicted level of economic freedom. 15 企業家精神、創新與經濟發展研討會 A Symposium on Entrepreneurship, Innovation and Economic Development.
(17) goes down by .4, which is a third of the overall standard deviation for economic freedom (see Table A1, in Appendix). Again, this is consistent with the principal agent model of government. Given the traditional division of powers, when the Executive and (both branches of) the Legislative are on the same side, there are three reasons why the Chief Executive will be under less pressure to promote efficient economic policies: First, it less likely that the Executive will be defeated by the Legislature through a non-confidence vote and be forced to obtain a new mandate from the electorate; Second, it also less likely that the Executive will dissolve the Legislature –and force it to obtain a new mandate from the electorate; Third, by controlling both houses, the Executive has rendered the Senate basically ineffective as the ‘Chamber of Sober Second Thought’. An additional explanation for the negative sign is given by the “First do no harm” principle. It is possible that, when the Executive and the Legislative powers are on opposite sides, both are vulnerable politically and therefore more careful when it comes to legislation. So, less harm is done to the economy because less one-sided legislation is adopted. From Model B, for the results concerning the party variables in the Legislature, the coefficients are not statistically significant, but indicate nevertheless that a higher Herfgov (the Herfindahl Government Index) leads to a lower level of economic freedom (ceteris paribus). This is consistent with our principal-agent hypothesis. A high Herfindahl Government Index means that the government legislative coalition comprises few political parties. Assuming that a small political coalition is less likely to fall or being overthrown than a broader one, a high Herfindahl Government Index means less frequent elections or less frequent change in government following an. 16 企業家精神、創新與經濟發展研討會 A Symposium on Entrepreneurship, Innovation and Economic Development.
(18) election. This is important because the smaller the threat of being replaced, the less likely a government will adopt good economic policies. In Model C, we look at the role of the federalism/decentralization variables. Our results indicate that when the executive and the legislative are locally elected, there is a positive impact on economic freedom. Specifically, the predicted level of economic freedom goes up by .44. This is consistent with the principal-agent hypothesis. Indeed, locally elected governments are a form of choice for the electorate. Voters can vote with their feet and choose to relocate where the government is more responsible. On the other hand, the role of contiguous autonomous regions is not very significant. This is due, in part, to the fact that less than 5 % of the countries surveyed are concerned with this issue. It also occurs when there is a more direct connection between both the executive and legislature and the people, as when both are elected (localexec&legis has a significant positive coefficient) rather than when the executive is appointed, while only the legislature is elected (locallegis has a significant negative coefficient). As can be observed, the signs and significances of our coefficients remain constant as we go from Model A to C. However, to further test the robustness of our hypothesis, we introduce some control variables. They are not part, per se, of our principal-agent model. They are nevertheless relevant to explain the cross-country differences in levels of economic freedom. These control variables deal with the “party orientation” of the Chief Executive with respect to economic policy, its “religious affiliation” and finally the type of electoral system.. 17 企業家精神、創新與經濟發展研討會 A Symposium on Entrepreneurship, Innovation and Economic Development.
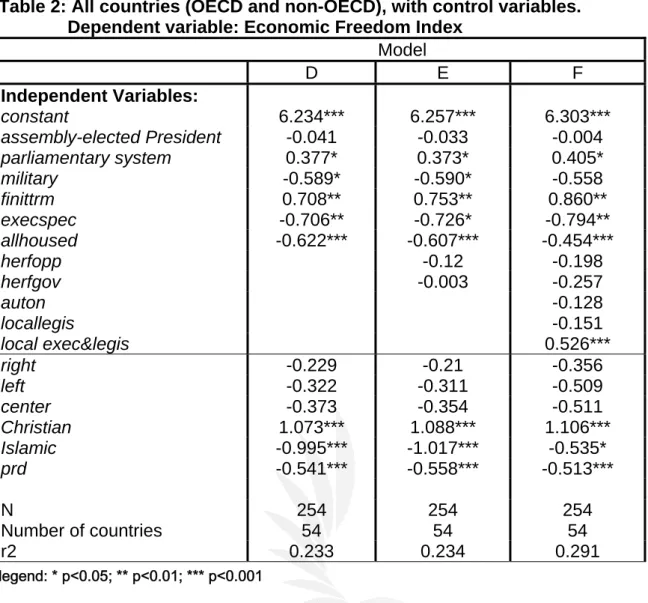
(19) Table 2: All countries (OECD and non-OECD), with control variables. Dependent variable: Economic Freedom Index Model D E F Independent Variables: 6.234*** 6.257*** 6.303*** constant -0.041 -0.033 -0.004 assembly-elected President 0.377* 0.373* 0.405* parliamentary system -0.589* -0.590* -0.558 military 0.708** 0.753** 0.860** finittrm -0.706** -0.726* -0.794** execspec -0.622*** -0.607*** -0.454*** allhoused -0.12 -0.198 herfopp -0.003 -0.257 herfgov -0.128 auton -0.151 locallegis 0.526*** local exec&legis -0.229 -0.21 -0.356 right -0.322 -0.311 -0.509 left -0.373 -0.354 -0.511 center 1.073*** 1.088*** 1.106*** Christian -0.995*** -1.017*** -0.535* Islamic -0.541*** -0.558*** -0.513*** prd N Number of countries r2. 254 54 0.233. 254 54 0.234. 254 54 0.291. legend: * p<0.05; ** p<0.01; *** p<0.001. These regression results are presented in Table 2. Because the number of observations and the dependent variable remain the same in both tables, comparisons can be made as we move from the models without the control variables (Models A, B and C) to the models with control variables (Models D, E and F in Table 2). Comparing Model C (from Table1) with Model F (from Table 2), we see that the signs of the coefficients remain unchanged, that certain coefficients are now statistically significant. For instance, in Model F, the introduction of a finite term to the mandate of the Chief Executive leads to a predicted increase of the level of. 18 企業家精神、創新與經濟發展研討會 A Symposium on Entrepreneurship, Innovation and Economic Development.
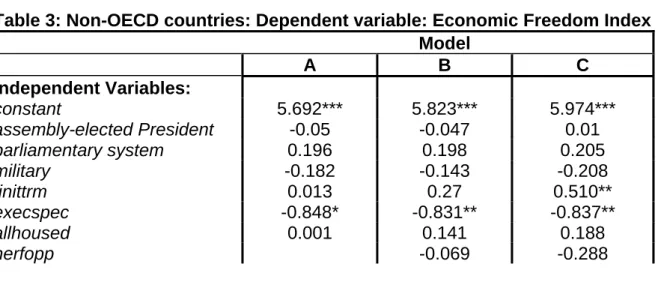
(20) economic freedom of .86. Similarly, the coefficient of execspec. remains. negative, but becomes statistically significant. The control variables, in addition to helping us assert the robustness of our model, also provide some relevant information on their own. For instance the political orientation of the Chief Executive (right, left, or center) is not statistically significant. One might argue that the special interest variable already captures some of that impact on economic freedom. The “religious affiliation” of the Chief Executive is also of interest. From the models D, E or F, we see that if the Chief Executive has a “Christian” religious affiliation (as opposed to no affiliation), the predicted level of economic freedom rises by 1, while if the Chief Executive has a “Muslim” religious affiliation, the predicted level of economic freedom decreases by a value between .5 and 1. Finally, the role of proportional representation is also significant and negative. Clearly the addition of the religious affiliation and the proportional representation dummies complements our model. Turning our attention to a sub-sample of 33 non-OECD countries, we run the same regressions. The results, first without our control variables, are reported in Table 3. Table 3: Non-OECD countries: Dependent variable: Economic Freedom Index Model A B C Independent Variables: 5.692*** 5.823*** 5.974*** constant -0.05 -0.047 0.01 assembly-elected President 0.196 0.198 0.205 parliamentary system -0.182 -0.143 -0.208 military 0.013 0.27 0.510** finittrm -0.848* -0.831** -0.837** execspec 0.001 0.141 0.188 allhoused -0.069 -0.288 herfopp. 19 企業家精神、創新與經濟發展研討會 A Symposium on Entrepreneurship, Innovation and Economic Development.
(21) herfgov auton locallegis local exec&legis N Number of countries r2. 144 33 0.068. -0.518*. -0.612* 0.364* -0.456*** -0.432***. 144 33 0.081. 144 33 0.12. legend: * p<0.05; ** p<0.01; *** p<0.001. What is noteworthy in Table 3 is that, among the variables concerning the Chief Executive, only two variables are statistically significant. The first one, execspec, denoting that the party Executive is beholden to special interests, is statistically significant in Models A, B and C. Its value (-.84) indicates that the presence of special interests plays a significant negative role for Economic Freedom in non-OECD countries. The second variable concerning the Chief Executive playing a role in our regressions is finittrm. It denotes a limited term for the Executive and is significant (and positive) in Model C. This shows the importance of a mandatory and regular periodic review of the Chief Executive by the voters. This characteristic likely distinguishes between non-OECD democracies that are relatively more or less stable as well as those where there are more or less advanced democratic ethics with respect to fair play. At the legislative level, the coefficient for Herfgov is statistically significant and negative. This is consistent with our P-A hypothesis. A high value of the Herfgov index indicates that the party of the Executive has a stable coalition (maybe even with only one -dominant –party) which is unlikely to fall or unlikely to be replaced following some election. Not being threatened by political change, a government has less incentive to deliver good economic policies. Finally, the federalism variables give us some conflicting results. The existence of contiguous autonomous regions (auton) has a positive (and significant) impact on economic. 20 企業家精神、創新與經濟發展研討會 A Symposium on Entrepreneurship, Innovation and Economic Development.
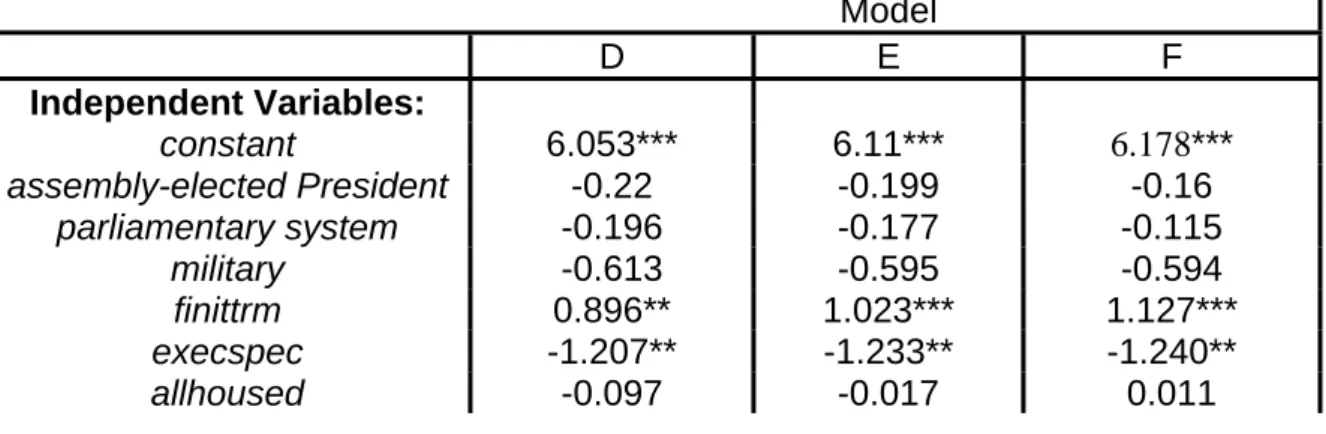
(22) freedom, while a locally elected legislature (locallegis) or executive and legislature (local exec&legis) has a negative impact. However, these results are not robust. Indeed, when we introduce the control variables (see Table 4, below), the significance disappears. Finally, it should be noted that the r-squared values in Table 3 are significantly lower than the ones in Table 1. This is due to the nature of our samples. In the large sample (Table 1), we combine democratic and undemocratic countries. This leads to important variations in the independent variables. In the non-OCDE sample (Table 3), countries are more similar. For instance, they have in common the fact that, given their political and economic institutions, they cannot join the OECD. In Table 4, we introduce our control variables. Comparing Tables 3 and 4, we note that execspec is statistically significant (and negative) in both tables. It has gone up in value (from around -.84 to –1.2), however. The coefficient for finittrm, remains positive, but has now become statistically significant. As mentioned above, the coefficients for our federalsim variables, which were statistically signifcant in Table 3, are not significant when we introduce the control variables. We conclude that, when we use a smaller sample of non-OECD countries, our results are not as robust as the one we reach when we use a larger sample. Table 4: Non-OECD countries, with control variables: Dependent variable: Economic Freedom Index Model D E F Independent Variables: 6.178*** 6.053*** 6.11*** constant -0.22 -0.199 -0.16 assembly-elected President -0.196 -0.177 -0.115 parliamentary system -0.613 -0.595 -0.594 military 0.896** 1.023*** 1.127*** finittrm -1.207** -1.233** -1.240** execspec -0.097 -0.017 0.011 allhoused. 21 企業家精神、創新與經濟發展研討會 A Symposium on Entrepreneurship, Innovation and Economic Development.
(23) herfopp herfgov auton locallegis local exec&legis right left center prd. -0.235 -0.156. -0.39 -0.911** -0.857* -0.621***. -0.331 -0.891* -0.786* -0.624***. -0.35 -0.217 0.202 -0.31 -0.136 -0.348 -0.849* -0.822 -0.593***. N Number of countries r2. 144 33 0.244. 144 33 0.249. 144 33 0.263. legend: * p<0.05; ** p<0.01; *** p<0.001. The control variables are interesting in their own right. The coefficient for prd (proportional representation) is negative and statistically significant (for all three models D, E and F). That result is identical to the one we obtained in Table 2 (for all countries). We do not use the variables Christian or Muslim in Table 4. Indeed, only one country (Malta) has a Christian denomination attached to the party of the Executive. For the Muslim variable, we have ran the regression with and without it. The coefficient for Muslim is not statistically significant for all three models D, E and F.. Finally, we also ran the models for the OECD countries. We don’t report the results here, but they are available upon request. These countries have broadly similar institutional characteristics that do not vary greatly over time. As a result, these characteristics do not offer much explanation for differences in the dependent variable within this sample (as opposed to between this and a larger sample). Despite the claims of political-economic models, there is no single cohesive unit called the “Government” devoted to maximizing the incumbency of the executive. Legislatures, legislative committees, bureaucracies, agencies, central banks, and all the others involved in shaping economic outcomes, all have quite different constituencies from the executive, and those constituencies may not be at all sympathetic to the economic program of the executive.. 22 企業家精神、創新與經濟發展研討會 A Symposium on Entrepreneurship, Innovation and Economic Development.
(24) E.R.Tufte (1978: 139). Political Control of the Economy.. Concluding Observations In the spirit of Tufte’s quote above, we will not claim to have shown the exact key to government control. Rather, our empirical results add further support to some common constitutional and electoral features (such as democratic selection, limited terms, and other checks and balances) long hypothesized as important in determining good governance. Our empirical results also suggest that the principalagent model of government may be a useful paradigm for empirical political analysis, as previously hypothesized and measured by Adserà, et al. (2003) and by others who have used this model -- albeit with somewhat different theoretical and empirical interpretations. Our model was initially inspired by Adserà’s approach. We broadly reach the same conclusions on the importance of political accountability. However comparing the two papers is not an easy task. We have used different dependent and independent variables. For the dependent variable, we have used the Economic Freedom Index (EFI) as a proxy of “good economic policy”, while Adserà, et al. (2003) used variables such as “corruption” or “the rule of law”. The main differences, however, concern the independent variables. We have chosen to strictly limit ourselves to testing the principal-agent model of political accountability. Accordingly, we have only used political and institutional variables for our independent variables. We believe that our approach is valuable as an extension of the democracy and economic policy literature and that it nicely complements the work of Adserà, et al. (2003). However, unlike Adserà (who finds “Constitutional arrangements are irrelevant, except for federalism, which reduces corruption.” Adserà 2003, 480), and in line with previous empirical studies showing the. 23 企業家精神、創新與經濟發展研討會 A Symposium on Entrepreneurship, Innovation and Economic Development.
(25) importance of constitutional arrangements (e.g., de Vanssay & Spindler 1994; and Spindler & de Vanssay 2002), our current results show the relative importance of various constitutional arrangements in explaining differences in economic freedom indexes and, hence, the differences in the efficiency of economic policies. Our results also corroborate the ones presented by De Haan and Sturm (2003) who found that “in our sample of developing countries increases in economic freedom between 1975 and 1990 are to some extent caused by the level of political freedom” (p. 561). We have chosen to emphasize the various constitutional components of democracy and their respective effect on economic freedom. We believe this approach complements the work of de Haan and Sturm (2003) who have used indices of civil liberties and political rights. Further, the results in our paper can be read as showing that political accountability and democratic competition tend to constrain politicians to promoting good economic policies. From other literature, we know that good economic policies translate into economic growth (Berggren, 2003). We also know that “the propensity for democracy rises with per capita GDP” (Barro, 1999, p. 158). So our paper can be viewed as a contribution to the empirical study of this “virtuous circle of democracy”. Finally, our paper speaks to some current controversies, such as: 1) The concern in some Canadian provinces about whether their first-pastthe-post electoral systems should be replaced by some proportional system (See Hall (2004) about British Columbia and Milner (2004) about Quebec). Our results suggest this will not improve government policy); and 2) Whether political orientation matters to good governance (The “right” has a slight non-significant edge over “center” and “left” oriented politicians in providing. 24 企業家精神、創新與經濟發展研討會 A Symposium on Entrepreneurship, Innovation and Economic Development.
(26) good governance as conceived here, but a non-special-interest orientation is both more significant and more important in that regard). Apparently, it is better to find politicians who are answerable to everyone and who are “bought” by no one! Hopefully, as further, more refined and diverse data measuring institutional characteristics and economic policies becomes available, future tests of the principal-agent paradigm might become ever more conclusive and ever less ambiguous. In the meanwhile, our empirical results lead us to feel confident in reaching a general qualitative conclusion that competitive democratic mechanisms are very important in promoting efficient economic policies.. 25 企業家精神、創新與經濟發展研討會 A Symposium on Entrepreneurship, Innovation and Economic Development.
(27) REFERENCES: Adserà, A., C. Boix, & M. Payne (2003). “Are You Being Served? Political Accountability and Quality of Government.” The Journal of Law, Economics & Organization 19 (2): 445-490. Alesina, A., A. Devleeschauwer, W. Easterly, S. Kurlat, & R. Wacziarg (2003) “Fractionalization.” Journal of Economic Growth 8: 155-194. Barro, R.J. (1973) “The Control of Politicians: An Economic Model.” Public Choice 14: 19-42. Barro, R.J. (1999) “Determinants of Democracy.” Journal of Political Economy 107: S158-S183. Beck, N. & J. N. Katz (1995). “What to do (and not to do) With Time-Series CrossSection Data.” American Political Science Review 89: 634-47. Beck T., G. Clarke, A.Groff, P. Keefer, & P. Walsh (2001). “New Tools in Comparative Political Economy: The Database of Political Institutions.” World Bank Economic Review 15:165-176. Berggren, N. (2003). “The Benefits of Economic Freedom: A Survey.” The Independent Review 8: 193 - 211. Cole, J. H. (2003). “The Contribution of Economic Freedom to World Economic Growth, 1980-99.” Cato Journal 23: 189-198. de Haan, J. & J.-E. Sturm (2000). “On the Relationship Between Economic Freedom and Economic Growth.” European Journal of Political Economy 16: 215-241. de Haan, J. & J.-E. Sturm (2003). “Does More Democracy Lead to Greater Economic Freedom? New Evidence for Developing Countries.” European Journal of Political Economy 19: 547-63. de Vanssay, X. & Z.A. Spindler (1994). Freedom and Growth: Do Constitutions Matter?” Public Choice 78: 359-372. Easton, S. T., & M. A. Walker (1997). “Income, Growth, and Economic Freedom.” American Economic Review 87: 328-32. Easterly, W. (2002). The Elusive Quest for Growth. Cambridge: MIT Press. Fearon, J.D. (2003) “Ethnic and Cultural Diversity by Country.” Journal of Economic Growth 8:195-222. Friedman, M. & Friedman. R. (1980) Free to Choose: A Personal Statement.. New York: Harcourt Brace Jovanovich. Gwartney, J., R. Lawson & R. Holcombe (1999). “Economic Freedom and the Environment for Economic Growth.” Journal of Institutional and Theoretical Economics 155 (4): 1-21. Gwartney, J. & R. Lawson with N. Emerick. (2003). Economic Freedom of the World: 2003 Annual Report. Vancouver: The Fraser Institute, 2003. Data retrieved from www.freetheworld.com. 26 企業家精神、創新與經濟發展研討會 A Symposium on Entrepreneurship, Innovation and Economic Development.
(28) Hall, N (2004) “Assembly votes for preferential ballot.” Vancouver Sun (Monday, October 25). Hanke, S. H., & S.J.K. Walters (1997). “Economic Freedom, Prosperity, and Equality: A Survey.” Cato Journal 17: 117-46. Hanson II, J. R. (2003). “Proxies in the New Political Economy: Caveat Emptor.” Economic Inquiry 41: 639-46. Jensen, M.C., & W.H. Meckling (1976). Theory of the Frm: Managerial Behavior, Agency Costs and Ownership Structure.” Journal of Financial Economics 3: 303-360. Keefer, P. & S. Knack (1997). “Why Don't Poor Countries Catch Up? A CrossNational Test of an Institutional Explanation.” Economic Inquiry 35: 590-602. Keefer P. & D. Stasavage (2003). The Limits of Delegation: Veto Players, Central Bank Independence and the Credibility of Monetary Policy.” American Political Science Review 97: 407-423. Mauro, P. (1995). “Corruption and Growth.” Quarterly Journal of Economics 110: 681-712. Milner, H. (2004) “Making Every vote count.” National Post (Tuesday, October 19). Mueller, D.C. (2003). Public Choice III. Cambridge: Cambridge University Press. Osborne, E. (2004). “Measuring Bad Governance.” Cato Journal 23: 403-422. Podestà, F. (2002). “Recent Developments in Quantitative Methodology: The Case of Pooled Time-Series Cross-Section Analysis.” DSS Papers 3-02. Scully, G. W. (2002). “Economic Freedom, Government Policy and the Trade-off Between Equity and Economic Growth.” Public Choice 113: 77-96. Spiller, P. & M. Tommasi (2003). “The Institutional Foundations of Public Policy: A Transactions Approach With Application to Argentina.” The Journal of Law, Economics & Organization 19: 281-306. Spindler, Z.A. & X. de Vanssay (2002). “Constitutions and Economic Freedom: An International Comparison.” South African Journal of Economics 70 (6): 11351147.. 27 企業家精神、創新與經濟發展研討會 A Symposium on Entrepreneurship, Innovation and Economic Development.
(29) Appendix: Here we provide the summary statistics such as year, number of observations, mean, standard deviation and range for the EFI dependent variable (Table A1), for all the utilized independent variables (Table A2) and the correlation matrix (Table A3) Table A1: Economic Freedom Index: Summary Statistics Year Obs Mean Std. Dev. Min Max 1975 16 5.486116 0.865528 4.072379 6.60362 1980 30 5.667937 0.944589 3.521154 7.363937 1985 50 5.629929 1.086662 3.295299 7.831059 1990 54 6.118627 1.168625 3.434581 8.464975 1995 53 6.708212 0.988823 4.183395 8.775125 2000 51 6.885146 0.812847 4.957734 8.534452 Total. 254. 6.206283. 1.12834. 3.295299. 8.775125. Table A2: EFI independent variables: Summary Statistics (1975-2000) Variable Assembly-elected President parliamentary military finittrm execspec allhoused herfgov herfopp auton locallegis localexec&legis right left center christian islamic prd. Obs 254. Mean 0.07874. Std. Dev. 0.269865. Min 0. Max 1. 254 254 254 254 254 254 254 254 254 254 254 254 254 254 254 254. 0.614173 0.082677 0.972441 0.133858 0.425197 0.782721 0.572228 0.066929 0.322835 0.334646 0.429134 0.334646 0.094488 0.090551 0.007874 0.712598. 0.487751 0.275937 0.164029 0.341172 0.495349 0.271171 0.272325 0.250393 0.468483 0.472798 0.49593 0.472798 0.293084 0.287536 0.08856 0.453444. 0 0 0 0 0 0.181002 0.010864 0 0 0 0 0 0 0 0 0. 1 1 1 1 1 1 1 1 1 1 1 1 1 1 1 1. Sample Countries: The data include 16 countries in 1975, 30 countries in 1980, 50 countries in 1985, 54 countries in 1990 and 1995, and 51 in 2000. In total, we have 254 observations. The countries are: Argentina, Australia, Austria, Bahamas, Barbados, Belgium, Belize, Bolivia, Botswana, Brazil, Canada, Chile, Costa Rica, Denmark, Dominican Rep., Egypt, El Salvador, Finland, France, Germany, Guatemala, Honduras, Iceland, India, Indonesia, Ireland, Israel, Italy, Japan, Luxembourg, Malaysia, Malta, Mexico, Morocco, Netherlands, New Zealand, Norway, Pakistan, Panama, Portugal, Senegal, Singapore, South Africa, South Korea, Spain, Sri Lanka, Sweden, Syria, Thailand, United Kingdom, United States, Uruguay, Venezuela and Zimbabwe). OECD Members: Of the current 30 OECD members, 21 are part of our sample. They are Australia (joined in June 1971), Austria (September 1961), Belgium (September 1961), Canada (April 1961), Denmark (May 1961), Finland (January 1969), France (August 1961), Germany (September 1961), Iceland (June 1961), Ireland (August 1961), Italy (March 1962), Japan (April 1964), Luxembourg (December 1961), the Netherlands. 28 企業家精神、創新與經濟發展研討會 A Symposium on Entrepreneurship, Innovation and Economic Development.
(30) (November 1961), New Zealand (May 1973), Norway (July 1961), Portugal (August 1961), Spain (August 1961), Sweden (September 1961), the United Kingdom (May 1961), the United States (April 1961).. 29 企業家精神、創新與經濟發展研討會 A Symposium on Entrepreneurship, Innovation and Economic Development.
(31) Table A3: Correlation matrix systemd2 systemd3 military finittrm execspec allhou~d herfopp herfgov auton stated2 -------------+-----------------------------------------------------------------------------------------systemd2 | 1.0000 systemd3 | -0.3689 1.0000 military | 0.6023 -0.3200 1.0000 finittrm | 0.0492 0.1136 -0.1241 1.0000 execspec | -0.1149 0.1691 0.0079 0.0662 1.0000 allhoused | 0.1625 -0.2181 0.1756 -0.0984 -0.1978 1.0000 herfopp | 0.0810 -0.0485 0.0148 0.1806 -0.1822 0.2696 1.0000 herfgov | 0.1345 -0.1610 0.1444 0.2177 -0.2420 0.4503 0.2988 1.0000 auton | 0.0387 0.0181 -0.0804 0.0451 -0.0128 -0.0073 -0.0257 0.0388 1.0000 stated2 | 0.0482 0.1148 -0.0238 0.0648 0.0500 0.0023 -0.2320 -0.1796 0.0846 1.0000 stated3 | -0.1144 0.0651 -0.1523 0.1194 -0.0093 -0.1880 0.0267 0.1020 0.1105 -0.4897 execrlcd2 | -0.0467 0.0663 -0.0581 0.0974 0.0796 -0.1343 0.1360 -0.0868 0.0224 -0.0032 execrlcd3 | -0.1454 0.0651 -0.2129 0.1194 -0.2053 -0.0699 -0.0974 0.0945 -0.0564 0.0457 execrlcd4 | -0.0944 0.0348 -0.0970 0.0544 0.1497 -0.0056 0.0309 -0.0045 0.0751 -0.1367 execrelg2 | -0.0922 0.2501 -0.0947 0.0531 0.6012 -0.1881 -0.0356 -0.2553 0.0253 0.0169 execrelg4 | -0.0260 0.0706 -0.0267 0.0150 0.2266 -0.0766 -0.1090 0.0426 -0.0239 0.1290 prd | 0.0565 -0.1459 -0.1252 0.2651 0.0453 -0.3513 -0.1503 -0.1604 0.1701 0.0664 | stated3 execrl~2 execrl~3 execrl~4 execr~g2 execr~g4 prd -------------+--------------------------------------------------------------stated3 | 1.0000 execrlcd2 | 0.0425 1.0000 execrlcd3 | 0.1513 -0.6149 1.0000 execrlcd4 | -0.0009 -0.2801 -0.2291 1.0000 execrelg2 | 0.0088 0.1976 -0.2238 0.1795 1.0000 execrelg4 | -0.0632 -0.0772 0.1256 -0.0288 -0.0281 1.0000 prd | 0.1185 0.0585 0.1554 0.0862 0.2004 -0.1403 1.0000. 企業家精神、創新與經濟發展研討會 A Symposium on Entrepreneurship, Innovation and Economic Development.
(32)
數據
相關文件
You are given the wavelength and total energy of a light pulse and asked to find the number of photons it
Reading Task 6: Genre Structure and Language Features. • Now let’s look at how language features (e.g. sentence patterns) are connected to the structure
volume suppressed mass: (TeV) 2 /M P ∼ 10 −4 eV → mm range can be experimentally tested for any number of extra dimensions - Light U(1) gauge bosons: no derivative couplings. =>
We explicitly saw the dimensional reason for the occurrence of the magnetic catalysis on the basis of the scaling argument. However, the precise form of gap depends
incapable to extract any quantities from QCD, nor to tackle the most interesting physics, namely, the spontaneously chiral symmetry breaking and the color confinement..
• Formation of massive primordial stars as origin of objects in the early universe. • Supernova explosions might be visible to the most
2-1 註冊為會員後您便有了個別的”my iF”帳戶。完成註冊後請點選左方 Register entry (直接登入 my iF 則直接進入下方畫面),即可選擇目前開放可供參賽的獎項,找到iF STUDENT
coordinates consisting of the tilt and rotation angles with respect to a given crystallographic orientation A pole figure is measured at a fixed scattering angle (constant d
