變 量 流 橋 墩 沖 刷 模 式 之 試 驗 驗 證 與 應 用
Experimental Verification and Application of Simulation Model for Bridge
Scour under Unsteady Flow
計畫編號:NSC 89-2211-E-002-048 NSC 89-2211-E-002-139 執行期限:8 8 年 8 月 1 日 至 9 0 年 7 月 3 1 日 計畫主持人:顏清連 國立台灣大學土木系 教授 一、中文摘要 本研究計畫主持人於過去數年致力橋 墩沖刷研究,關於應用三維數值模式來模 擬橋墩周圍之流場及沖刷,已獲得合理之 成果。為進一步提升模式的可信度,本研 究針對變量流非均勻沈滓之橋墩沖刷進行 試驗量測工作,然後以此試驗結果對模式 進行檢定及驗證。從模擬結果分析可知, 模式可合理模擬墩前之沖刷深度與沈滓級 配隨時間的變化。 繼而,本研究針對台灣河川水文及沈 滓的特性,利用模式來探討一系列參數(變 量流參數P、無因次沈滓粒徑do/ 及其級D 配標準偏差值s )對沖刷深度之影響,並g 建立其迴歸關係式,使研究成果能落實於 工程設計上之推廣使用。 關鍵詞:橋墩、沖刷、非均勻沈滓、變量 流、試驗量測 Abstract
The principal investigator has conducted a series of studies on bridge scour and developed three-dimensional numerical models that can simulate flow field and scour evolution around bridge piers reasonably well. In order to validate the models, it is necessary to calibrate and verify the models with comprehensively experimental data. Hence the scour experiments with uniform and non-uniform sediments under steady and unsteady flow conditions have been carried out to obtain data for calibration and verification of the models. From the results of simulation, it is shown that
the models can simulate the evolutions of scour depth and sediment gradation at the pier nose reasonably well.
Then, a systematic study on the influences of the unsteady flow parameter P , dimensionless
sediment size do/D and sediment gradation parameter s has been carried out tog
investigate the relationship with the scour depth. The range of each parameter is chosen according to the field situation in Taiwan’s streams. For practical applications, the results of simulation have been analyzed to establish regression relations.
Keywords: Pier, Scour, Non-uniform Sediment, Unsteady Flow, Experimental Measure
二、計畫緣由與目的 本研究計畫係接續主持人八十八年度 執行之〝非均勻沈滓變量流之橋墩沖刷模 擬研究 (三).試驗與模擬驗證〞(NSC 88-2211-E-002-054),為二年期之研究計畫。 本研究的目的主要是先獲得充分的試驗量 測資料來對沖刷模式進行完整的檢定與驗 證,而後利用模式來作各種參數對沖刷深 度影響的一系列探討,以落實工程設計上 之應用。 三、結果與討論 1. 試驗量測結果 試驗條件如表一所示, 圖 1 為定量流 之墩前鼻頭點沖刷深度隨時間變化。由圖1 中 之Runs S2、S 3與 S 4比較可知,非均勻 沈滓之護甲效應十分明顯,其中RunS4這
組,由於沈滓粒徑級配標準偏差值較大, 在水力篩選過程中,會有較多粗顆粒停留 在底床表層,護甲層較早形成,故其沖刷 深度較低於其他二組。 圖2 為變量流之墩 前鼻頭點沖刷深度隨時間變化。由圖中可 知,最大沖刷深度主要是發生在尖峰流量 時段,而在流量減退過程中,沖刷深度幾 乎維持不變。 為探討非均勻沈滓之護甲作用,分別 在沖刷平衡時對Runs S3、S 4與 S7~S10底 床表面沈滓採樣,以0.5公分為一層,共取 6 層分別進行篩分析。圖3 為墩前表層沈滓 之幾何平均粒徑d (g = d15.9×d84.1 )隨深度 的變化。由圖中可知,沈滓之幾何平均粒 徑會隨深度增加而趨近於起始沈滓粒徑, 其中幾何平均粒徑大於起始沈滓粒徑之深 度可視為混合層厚度,利用量測之混合層 厚度進行迴歸分析,其迴歸式表示如下: 4 . 2 8 . 1 o g m d T = s (1) 其中T 為混合層厚度;m d 為起始沈滓粒o 徑;s 為起始沈滓粒徑級配標準偏差值。g 在變量流橋墩沖刷過程中,流速與流 量歷線延時的變化均會對沖刷深度造成影 響 , 圖 4 為 無 因 次 超 額 沖 刷 深 度 D d dsp so)/ ( - 隨 變 量 流 參 數 P = D t V Vp o) d / ( - 的變化。其中d 為變量流條sp 件下之最大沖刷深度;d 為在相同延時以so 及流量為基流量時之最大沖刷深度;D 為 橋墩直徑;V 為尖峰流量時之平均流速;p o V 為基流量時之平均流速;t 為延時。由d 圖中可知,變量流參數愈大,則超額沖刷 深度愈大。 2. 模式之檢定與驗證 在定量流沖刷條件下,採用Run S2 與 Run S4之試驗結果進行模式的參數檢定, 然後用相同的參數,以Run S3 之試驗結果 進行驗證。 圖5 為墩前鼻頭點沖刷深度隨 時間變化模擬結果之比較。 圖6 為墩前鼻 頭點沈滓幾何中值粒徑隨時間變化模擬結 果之比較。由圖中可看出,模擬之鼻頭點 沖刷深度和沈滓中值粒徑均與量測值相當 接近,兩者相當吻合。在變量流沖刷條件 下,採用Run U1與 Run U9之試驗結果進 行模式的參數檢定,然後用相同的參數, 以Run U6之試驗結果進行驗證。試驗與模 擬用之流量歷線如圖7 所示。 圖 8 為墩前 鼻頭點沖刷深度隨時間變化模擬結果之比 較。由圖中可看出,模擬之沖刷深度與量 測值相當接近,模式驗證結果可認為合 理。 3. 模式之應用 台灣河川水文與沈滓的特性因地區而 異,表二為摘錄台灣省水利處各河川整治 計畫報告(李等,1997)所得之本省河川特性 統計資料,包含北、中、南與東部等30條 河川的基本資料。本研究依據表二中濁水 溪的相關資料來選定變量流參數P 、無因 次沈滓粒徑do/ 及其級配標準偏差值D sg 等參數值的範圍以進行數值試驗,數值試 驗之條件與結果如表三所示,其中流量歷 線之設定如圖9 所示。 根據表三數值試驗之模擬結果,利用 多變數迴歸分析建立最大沖刷深度與各參 數之關係式如下: 768 . 0 064 . 1 3 721 . 2 4 10 10 0186 . 0 -÷÷ ø ö çç è æ × ÷ ø ö ç è æ = o g sp D d P D d s (2) 其 中d 為變量流條件下之最大沖刷深sp 度。根據上式中各參數指數值的大小,可 知變量流參數P 為影響沖刷深度的最大因 素。 四、計畫成果自評 本研究依計畫內容,完成變量流非均 勻沈滓之橋墩沖刷試驗量測工作,並根據 量測結果對模式進行檢定與驗證。此外, 根據蒐集之台灣主要河川的水文與沈滓特 性,選定適當的變量流參數P 、無因次沈 滓粒徑do/ 及其級配標準偏差值D s 的範g 圍,有系統的進行數值試驗,探討各參數 對沖淤變化的影響,並建立沖刷深度與參 數之迴歸關係式。根據以上的研究成果, 本研究已達到原計畫的預定目標。
五、參考文獻 1.曾明性, (1994),“橋墩周圍流場與底床沖 刷之模擬研究” 國立台灣大學土木工 程學研究所博士論文。 2.顏清連、曾明性、賴進松、張文鎰, (1997), “非均勻沈滓變量流之橋墩沖刷模擬研 究 (一).基本模式之改良” 國立台灣大 學 水 工 試 驗 所 研 究 報 告 第 二 七 七 號 (NSC-86-2621-E-002-021)。 3.李鴻源、賴進松, (1997), “跨河結構物 施設規範之研議” 國立台灣大學水工 試驗所研究報告第二六一號。 4.張文鎰, (1998),“橋墩沖刷模式之改良與 驗證” 國立台灣大學土木工程學研究 所碩士論文。 5.顏清連、曾明性、賴進松、張文鎰, (1998), “非均勻沈滓變量流之橋墩沖刷模擬研 究 (二).非均勻沈滓之沖刷模擬” 國立 台灣大學水工試驗所研究報告第三一0 號(NSC-87-2218-E-002-045)。 6.顏清連、賴進松、張文鎰、李家齊, (1999), “非均勻沈滓變量流之橋墩沖刷模擬研 究 (三).試驗與模擬驗證” 國立台灣大 學 水 工 試 驗 所 研 究 報 告 第 三 四 二 號 (NSC-88-2218-E-002-054)。
7.Ettema, R., (1980), “ Scour at bridge piers.” Rept. No.216, Univ. of Auckland, Auckland, New Zealand.
8.Kothyari, U. C., (1989), “Scour around bridge piers.” Ph.D. Thesis, Univ. of Roorkee, Roorkee, India.
六、附表、附圖與附照 表一、模型試驗條件 Run (m)D do (mm) g s H (cm/s) V (cm/s) Q (m3/s) d t (hr) S1 10 1.00 1.2 20.0 39.0 0.078 19 S2 10 1.00 1.2 20.0 28.0 0.056 19 S3 10 1.00 2.0 20.0 28.0 0.056 19 S4 10 1.00 3.0 20.0 28.0 0.056 19 S5 10 0.71 1.2 30.0 35.5 0.107 7 S6 10 0.71 1.2 15.0 22.7 0.034 7 S7 10 0.71 2.0 30.0 35.5 0.107 7 表一(續) Run (m)D do (mm) g s H (cm/s) V (cm/s) Q (m3/s) d t (hr) S8 10 0.71 2.0 15.0 22.7 0.034 7 S9 10 0.71 3.0 30.0 35.5 0.107 7 S10 10 0.71 3.0 15.0 22.7 0.034 7 U1 10 0.71 1.2 15.0~30.0 22.7~35.5 0.034~0.107 7 U2 10 0.71 1.2 15.0~25.0 22.7~33.1 0.034~0.083 7 U3 10 0.71 1.2 15.0~20.0 22.7~29.2 0.034~0.058 7 U4 10 0.71 1.2 15.0~30.0 22.7~35.5 0.034~0.107 7 U5 10 0.71 1.2 15.0~30.0 22.7~35.5 0.034~0.107 7 U6 10 0.71 2.0 15.0~30.0 22.7~35.5 0.034~0.107 7 U7 10 0.71 2.0 15.0~25.0 22.7~33.1 0.034~0.083 7 U8 10 0.71 2.0 15.0~20.0 22.7~29.2 0.034~0.058 7 U9 10 0.71 3.0 15.0~30.0 22.7~35.5 0.034~0.107 7 U10 10 0.71 3.0 15.0~25.0 22.7~33.1 0.034~0.083 7 U11 10 0.71 3.0 15.0~20.0 22.7~29.2 0.034~0.058 7 表二、台灣河川特性統計 河川名稱 等級 設計流量 (m3/s) d50 (mm) 類別 設計河寬 (m) 大漢溪 主要 9600 34~116 礫石 540 鳳山溪 次要 2400 0.25~127 砂礫石 250 社子溪 次要 553 76 礫石 140 福興溪 普通 450 0.22~88 砂礫石 50~120 三峽河 主要 2730 20~44 礫石 165~320 老街溪 次要 590 0.5~76 砂礫石 90 頭前溪 主要 11200 0.22 砂 700 鹽港溪 普通 472 0.14~0.18 砂 60 南澳溪 次要 3580 19~185 礫石 400~570 濁水溪 主要 24000 0.56~100.64 砂礫石 3620~1027 大甲溪 主要 10300 54~167 礫石 395~1510 後龍溪 主要 5300 140 礫石 120~330 大安溪 主要 13840 82~190 礫石 565~1023 中港溪 次要 5380 0.37~31 砂礫石 400 貓羅溪 次要 4540 52~116 礫石 350 西湖溪 次要 1000 0.37~102 砂礫石 150 新虎尾溪 主要 600 0.32~0.45 砂 130 曾文溪 次要 9200 0.016~0.056 砂 800~1600 枋山溪 次要 2140 17~38 礫石 200~325 林邊溪 普通 3530 3.82~7 礫石 849~1491 率芒溪 次要 1300 22~33 礫石 200 朴子溪 主要 2960 0.02~0.16 砂 400 四重溪 次要 1900 8.6~59 礫石 80~180 二仁溪 主要 3240 0.13~0.27 砂 250 八掌溪 主要 3580 0.09~0.25 砂 600~700 花蓮溪 主要 16600 20~38 礫石 1000 和平溪 次要 9900 14~65 礫石 746~1140 吉安溪 次要 590 9.31~39 礫石 55~60 卑南溪 主要 17400 20~48 礫石 650~1200 秀姑巒溪 主要 17600 2.7~16 礫石 400~700
表三、數值試驗之條件與結果 Run P do/D sg dsp/D T111~T113 11.34 ´ 104 2.5 ´ 10-3 1.2, 2.4, 4.8 4.52, 2.25, 1.08 T121~T123 11.34 ´ 10 4 5 ´ 10-3 1.2, 2.4, 4.8 2.16, 1.67 ,0.69 T131~T133 11.34 ´ 10 4 10 ´ 10-3 1.2, 2.4, 4.8 1.13, 0.64, 0.36 T211~T213 8.51 ´ 10 4 2.5 ´ 10-3 1.2, 2.4, 4.8 2.07, 1.53, 0.83 T221~T223 8.51 ´ 10 4 5 ´ 10-3 1.2, 2.4, 4.8 1.02, 0.58, 0.34 T231~T233 8.51 ´ 104 10 ´ 10-3 1.2, 2.4, 4.8 0.44, 0.26, 0.18 T311~T313 5.67 ´ 10 4 2.5 ´ 10-3 1.2, 2.4, 4.8 0.63, 0.37, 0.23 T321~T323 5.67 ´ 10 4 5 ´ 10-3 1.2, 2.4, 4.8 0.35, 0.22, 0.14 T331~T333 5.67 ´ 10 4 10 ´ 10-3 1.2, 2.4, 4.8 0.14, 0.08, 0.04 註:P=(Vp-Vo)td/D,Vo =0.1Vp,td =35hr,D=2m, 5 = H m。 圖1 定量流墩前鼻頭點沖刷深度之演進 圖2 變量流墩前鼻頭點沖刷深度之演進 圖3 墩前表層沈滓之幾何平均粒徑變化 圖4 超額沖刷深度與變量流參數之關係 圖5 模擬與實測定量流墩前鼻頭點沖刷深度之比較 0.2 0.4 0.6 0.8 1 t / td 0.0 1.0 2.0 ds /D Run S1 S2 S3 S4 S5 S6 S7 S8 S9 S10 0 0.2 0.4 0.6 0.8 1 t / td 0.0 1.0 2.0 ds /D
(a) Unif orm sediments
Run U1 U2 U3 U4 U5 0.2 0.4 0.6 0.8 1 t / td 0.0 0.2 0.4 0.6 0.8 1.0 ds /D (b) Non-uniform sediments Run U6 U7 U8 U9 U10 U11 0 0.5 1 1.5 2 2.5 3 depth (cm) 0 0.5 1 1.5 2 2.5 3 dg /do 0 0.5 1 1.5 2 2.5 3 depth (cm) 0 0.5 1 1.5 2 2.5 3 dg /do 0 0.5 1 1.5 2 2.5 3 depth (cm) 0 0.5 1 1.5 2 2.5 3 dg /do 0 0.5 1 1.5 2 2.5 3 depth (cm) 0 0.5 1 1.5 2 2.5 3 dg /do 0 0.5 1 1.5 2 2.5 3 depth (cm) 0 0.5 1 1.5 2 2.5 3 dg /do 0 0.5 1 1.5 2 2.5 3 depth (cm) 0 0.5 1 1.5 2 2.5 3 dg /do Run S3 Run S4 Run S7 Run S8 Run S9 Run S10 (Vp-Vo)td/ D /10 3 0 0.4 0.8 1.2 (dsp -dso ) /D 0 1 2 3 4 g s = 1.2 2.0 3.0 0 0.2 0.4 0.6 0.8 1 t / td 0 0.5 1 1.5 ds /D measured simulated sg 1.2 2.0 3.0
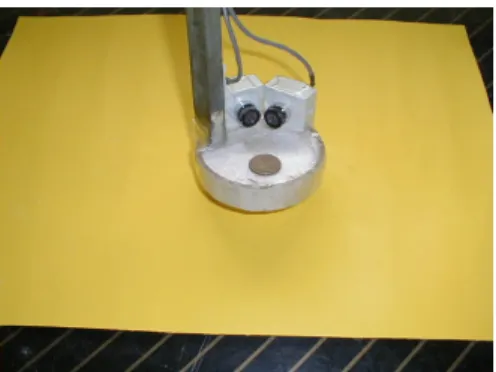
圖6 模擬與實測定量流墩前鼻頭點沈滓中值之比較 圖7 試驗與模擬用之流量歷線 圖8 模擬與實測變量流墩前鼻頭點沖刷深度之比較 圖9 流量歷線的流速分佈 照1 觀測沖刷用之微小型攝影機 照2 橋墩周圍表層沈滓採樣工具 照3 均勻沈滓之沖刷坑床形 (Run S2, t = 2 hr) 照4 非均勻沈滓之沖刷坑床形 (Run S3, t = 40 min) 0 0.2 0.4 0.6 0.8 1 t / td 0 1 2 3 dg /do measured (sg= 2.0) measured (sg= 3.0) simulated (sg= 2.0) simulated (sg= 3.0) 0 1 2 3 4 5 6 7 time (hr) 0 0.04 0.08 0.12 Q (m 3/s ) Qo Q1 Qp Q2 Q3 Q4 Qo V (m /s ) 0 5 10 15 20 25 30 35 time (hr) Vo V1 Vp V2 V3 V4 Vo Vo= 0.100Vp V1= 0.550Vp V2= 0.775Vp V3= 0.550Vp V4= 0.325Vp td tp= td/ 3 0 0.2 0.4 0.6 0.8 1 t / td 0 0.4 0.8 1.2 1.6 2 ds /D measured simulated sg 1.2 2.0 3.0