Title page
2-(Naphthalene-1-yl)-6-pyrrolidinyl-4-quinazolinone inhibits skin cancer M21
cell proliferation through aberrant expression of microtubule and cell cycle
Yang C. Wu, Mann J. Hour, Wing C. Leung, Chi Y. Wu, Wen Z. Liu, Yu H. Chang and Hong
Z. Lee
Graduate Institute of Integrated Medicine, China Medical University, Taichung, Taiwan
(Y.C.W.)
School of Pharmacy, China Medical University, Taichung, Taiwan (H.Z.L., M.J.H., W.Z.L.,
Y.H.C.)
Department of Radiation Oncology, Wang Fang Hospital, Taipei Medical University, Taipei,
Taiwan (W.C.L.)
Running title: HL66 induces mitotic catastrophe
Corresponding author:
Professor Hong-Zin Lee
School of Pharmacy, China Medical University, 91, Hsueh-Shih Road, Taichung, 40402,
Taiwan
Tel./fax: +886-4-22316290
E-mail: [email protected]
Number of text pages: 32
Number of figures: 7
Number of tables: 3
Numbers of references: 32
Words in the abstract: 159
Words in the introduction: 580
Words in the discussion: 1067
Abbreviations: AIF, apoptosis-inducing factor; Cdk, cyclin-dependent kinase; DAPI,
4′,6-diamidino-2-phenylindole dihydrochloride; DMSO, dimethylsulfoxide; EGTA,
ethyleneglycol-bis-(β-aminoethylether)-N,N,N′,N′-tetraacetic acid; FBS, fetal bovine serum;
FITC, fluorescein isothiocyanate; HL66,
2-(naphthalene-1-yl)-6-pyrrolidinyl-4-quinazolinone; HRP, horseradish peroxidase; JC-1,
5,5′,6,6′-tetrachloro-1,1′,3,3′-tetraethylbenzimidazolocarbocyanine iodide; M21 cells, human
skin cancer cell line; PBS, phosphate-buffered saline; PI, propidium iodide; SDS-PAGE,
sodium dodecyl sulfate-polyacrylamide gel electrophoresis; TBST, Tris-buffered saline with
Abstract
Microtubules are a proven target for anticancer drug development because they are critical
for mitotic spindle formation and the separation of chromosomes at mitosis.
2-(Naphthalene-1-yl)-6-pyrrolidinyl-4-quinazolinone (HL66) induced cell death with the
large cells and multiple micronuclei in skin cancer M21 cells. We demonstrated that
HL66-induced cell death is caspase-independent and accompanied by the failure of the cell
cycle progression. Therefore, HL66-induced cell death may be a mitotic catastrophe. HL66
inhibits the dephosphorylation on Thr14 or Tyr15 of Cdk1 and the formation of Cdk1/cyclin
B1 complex, which might be associated with cell cycle arrest at S and G2/M phase. HL66 is
an antimicrotubule agent by molecular modeling on the basis of ligand binding to tubulin
molecule. Furthermore, we also demonstrated that HL66, like vinblastine, is a
tubulin-destabilizing agent via microtubule disruption in M21 cells. These results describe a
novel pharmacological property of HL66 as a microtubule inhibitor, which may make it an
Introduction
Quinazolinones have been demonstrated to be antimitotic agent and exert their antitumor
activity through inhibition of the DNA repair enzyme system or dysregulation of cell cycle
progression of cancer cells (Hamel et al., 1996; Yang et al., 2004). However, the reasons why
the molecular mechanisms of quinazolinones produced their biological effects remain
unknown. Recently, the efficacy of antitumor drugs has been estimated on their capacity to
induce apoptosis in tumor cells. It is now evident that apoptosis may not be the primary
mechanism of cell death in tumors (Roninson et al., 2001; Castedo et al., 2004; Brown and
Attardi, 2005). The term “mitotic catastrophe” is used to describe cell death occurring during
mitosis, as a result of DNA damage or deranged spindle formation couple to the debility of
different checkpoint of cell cycle that would normally arrest progression into mitosis.
Therefore, mitotic catastrophe is a type of cell death resulting from abnormal mitosis, which
usually ends in the formation of large cells with multiple micronuclei and decondensed
chromatin (Molz et al., 1989; Swanson et al., 1995). It has been argued that mitotic
catastrophe would be fundamentally different from apoptosis (Roninson et al., 2001).
However, reports describing mitotic catastrophe frequently show cells with some phenotypic
characteristic of apoptosis, such as chromatin condensation or the expression of
apoptosis-related proteins (Chakrabarti and Chakrabarti, 1987; Heald et al., 1993).
mitotic catastrophe has been investigated in many cancer cells. Many reports have indicated
that antimicrotubule drugs, such as taxanes and Vinca alkaloids, may disturb G2/M transition
and induce the cell cycle arrest and apoptosis or mitotic catastrophe in tumor cells (Wang et
al., 1999; Roninson et al., 2001). Activation of cyclins-Cdks (cyclin-dependent kinases)
complexes is required for cell cycle progression. Distinct pairs of cyclins and Cdks regulate
progression through different stages of the cell cycle. However, progression of the cell cycle
from G2 to M phase is driven by the activation of the Cdk1/cyclin B1 complex. The
abnormal activations of cyclin B1 and Cdk1, resulting in deficient cell cycle checkpoints,
have been demonstrated to induce mitotic catastrophe (Castedo et al., 2004).
Paclitaxel and vinblastine belong to the class of antimicrotubule agents and widely used
chemotherapeutic drugs against a number of malignancies, whereas the development of drug
resistance limits its usefulness (Gottesman et al., 2002; Doyle and Ross, 2003; Cheung et al.,
2010). Higher doses are then required to achieve the same efficacy with consequent increase
in systemic toxicity to normal tissues. Thus, many investigators concentrated efforts on
understanding the mechanisms of drug resistance or identifying novel and highly specific
anticancer drugs to overcome the disease (Kartalou and Essigmann, 2001; Agarwal and Kaye,
2003). For overcoming paclitaxel or vinblastine-resistant tumor cells and developing a more
potent antitumor agent, we designed a series of quinazolinone derivatives by molecular
for antitumor activity of 2-(naphthalene-1-yl)-6-pyrrolidinyl-4-quinazolinone (HL66) has
demonstrated that HL66 displayed anti-proliferation in several cancer cell types, especially
for skin cancer M21 cells. The HL66-induced M21 cell mitotic catastrophe, via microtubule
disruption, was caspase-independent and accompanied by the characteristics of large cells
with multiple micronuclei, Bcl-2 phosphorylation and cell cycle arrest at S and G2/M phase.
The aberrant expression of the activity of Cdk1/cyclin B1 complex was involved in the
HL66-induced M21 cell death in this study. We have also demonstrated that HL66, like
vinblastine, is a microtubule-depolymerizing agent in M21 cells.
Materials and Methods
Materials
HL66 was designed and synthesized by Mann J. Hour as previously described with a
modification of the starting materials (Hour et al., 2007). Antipain, aprotinin, dithiothreitol,
ethylene glycol bis(β-aminoethylether)-N,N,N′,N′-tetraacetic acid (EGTA), leupeptin,
pepstatin, phenylmethylsulfonyl fluoride and Tris were purchased from Sigma Chemical
Company (St. Louis, MO, USA). Annexin V-FITC apoptosis detection kit was purchased
from BioVision (Mountain view, CA, USA). Antibodies to various proteins were obtained
from the following sources: Bcl-2, apoptosis-inducing factor (AIF) and β-actin antibodies
cytochrome c, cyclin A, cyclin B1, cyclin D, cyclin E, Cdk1, Cdk2, Cdk4, Cdk1(pY15) and
p21 were purchased from BD Biosciences (San Diego, CA, USA); p53 was purchased from
Santa Cruz Biotechnology (Santa Cruz, CA, USA); caspase-4, caspase-9, Bcl-2(pS70) and
Cdk1(pT14) were purchased from Abcam (Cambridge, MA, USA). HRP-conjugated goat
anti-mouse and -rabbit IgG were from Jackson Immunoresearch (Hamburg, Germany).
Cell culture
M21 cell line (human malignant melanoma) was kindly provided by Dr. Feng-Yao Tang.
A375.S2 (human malignant melanoma) and A431 (human epidermoid carcinoma) cell lines
were from ATCC (American Type Culture Collection, Rockville, MD, USA). Cells were
grown in monolayer culture in RPMI medium 1640, Eagle's minimum essential medium or
Dulbecco’s modified Eagles medium (Invitrogen Corporation, Grand Island, NY, USA)
containing 10% fetal bovine serum (FBS; HyClone, Logan, UT, USA), 100 U/ml penicillin
and 100 μg/ml streptomycin (Gibco BRL, Rockville, MD, USA) at 37°C in a humidified
atmosphere comprised of 95% air and 5% CO2. When cells were treated with HL66, the
culture medium containing 1% FBS was used. All data presented in this study are from at
least 3 independent experiments.
Cells were seeded at a density of 5 × 10⁴ cells per well onto 12-well plate 48 h before
being treated with drugs. The cells were incubated with various indicated concentrations of
HL66 for 4, 8, 16 and 24 h. The control cultures were treated with 0.1% dimethylsulfoxide
(DMSO). After incubation, cells were washed with phosphate-buffered saline (PBS). The
number of viable cells was determined by staining cell population with Trypan blue. One part
of 0.2% Trypan blue dissolved in PBS was added to one part of the cell suspension, and the
number of unstained (viable) cells was counted.
Annexin V-FITC/PI double staining assay
Annexin V/PI staining assay was employed to further classify M21 cells in early
apoptosis or late apoptosis stages. Annexin V-FITC/PI double staining of the cells was
determined using the annexin V-FITC apoptosis detection kit. This test employs the property
of annexin V-FITC to bind to the membrane phospholipid phosphatidylserine in the presence
of Ca2+. Cells were seeded at a density of 3.5 × 10⁵ cells onto 6-cm dish 48 h before being
treated with drugs. Cells were incubated with 0.033 μM of HL66. For annexin-based FACS
analysis, cells were trypsinized, washed twice in ice-cold PBS and resuspended in 500 μl
binding buffer. Approximately 1 × 10⁵ cells were then stained for 5 min at room temperature
with annexin V-FITC and PI in a Ca2+ enriched binding buffer (Annexin V-FITC kit) and
emissions were detected in the FL 1 and FL 2 channels of FACSCanto flow cytometer, using
emission filters of 520 and 623 nm, respectively. Approximately 10,000 counts were made
for each sample. The annexin V-FITC(-)/PI(-) population was regarded as control cells (Q3),
whereas annexin V-FITC(+)/PI(-) cells were taken as a measure of early apoptosis (Q4),
annexin V-FITC(+)/PI(+) as late apoptosis (Q2) and annexin V-FITC(-)/PI(+) as necrosis
(Q1).
4′,6-Diamidino-2-phenylindole dihydrochloride (DAPI) staining
M21 cells were seeded onto 12-well plate 48 h before being treated with drugs. The cells
were incubated with vehicle alone or 0.033 μM HL66. After treatment, cells were fixed with
3.7% formaldehyde for 15 min, permeabilized with 0.1% Triton X-100 and stained with 1
μg/ml DAPI for 5 min at 37°C. The cells were then washed with PBS and examined by
fluorescence microscopy (Olympus IX 70).
Morphological investigation
Cells were seeded at a density of 5 × 10⁴ cells per well onto 12-well plate 48 h before
being treated with drugs. The cells were incubated with vehicle alone or 0.033 μM HL66.
The control cultures were treated with 0.1% DMSO. After treatment, the cells were
chosen in the center of each well at approximately the same location for photography.
Protein preparation
Cells were seeded at a density of 1 × 10⁶ cells onto 10-cm dish 48 h before being treated
with drugs. Cells were incubated with 0.033 μM HL66 for 4, 8, 16 or 24 h. After treatment,
adherent and floating cells were collected at the indicated time intervals and washed twice in
ice-cold PBS. Cell pellets were resuspended in cell lysis buffer (50 mM Tris-HCl, pH 7.5,
150 mM NaCl, 1% Nonidet P-40, 0.25% sodium deoxycholate, 1 mM EGTA, 1 mM
dithiothreitol, 1 mM phenylmethylsulfonyl chloride, 1 mM sodium orthovanadate, 1 mM
sodium fluoride, 5 μg/ml aprotinin, 5 μg/ml leupeptin and 5 μg/ml antipain) for 30 min at
4°C. Lysates were clarified by centrifugation at 13,000 rpm for 30 min at 4°C and the
resulting supernatant was collected, aliquoted and stored at -80°C until assay. To determine
the mitochondrial and cytosolic cytochrome c, Bax and AIF levels, the cells were harvested
and mitochondrial and cytosolic fractions were isolated with the ProteoExtract
Cytosol/Mitochondria Fractionation Kit (Calbiochem) according to the manufacturer’s
instructions. The protein concentrations were estimated with the Bradford method.
Western blot analysis
sulfate-polyacrylamide gel electrophoresis (SDS-PAGE; Bio-Rad, Hercules, CA, USA). The
SDS-separated proteins were equilibrated in transfer buffer (50 mM Tris-HCl, pH 9.0-9.4, 40
mM glycine, 0.375% SDS and 20% methanol) and electrotransferred to Immobilon-P
Transfer Membranes (Millipore Corporation, Bedford, MA, USA). The blot was blocked
with a solution containing 5% nonfat dry milk in Tris-buffered saline (10 mM Tris-HCl and
150 mM NaCl) with 0.05% Tween 20 (TBST) for 1 h, washed and incubated with antibodies
to β-actin (1:5000), AIF (1:1000), Bax (1:500), Bcl-2 (1:1000), Bcl-2(pS70) (1:1000),
procaspase-2 (1:2000), procaspase-3 (1:1000), procaspase-4 (1:12000), procaspase-8
(1:8000), procaspase-9 (1:200), cytochrome c (1:5000), cyclin A (1:500), cyclin B1 (1:500),
cyclin D (1:500), cyclin E (1:500), Cdk1 (1:2500), Cdk2 (1:2500), Cdk4 (1:500), Cdk1(pT14)
(1:2000), Cdk1(pY15) (1:500), p21 (1:500) and p53 (1:1000). Secondary antibody consisted
of a 1:20,000 dilution of horseradish peroxidase (HRP)-conjugated goat anti-mouse IgG (for
β-actin, Bcl-2, Bax, caspase-2, caspase-3, caspase-8, cytochrome c, cyclin A, cyclin B1, cyclin D, cyclin E, Cdk1, Cdk2, Cdk4, Cdk1(pY15), p21 and p53) or HRP-conjugated goat
anti-rabbit IgG (for AIF, caspase-4, caspase-9, Bcl-2(pS70) and Cdk1(pT14)). The enhanced
chemiluminescent (NEN Life Science Products, Boston, MA, USA) detection system was
used for immunoblot protein detection.
In this study, the detection of α- and β-tubulin was used to examine the microtubule
formation in M21 cells. Cells grown on coverslips were treated with vehicle alone, 0.033 μM
HL66, 0.006 μM vinblastine or 0.07 μM paclitaxel for 8, 12 and 24 h. To visualize α-tubulin,
the cells were incubated with mouse anti-α-tubulin antibody, washed and subsequently
stained with FITC-conjugated goat anti-mouse IgG. To detect β-tubulin, the cells were
incubated for 30 min at 37°C with 250 nM Tubulin TrackerTM Green reagent. TubulinTracker
Green reagent is an uncharged, nonfluorescent compound that easily passes through the
plasma membrane of live cells. Once inside the cell, the lipophilic blocking group is cleaved
by non-specific esterases, resulting in a green-fluorescent, charged form. After three
washings in PBS, the cells were observed by fluorescence microscopy (H600L, Nikon).
Cell cycle analysis
Briefly, 2 × 10⁶ cells were trypsinized, washed twice with PBS and fixed in 80% ethanol.
Fixed cells were washed with PBS, incubated with 100 μg/ml RNase A for 30 min at 37°C,
stained with propidium iodide (50 μg/ml) and analyzed on a FACScan flow cytometer
(Becton Dickinson, San Jose, CA, USA). Approximately 10,000 counts were made for each
sample. ModFit LT3.0 software (Verity Software House) was employed for cell cycle
Immunostaining
Cells grown on coverslips were treated with vehicle alone or 0.033 μM of HL66 for 12 h.
After treatment, cells were washed with PBS, fixed with formaldehyde for 10 min and then
permeabilized with 1% Triton X-100 in PBS for 10 min. Fixed cells were subsequently
incubated with a blocking solution (2.5% bovine serum albumin) for 1 h at room temperature.
Cells were then incubated 1 h at 37°C with protein-specific antibodies diluted 1:50 in TBST
solution. The cells were washed 3 times with TBST and incubated for 30 min at 37°C with
fluorescein-conjugated anti-mouse IgG antibody diluted 1:50 in TBST. After washing with
TBST, the specimens were mounted in glycerin and observed by fluorescence microscopy
(H600L, Nikon).
Molecular modeling
The three dimensional crystal structures of the appropriate proteins were downloaded
from RCSB Protein Data Bank website (http://www.rcsb.org/pdb). Automated docking was
then carried out. The LigandFit within the software package Discovery Studio 2.5 (Accelrys,
San Diego, USA) was used to evaluate and predict the in silico binding free energy of the
inhibitors within the macromolecules.
Statistically significant differences from the control group were identified by Student’s t
test for paired data. A P value less than 0.05 was considered significant for all tests.
Results
The effect of HL66 on cell proliferation in M21 cells
Since HL66 is a quinazolinone analog, we attempted to evaluate the effect of HL66 on
cell proliferation in M21 cells. Figure 1 shows the results of Trypan blue exclusion assay on
M21 cells after treatment with HL66. Twenty-four hours of continuous exposure to various
indicated concentrations of HL66 (0.01, 0.033 and 0.1 μM) on M21 cells resulted in dose-
and time-dependent decreases in cell number relative to control cultures (Fig. 1). The IC50
(inhibitory concentration) of HL66 was about 0.033 μM. Therefore, 0.033 μM HL66 was
chosen for further experiments. We also demonstrated that HL66 has the same antitumor
effects on CH27 (human lung cancer), HSC-3 (human oral cancer), Hep3B (human liver
cancer), A431 (human epidermoid carcinoma) and A375.S2 (human malignant melanoma)
cell lines. As shown in Table 1, HL66 had an excellent anticancer effect on M21 cells.
Effects of HL66 on the apoptotic characteristics in M21 cells
further investigate whether the induction of cell death by HL66 was a typical apoptosis of
M21 cells, the analysis of phosphatidylserine externalization was performed. Propidium
iodide (PI) is a non-specific DNA intercalating agent, which is excluded by the plasma
membrane of living cells, and thus can be used to distinguish necrotic cells from apoptotic.
Therefore, the annexin V/propidium iodide staining and flow cytometry analysis were used to
confirm M21 cell apoptosis in this study. The typical features of apoptosis (the cell
populations of early and late apoptosis) were not observed after treatment with 0.033 μM
HL66 (Fig. 2A). The phenotypic characteristics of HL66-treated M21 cells were evaluated by
microscopic inspection of overall morphology and DAPI staining of nuclear morphology.
The nuclei feature of control cells was round, whereas shrunk cells with several micronuclei
and even some blebbing and condensed nucleus were observed after treatment with 0.033
μM HL66 for 16 h (Fig. 2B). We also demonstrated that paclitaxel (0.07 μM)- or vinblastine (0.006 μM)-treated cells had a similar appearance to those in the HL66-treated cells (data not
shown). The IC50 value of paclitaxel and vinblastine is 0.07 and 0.006 μM respectively. In
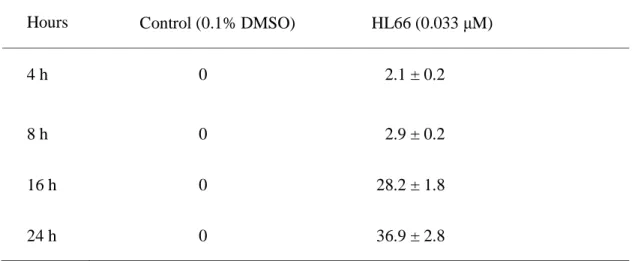
this study, the ratio of cells with multiple micronuclei was estimated. As shown in Table 2,
there were significant differences between HL66-treated and control cells after treatment of
cells with 0.033 μM HL66 for 16 and 24 h. Since many of the HL66-treated cells possessed
multiple micronuclei, the proportion of cells in the sub-G1 phase was also examined by flow
percentage of cells at sub-G1 phase (Table 3). Based on the above data, HL66-induced M21
cell death might be a mitotic catastrophe, which usually ends in the formation of large cells
with multiple micronuclei.
The effect of HL66 on the expression of apoptosis-related proteins in M21 cells
In this study, HL66 had no effects on the proform of caspase-2, -3, -4, -8 and -9 proteins
(Fig. 3A). Apoptosis-inducing factor (AIF) and caspase-3 are the key indicators of
intracellular signaling of caspase-independent and -dependent apoptosis, respectively.
Therefore, the protein expression of AIF was examined in this study. After M21 cells were
treated with 0.033 μM HL66 for the indicated time intervals, there were no changes in the
expression of AIF protein (Fig. 3A). Based on the above data, M21 cells resistant to
HL66-induced apoptosis can be killed via mitotic catastrophe, an alternative cell death
mechanism. The expression of apoptosis-related proteins, such as cytochrome c, Bcl-2 and
Bax, was also examined in this study. HL66 had no effect on the protein expression of
cytochrome c (Fig. 3A). The amount of Bax protein significantly increased after treatment
with HL66 for 4 h (Fig. 3A). Exposure of M21 cells to 0.033 μM HL66 for 8 h resulted in
significant decreases in Bcl-2 protein levels (Fig. 3A). However, Bcl-2 phosphorylation was
AIF were clearly detected in cytosolic and mitochondrial fractions (Fig. 3B). When M21
cells treated with 0.033 μM HL66 for 16 and 24 h, HL66 induced cytochrome c translocation
from mitochondrial fraction to cytosolic fraction (Fig. 3B). There was a significant increase
in the protein amount of Bax in either the cytosolic or the mitochondrial fraction after HL66
stimulation (Fig. 3B). It is worthy note that AIF was largely found in the mitochondrial
fraction after treatment with HL66 (Fig. 3B).
Effects of HL66 on microtubule polymerization in M21 cells
To further examine whether the microtubules was injured by HL66 in M21 cells, the
effect of HL66 on microtubule localization was examined by detection of α- and β-tubulin.
We demonstrated that HL66 caused severe disruption and breakage of M21 cell microtubules
compared to that in control cells after treatment with HL66 for 12 h (Fig. 4). In this study,
vinblastine and paclitaxel were used as reference compounds of the damage effect on
microtubule. In M21 cells treated with 0.07 μM paclitaxel, tubulins were denser and
concentrated prominently on the nuclear margins, suggesting that paclitaxel promoted the
formation of microtubule (Fig. 4). When M21 cells were treated with 0.006 μM vinblastine
for 12 h, cells had a similar appearance to those in the HL66-treated cells (Fig. 4). Based on
the above findings, these results are consistent with the result of our molecular modeling
vinblastine binding site of tubulin molecule.
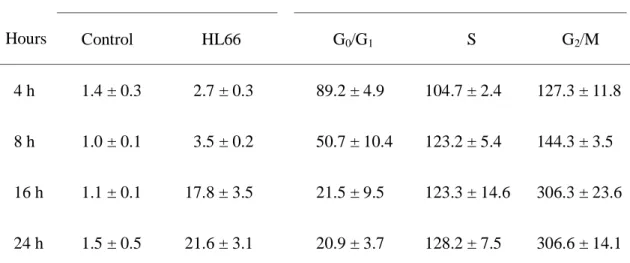
HL66 induced cell cycle arrest at S and G2/M phase of M21 cells
Since microtubules are essential for mitosis, we analyzed the changes in cell cycle
distribution upon treatment with HL66. Flow cytometric analysis was performed on cells
treated with 0.033 μM HL66 for 4, 8, 16 and 24 h. Cell cycle analysis revealed a
time-dependent S and G2/M phase arrest after treatment with HL66. Significant S and G2/M
phase arrest was indicated by decreasing proportion of cells in G0/G1 phase (Fig. 5 and Table
3). We also demonstrated that vinblastine (0.006 μM) and paclitaxel (0.07 μM) caused a
marked increase in S and G2/M phase arrest of M21 cells (Fig. 5). These findings indicate
that M21 cells failing to progress in cell cycle may be destined to cell death by HL66 and a
mitotic cell death is associated with the S and G2/M phase arrest.
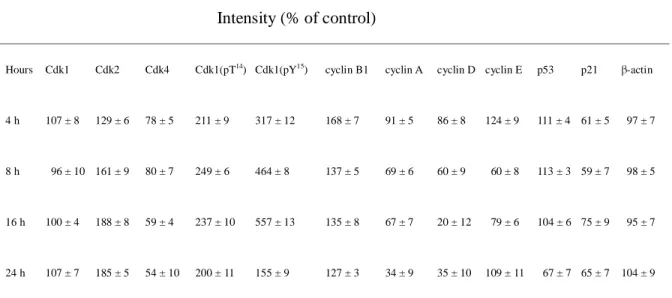
Effects of HL66 on the protein expression of cell cycle regulatory molecules in M21 cells
Since HL66-induced S and G2/M phase arrest was accompanied by a significant decrease
in G0/G1 phase, the protein expression of cell cycle regulators, cyclin D/Cdk4 (G1 phase
progression), cyclin A or E/Cdk2 (G1/S transition and S phase progression) and cyclin
B1/Cdk1 (G2/M transition), was detected during treatment with HL66 for 4, 8, 16 and 24 h.
during 0.033 μM HL66 treatment 24 h (Fig. 6A). HL66 had no effect, however, on the
protein expression of Cdk1 (Fig. 6A). It is well-known that cyclin D1 levels begin to rise
early in G1 and continue to accumulate until the G1/S phase boundary when levels rapidly
decline. The degradation of the cyclin is essential for the replication of DNA. From cell cycle
analysis data, we have demonstrated that HL66 induced an arrest of the cell cycle in S phase.
As expected, cyclin D expression decreased markedly with decreases in Cdk4 in the
HL66-treated cells in this study. Exposure of M21 cells to HL66 resulted in the decrease in
cyclin A protein levels (Fig. 6A). Based on the above data, the expression of cell cycle
regulatory molecules are involved in the HL66-induced changes in cell cycle progression. We
also demonstrated that the dephosphorylation of Cdk1 on Thr14 and Tyr15 was inhibited
although the protein levels of Cdk1 were not changed after treatment with HL66 (Fig. 6A).
The levels of p53 and p21 protein were also examined during HL66-induced M21 cell death.
Following treatment with HL66, p53 and p21 levels decreased to comparable levels in
control cells (Fig. 6A), indicating that p53 and p21 protein expression were involved in
HL66-induced M21 cell death. Densitometric analysis of the cell cycle-related protein
expression was carried out on Table 4.
Effects of HL66 on the localization of cyclin B1 and Cdk1
and Cdk1 in HL66-induced S and G2/M phase arrest, the localization of cyclin B1 and Cdk1
was analyzed by immunofluorescent staining in M21 cells. In this study, HL66 induced
cyclin B1 translocation from the cytosol into the nucleus and nuclear cyclin B1 levels
increased significantly in M21 cells (Fig. 6B). As shown in Fig. 5B, the Cdk1 distributed
throughout the cells in mainly punctuate areas and more staining observed in the nucleus in
M21 cells. After treatment with HL66, the immunostaining patterns of Cdk1 were similar to
that seen in control cells (Fig. 6B). This study also found that the distribution of
phosphorylation of Cdk1 at Tyr15 (pY15) was observed throughout the cells, and after
treatment with HL66, most of the Cdk1 (pY15) shifted to peripheral regions of the
extranucleus and concentrated prominently on the nuclear margins (Fig. 6B). The dotted
staining and bright green fluorescence of phosphorylation of Cdk1 at Thr14 (pT14) was most
intense in the nuclear after treatment with HL66 (Fig. 6B). Based on the above findings, we
demonstrated that the dephosphorylation of Cdk1 at Thr14 and Tyr15 was not observed during
HL66-induced M21 cell death even though HL66 significantly triggered the increase in the
translocation of cyclin B1. Therefore, we guess that HL66 inhibits the formation of cyclin
B1/Cdk1 complex through failure to dephosphorylation of Cdk1 at Thr14 and Tyr15, leading
to the cycle arrest at S and G2/M phase.
The three dimensional crystal structures of the tubulin domain complexed with a
tubulin-binding agent were downloaded from RCSB Protein Data Bank website
(http://www.rcsb.org/pdb). The PDB code 1sa0 is complexed with colchicine, 1z2b is
complexed with vinblastine and 1jff is complexed with paclitaxel. The computational
modeling of HL66 and these three tubulin crystal structures indicated that HL66 can bind
excellently to the vinblastine binding site, however, moderately to colchicine binding site and
not to paclitaxel binding site at all. From the result of docking simulation, we suppose that
HL66 is a tubulin-binding agent as vinblastine acts. As shown in Fig. 7, the interaction
between HL66 and 1z2b involved the hydrogen binding of N3-H with Asp 179, van der
Waals interactions of C7-H with Pro 222, van der Waals interactions of 6-pyrrolidinyl with
Pro 222, Thr 223, Tyr 224 and Leu 248, and van der Waals interactions of
2-(naphthalene-1-yl) with Pro 175, Ser 178, Asn 329 and Ile 332. These interactions made
HL66 bind readily to tubulin with low potential energy.
Discussion
This study has shown that HL66-induced M21 cell death may be a mitotic catastrophe,
which was accompanied by the characteristic of large cell with multiple micronuclei.
Moreover, M21 cells displayed S and G2/M phase arrest of cell cycle after treatment with
type of cell death resulting from abnormal mitosis, which usually ends in the formation of
large cells with multiple micronuclei (Roninson et al., 2001; Castedo et al., 2004). In addition,
we also demonstrated that the cleavage in caspase family members, such as caspase-2, -3, -4,
-8 and -9, was limited after treatment with HL66. This phenomenon was also demonstrated
by other studies in which mitotic catastrophe would be unrelated to apoptosis (Roninson et
al., 2001; Nabha et al., 2002), assuming that apoptosis must be mediated by caspases. In the
annexin V/propidium iodide staining, we have further characterized that M21 cells resistant
to HL66-induced apoptosis could be killed via mitotic catastrophe.
Since HL66 induced the mitotic arrest of cells that preceded cell death, cell cycle
regulators, in particular the expression of cyclin B1 and Cdk1, were examined. Cyclin B1
translocates from the cytosol to the nucleus during the prophase and cyclin B1 must be
destroyed by anaphase-promoting complex (APC) to allow mitosis to proceed at the end of
the metaphase (Peters, 2002). However, the activity of Cdk1 and cyclin B1 complex is
regulated by the dephosphorylation of Cdk1 on Thr14 and Tyr15 and nuclear accumulation of
cyclin B1 protein. Furthermore, the nuclear accumulation of cyclin B1 and Cdk1 has been
reported to correlate with mitotic catastrophe (Nigg, 2001; Yoshikawa et al., 2001). In this
study, HL66 induced a marked increase in the protein level of cyclin B1 and significant
cyclin B1 translocation from cytosol into nucleus in M21 cells. Furthermore, the
HL66-induced cell death. We also found that HL66-induced Cdk1 (pY15)
immunolocalization was more intense than that found in control cells, especially in the
peripheral regions of the extranucleus. Based on the above data, mitotic arrest induced by
HL66 may be associated with nuclear accumulation of cyclin B1 and the inhibition of the
dephosphorylation in Thr14 and Tyr15 of Cdk1. Therefore, we guess HL66 inhibits the
formation of cyclin B1/Cdk1 complex through failure to dephosphorylation of Cdk1 at Thr14
and Tyr15, leading to the cycle arrest at S and G2/M phase. Moreover, HL66 could induce the
sustained activation of cyclin B1 at prophase, leading to the failure of the progression of
mitosis from prophase to metaphase and formation of cytokinesis-arrested cells with multiple
micronuclei.
Many reports indicated that Cdk1 phosphorylates Bcl-2 on Ser-70 during G2/M phase of
the cell cycle and the phosphorylation of Bcl-2 is correlated with the accumulation of cells in
G2/M phase (Furukawa et al., 2000; Pathan et al., 2001). It has been also reported that the
phosphorylation of Bcl-2 is not proportional to the extent of apoptosis (Furukawa et al., 2000)
and Bcl-2 phosphorylation is only a marker of M-phase events (Ling et al., 1998).
Furthermore, drugs affecting the integrity of microtubules could induce Bc1-2
phosphorylation (Haldar et al., 1997). In this study, exposure of M21 cells to HL66 resulted
in significant decreases in Bcl-2 protein levels which were accompanied by a significant
using molecular docking study on the basis of ligand binding to tubulin molecule and was
able to inhibit the tubulin polymerization as vinblastine did. These results seemed reasonable
to suggest that HL66 is a tubulin-destabilizing agent and is able to induce the cell cycle arrest
at G2/M phase, leading to M21 cell death with the characteristic of the phosphorylation of
Bcl-2, which was correlated with the HL66-induced inhibition of the dephosphorylation of
Cdk1 on Thr14 and Tyr15.
In this study, the decrease of p21 protein levels was observed after the addition of HL66.
This result is not consistent with previous observations in which drugs induced G2/M arrest
by induction of p21 (Chang et al., 2004; Huang et al., 2011). Taylor et al. (1999) have
suggested that p53 negatively regulates the transcription of cyclin B1 by enhancing the
transcription of Cdk1 inhibitor, such as p21. However, this study demonstrated that HL66
caused a significant increase in cyclin B1 protein expression. Waldman et al. (1996) have
suggested that p21 is required for the precise coordination of the S and M phases. Due to the
absence of p21, cells arrest in a G2-like state and then undergo additional S phases without
intervening normal mitosis (Waldman et al., 1996). Furthermore, the downregulation of the
p21 gene expression and the corresponding protein might induce the brief accumulation of
cells in G2 phase (Mansilla et al., 2006; Su et al., 2011). In our study, p53 and p21 protein
expression was inhibited by HL66 in M21 cells, suggesting that the HL66-induced changes
cells in S phase, might be associated with the downregulation of p53 and p21 protein
expression. The downregulation of Cdk4 and cyclin D1 protein level were also observed after
treatment with HL66 in this study. This result is consistent with previous observations in
which cyclin D1 levels are the major regulator involved in the progression of G1 phase and
continue to accumulate until the G1/S phase boundary when levels rapidly decline (Choi and
Kim, 2008; Onumah et al., 2009). In the G1 checkpoint, cyclin E and their partner Cdk2
regulate cell cycle progression. No significant change in protein expression pattern of cyclins
E was observed in this study. However, expression of Cdk2 markedly increased in a
time-dependent manner in M21 cells at 0.033 μM HL66. This result also suggested that
HL66 is able to induce the degradation of cyclin D1 and increase in Cdk2 expression, leading
to the cell cycle arrest in S phase.
In conclusion, HL66, like vinblastine, is able to inhibit the tubulin polymerization in M21
cells. From our observations of the HL66-induced M21 cell death that were resistant to
apoptosis, we identified mitotic catastrophe with characteristics of large cell with multiple
micronuclei, caspase-independent and cell cycle arrest at S and G2/M phase. Furthermore,
the aberrant expression of the regulatory proteins of cell cycle was involved in HL66-induced
M21 cell death in this study.
We wish to thank Dr. Yi-Yu Wu for her critical reading of the manuscript.
Authorship Contributions
Participated in research design: Lee, Hour and Wu.
Conducted experiments: Lee, Hour, Liu, Leung, Chang and Wu.
Contributed new reagents or analytic tools: Lee, Hour and Wu.
Performed data analysis: Lee, Hour and Wu.
References
Agarwal R and Kaye SB (2003) Ovarian cancer: strategies for overcoming resistance to
chemotherapy. Nat Rev Cancer 3: 502–516.
Brown JM and Attardi LD (2005) The role of apoptosis in cancer development and treatment
response. Nature Rev Cancer 5: 231–237.
Castedo M, Perfettini JL, Roumier T, Andreau K, Medema R and Kroemer G (2004) Cell
death by mitotic catastrophe: A molecular definition. Oncogene 23: 2825–2837.
Chakrabarti A and Chakrabarti S (1987) High yield of micronuclei and micronuclei
premature chromosome condensation in a mouse tumor cell line cultured in vivo with
prearrested mitotic metaphases. Neoplasma 34: 557–562.
Chang KL, Kung ML, Chow NH and Su SJ (2004) Genistein arrests hepatoma cells at G2/M
phase: involvement of ATM activation and upregulation of p21waf1/cip1 and Wee1.
Biochem Pharmacol 67: 717–726.
Cheung CH, Wu SY, Lee TR, Chang CY, Wu JS, Hsieh HP and Chang JY (2011) Cancer
cells acquire mitotic drug resistance properties through beta I-tubulin mutations and
alterations in the expression of beta-tubulin isotypes. PLoS One 5:e12564.
Choi EJ and Kim GH (2008) Daidzein causes cell cycle arrest at the G1 and G2/M phases in
Doyle LA and Ross DD (2003) Multidrug resistance mediated by the breast cancer resistance
protein BCRP (ABCG2). Oncogene 22: 7340–7358.
Furukawa Y, Iwase S, Kikuchi J, Terui Y, Nakamura M, Yamada H, Kano Y and Matsuda M
(2000) Phosphorylation of Bcl-2 protein by CDC2 kinase during G2/M phases and its
role in cell cycle regulation. J Biol Chem 275: 21661–21667.
Gottesman MM, Fojo T and Bates SE (2002) Multidrug resistance in cancer: role of
ATP-dependent transporters. Nat Rev Cancer 2: 48–58.
Haldar S, Basu A and Croce CM (1997) Bcl2 is the guardian of microtubule integrity.
Cancer Res 57: 229–233.
Hamel E, Lin CM, Plowman J, Wang HK, Lee KH and Paull KD (1996) Antitumor
2,3-dihydro-2-(aryl)-4(1H)-quinazolinone derivatives. Interactions with tubulin.
Biochem Pharmacol 51: 53–59.
Heald R, McLoughlin M and McKeon F (1993) Human wee1 maintains mitotic timing by
protecting the nucleus from cytoplasmically activated Cdc2 kinase. Cell 74: 463–474.
Hour MJ, Yang JS, Lien JC, Kuo SC and Huang LJ (2007) Synthesis and cytotoxicity of
6-pyrrolidinyl-2-(2-substituted phenyl)-4-quinazolinones. J Chin Chem Soc 54:
785–790.
YF and Yang JS (2011) Cantharidin induces G2/M phase arrest and apoptosis in human
colorectal cancer colo 205 cells through inhibition of CDK1 activity and
caspase-dependent signaling pathways. Int J Oncol 38: 1067–1073.
Kartalou M and Essigmann JM (2001) Mechanisms of resistance to cisplatin. Mutat Res 478:
23–43.
Ling YH, Tornos C and Perez-Soler R (1998) Phosphorylation of Bcl-2 is a marker of M
phase events and not a determinant of apoptosis. J Biol Chem 273: 18984–18991.
Mansilla S, Priebe W and Portugal J (2006) Mitotic catastrophe results in cell death by
caspase-dependent and caspase-independent mechanisms. Cell Cycle 5: 53–60.
Molz L, Booher R, Young P and Beach D (1989) cdc2 and the regulation of mitosis: six
interacting mcs genes. Genetics 122: 773–782.
Nabha SM, Mohammad RM, Dandashi MH, Coupaye-Gerard B, Aboukameel A, Pettit GR
and Al-Katib AM (2002) Combretastatin-A4 prodrug induces mitotic catastrophe in
chronic lymphocytic leukemia cell line independent of caspase activation and
poly(ADP-ribose) polymerase cleavage. Clin Cancer Res 8: 2735–2741.
Nigg EA (2001) Mitotic kinases as regulators of cell division and its checkpoints. Nat Rev
Mol Cell Biol 2: 21–32.
catalase delays G0/G1- to S-phase transition during cell cycle progression in mouse
aortic endothelial cells. Free Radic Biol Med 46: 1658–1667.
Pathan N, Aime-Sempe C, Kitada S, Haldar S and Reed JC (2001) Microtubule-targeting
drugs induce Bcl-2 phosphorylation and association with Pin1. Neoplasia 3: 70–79.
Peters JM (2002) The anaphase-promoting complex: proteolysis in mitosis and beyond. Mol
Cell 9: 931–943.
Roninson IB, Broude EV and Chang BD (2001) If not apoptosis, then what?
Treatment-induced senescence and mitotic catastrophe in tumor cells. Drug Resist Updat
4: 303–313.
Su M, Chung HY and Li Y (2011) 6-O-Angeloylenolin induced cell-cycle arrest and
apoptosis in human nasopharyngeal cancer cells. Chem Biol Interact 189: 167–176.
Swanson PE, Carroll SB, Zhang XF and Mackey MA (1995) Spontaneous premature
chromosome condensation, micronucleus formation, and non-apoptotic cell death in
heated HeLa S3 cells. Ultrastructural observations Am J Pathol 146: 963–971.
Taylor WR, DePrimo SE, Agarwal A, Agarwal ML, Schönthal AH, Katula KS and Stark GR
(1999) Mechanisms of G2 arrest in response to overexpression of p53. Mol Biol Cell 10:
3607–3622.
mitosis induced by anticancer agents in cells lacking p21. Nature 381: 713–716.
Wang LG, Liu XM, Kreis W and Budman DR (1999) The effect of antimicrotubule agents
on signal transduction pathways of apoptosis: a review. Cancer Chemother Pharmacol
44: 355–361.
Yang JS, Hour MJ, Kuo SC, Huang LJ and Lee MR (2004) Selective induction of G2/M
arrest and apoptosis in HL-60 by a potent anticancer agent, HMJ-38. Anticancer Res 24:
1769–1778.
Yoshikawa R, Kusunoki M, Yanagi H, Noda M, Furuyama JI, Yamamura T and
Hashimoto-Tamaoki T (2001) Dual antitumor effects of 5-fluorouracil on the cell cycle
in colorectal carcinoma cells: a novel target mechanism concept for pharmacokinetic
Foot Notes
This work was supported by National Science Council [Grant NSC
Legends for figures
Fig. 1. Evaluation of cytotoxicity after incubation of M21 cells with HL66. Cells were
incubated with vehicle alone or with 0.01, 0.033 or 0.1 μM HL66 for 4, 8, 16 and 24 h. After
incubation, the viable cells were measured by Trypan blue exclusion assay. The data are
presented as proportional viability (%) by comparing the treated group with the untreated
group, the viability of which was assumed to be 100%. All results are expressed as the mean
percentage of control ± S.D. of triplicate determinations from four independent experiments.
*
P < 0.05, ** P < 0.01, *** P < 0.001 compared to the corresponding control values.
Fig. 2. Effects of HL66 on apoptotic characteristics in M21 cells. (A) Annexin V-FITC/PI
staining of M21 cells. Cells were incubated with 0.1% DMSO or 0.033 μM HL66 for 4, 8, 16
and 24 h. The cells were then processed for annexin V-FITC/PI staining and analyzed with
flow cytometry. (B) HL66 induced phenotypic changes in cell nucleus. M21 cells were
incubated with 0.033 μM HL66 for 4, 8, 16 and 24 h. After being treated with HL66, the cells
were fixed with formaldehyde, permeabilized with Triton X-100 and stained with 1 μg/ml
DAPI for 5 min. The cells were then examined by fluorescence microscopy (300 X). A
phase-contrast image of the cells was also taken. The arrows indicate the large cell with
Fig. 3. (A) Effects of HL66 on the expression of apoptosis-related proteins in M21 cells.
Cells were incubated with vehicle alone or 0.033 μM HL66 for 4, 8, 16 and 24 h. The effect
of HL66 on the protein levels of caspase-2 (Cas-2), caspase-3 (Cas-3), caspase-4 (Cas-4),
caspase-8 (Cas-8), caspase-9 (Cas-9), apoptosis-inducing factor (AIF), cytochrome c (Cyto c),
Bcl-2 and Bax were detected by Western blot analysis. After HL66 treatment, cell lysates
were analyzed by 10% (AIF, caspase-2 and caspase-8), 12% (β-actin), 13% (Bcl-2,
Bcl-2(pS70), caspase-3 and caspase-9) and 14% (Bax, caspase-4 and cytochrome c)
SDS-PAGE, and then probed with primary antibodies as described in Materials and Methods
section. The detection of β-actin was used as an internal control. (B) The effect of 0.033 μM
HL66 on Bax, AIF and cytochrome c translocation in M21 cells. After treatment, cytosolic
and mitochondrial fractions were detected by Western blot analysis. –: control cells; +:
HL66-treated cells. All results are representative of three independent experiments.
Fig. 4. HL66 induced the change in microtubule formation of M21 cells. Cells were
incubated with vehicle alone, 0.033 μM HL66, 0.07 μM paclitaxel or 0.006 μM vinblastine
for 8, 12 and 24 h. To visualize α-tubulin (A), the immunostain of cells was performed with
mouse monoclonal anti-α-tubulin antibody as described in Materials and Methods section. To
detect β-tubulin (B), cells were incubated for 30 min with 250 nM Tubulin TrackerTM Green
representative of three independent experiments.
Fig. 5. HL66 induced cell cycle arrest of M21 cells. Cells were treated with 0.1% DMSO,
0.033 μM HL66, 0.07 μM paclitaxel or 0.006 μM vinblastine for 4, 8, 16 and 24 h. After
treatment, cells were stained with propidium iodide and subjected to cytometric analysis.
Results are representative of three independent experiments.
Fig. 6. Effects of HL66 on the expression of cell cycle regulatory molecules in M21 cells. (A)
The effect of HL66 on the protein levels of cell cycle regulatory molecules were detected by
Western blot analysis. M21 cells were incubated with 0.1% DMSO or 0.033 μM HL66 for 4,
8, 16 and 24 h. Cell lysates were subjected to SDS-PAGE (10% for p53, cyclin A, cyclin B1
and cyclin E; 13% for cyclin D, Cdk1(pT14), Cdk1(pY15), Cdk1, Cdk2 and Cdk4; 14% for
p21), and then probed with primary antibodies as described in Materials and Methods
section. –: control cells; +: HL66-treated cells. (B) The effect of HL66 on the localization of
cyclin B1 and Cdk1 protein in M21 cells. Cells were incubated with 0.1% DMSO or 0.033
μM HL66 for 12 h. After treatment, cells were fixed and stained with isozyme-specific antibodies as described in Materials and Methods section. The specimens were observed by
Table 1. Effects of HL66 on cytotoxicity of M21, A375.S2, A431, CH27, HSC-3 and
Hep3B cells
Cell lines IC50 (μM)
M21 (human malignant melanoma) 0.033 ± 0.005
A375.S2 (human malignant melanoma) 0.043 ± 0.004
A431 (human epidermoid carcinoma) 0.083 ± 0.010
CH27 (human lung cancer cell line) 0.053 ± 0.006
HSC-3 (human oral cancer cell line) 0.041 ± 0.003
Hep3B (human liver cancer cell line) 1.350 ± 0.122
Cells were treated with HL66 for 24 h. After incubation, the viable cells were measured by
Trypan blue exclusion assay. The IC50 (half maximal inhibitory concentration) value of
HL66 was determined from dose-response curve. All results are expressed as the mean
percentage of control ± S.D. of triplicate determinations from four independent
Table 2. Effects of HL66 on the phenotypic changes in cell nucleus of M21 cells
Hours
Multiple micronuclei cell numbers (% of total population)
Control (0.1% DMSO) HL66 (0.033 μM)
4 h 0 2.1 ± 0.2
8 h 0 2.9 ± 0.2
16 h 0 28.2 ± 1.8
24 h 0 36.9 ± 2.8
Cells were incubated with 0.1% DMSO or 0.033 μM HL66 for 4, 8, 16 and 24 h. For
quantitative image analysis samples were stained with DAPI, followed by examination
with an Olympus IX 70 microscope at magnification of 10X. The field of cells was
examined and photographed. For each sample four fields of view were selected randomly.
All cells, which contain single or multiple micronuclei, were counted in the entire field. All
results are expressed as the mean percentage of total population ± S.D. of triplicate
Table 3. Effect of HL66 on the distribution of cells in phases of the cell cycle of M21
cells
Hours
Sub-G1 (% of total population) Cell cycle distribution (% of control)
Control HL66 G0/G1 S G2/M 4 h 8 h 16 h 24 h 1.4 ± 0.3 1.0 ± 0.1 1.1 ± 0.1 1.5 ± 0.5 2.7 ± 0.3 3.5 ± 0.2 17.8 ± 3.5 21.6 ± 3.1 89.2 ± 4.9 50.7 ± 10.4 21.5 ± 9.5 20.9 ± 3.7 104.7 ± 2.4 123.2 ± 5.4 123.3 ± 14.6 128.2 ± 7.5 127.3 ± 11.8 144.3 ± 3.5 306.3 ± 23.6 306.6 ± 14.1
Cells were incubated with 0.1% DMSO or 0.033 μM HL66 for 4, 8, 16 and 24 h. After
treatment, cells were stained with propidium iodide and subjected to cytometric analysis. All
results of cell cycle distribution are expressed as the mean percentage of control ± S.D. of
Table 4. Densitometric analysis of the Western blot results of cell cycle-related proteins
Intensity (% of control)
Hours Cdk1 Cdk2 Cdk4 Cdk1(pT14) Cdk1(pY15) cyclin B1 cyclin A cyclin D cyclin E p53 p21 β-actin
4 h 8 h 16 h 24 h 107 ± 8 96 ± 10 100 ± 4 107 ± 7 129 ± 6 161 ± 9 188 ± 8 185 ± 5 78 ± 5 80 ± 7 59 ± 4 54 ± 10 211 ± 9 249 ± 6 237 ± 10 200 ± 11 317 ± 12 464 ± 8 557 ± 13 155 ± 9 168 ± 7 137 ± 5 135 ± 8 127 ± 3 91 ± 5 69 ± 6 67 ± 7 34 ± 9 86 ± 8 60 ± 9 20 ± 12 35 ± 10 124 ± 9 60 ± 8 79 ± 6 109 ± 11 111 ± 4 113 ± 3 104 ± 6 67 ± 7 61 ± 5 59 ± 7 75 ± 9 65 ± 7 97 ± 7 98 ± 5 95 ± 7 104 ± 9
The degree of protein expression was quantified by AlphaEase image software. Data are plotted as
the mean percentage of the relative control ± S.D. All results are representative of three independent