The Effect of Hospital Volume on Patient Outcomes in Severe Acute Pancreatitis Hsiu-Nien Shen1,3, MD; Chin-Li Lu2,3, MS; Chung-Yi Li, PhD3,4
1 Department of Intensive Care Medicine, Chi Mei Medical Center, No. 901 Chung-Hwa Road, Yong-Kang City, Tainan, Taiwan.
2 Department of Medical Research, Chi Mei Medical Center, No. 901 Chung-Hwa Road, Yong-Kang City, Tainan, Taiwan.
3 Department of Public Health, College of Medicine, National Cheng Kung University, Tainan, Taiwan.
4 Department of Public Health, College of Public Health, China Medical University, Taichung, Taiwan.
Correspondence address to: Chung-Yi Li, PhD
Professor
Department and Graduate Institute of Public Health College of Medicine
National Cheng Kung University #1, University Rd., Tainan 701, Taiwan
TEL: 886-6-2353535 ext. 5862, FAX: 886-6-2359033 E-mail:
HNS: [email protected] CLL: [email protected] CYL: [email protected]
ABSTRACT
Introduction Background: We aimed to investigate the hospital volume-outcome
relationship in patients with severe acute pancreatitis (SAP), which is important because patient outcomes may be improved by volume-based selective referral.
Methods: In this cohort study, we analyzed 22,551 patients with SAP in 2,208
hospital-years from Taiwan’s National Health Insurance Research Database between 20002009. Primary outcome was hospital mortality. Secondary outcomes were hospital length of stay and charges. Hospital SAP volume was measured both as a categorical and as a continuous variable (per one case increase per hospital-year); and the effect of which was assessed using multivariable logistic regression models with generalized estimating equations accounting for hospital clustering effect. Adjusted covariates included patient and hospital characteristics (model 1) and additional treatment variables (model 2).
Results: Increasing hospital volume, irrespective of the measurements, was associated with
a reduced risk of hospital mortality after adjusting for patient and hospital characteristics (model 1: adjusted odds ratio [OR] 0.995, 95% confidence interval [CI] 0.993-0.998 for per one case increase). Patients treated in the highest volume quartile (≥14 cases per hospital-year) had a 42% lower risk of hospital mortality than those in the lowest volume quartile (1 case per hospital-year) after adjusting for patient and hospital characteristics (adjusted OR 0.58, 95% CI 0.40-0.83). However, an inverse relationship between volume and hospital
stay or hospital charges was observed only when volume was analyzed as a categorical variable. After adjusting for treatment covariates, the volume effect on hospital mortality disappeared irrespective of the volume measures.
Conclusions: These findings support volume-based selective referral for patients with SAP
and suggest that differences in levels or processes of care across hospitals may have contributed to the volume effect.
INTRODUCTION BACKGROUND
The performance of a hospital has been linked to hospital volume of various surgical procedures and medical conditions [1-6]. In general, high-volume hospitals are shown to be more efficient and have better outcomes than are low-volume ones. Documentation of the volume-outcome relationship is important because patient outcomes may be improved by
volume-based selective referral [1, 3].
An inverse volume-outcome relationship has been shown in patients with acute pancreatitis (AP) [5, 6]; however, prior studies suffered from shortcomings that may have overestimated the volume effect and limited the generalization of their findings [5-7]. These shortcomings included failure to exclude readmissions or recurrences [5, 6], failure to consider severity of AP [5], failure to account for hospital clustering effect [6] and failure to model hospital volume as a continuous variable [5, 6, 8, 9]. Besides, the definitions of high volume hospitals differed considerably between the studies (≥118 cases/year vs. >16 cases/9 months) [5, 6], limiting the practical application of the results. Moreover, the inclusion of both mild and severe cases in these studies [5, 6] implies that the results would be generalized to all AP patients. This is unreasonable because selective referral would not be justified for mild, self-limited disease such as mild AP [10, 11]. Therefore, we conducted this study and enrolled only severe cases from a national cohort of patients with first-attack
METHODS Database
Patients were drawn from the Taiwan National Health Insurance Research Database (NHIRD), which is released for research purposes by the National Health Research Institute and is one of the largest and most comprehensive databases in the world [12, 13]. Information included in the inpatient database incorporated sex, date of birth, encrypted patient identification numbers, residential or work area, dates of admission and discharge, medical institutions providing the services, the International Classification of Diseases, Ninth Revision, Clinical Modification (ICD-9-CM) codes of diagnoses (up to five) and procedures (up to five), outcome at hospital discharge (recovered, died or transferred out), order codes and hospital charges. The study was exempt from obtaining approval from the Human Subjects Institutional Review Board and informed consent from the patients due to the use of an encrypted administrative database.
Definitions and Patients
AP was defined by ICD-9-CM code 577.0 in any position of the five diagnoses [12]. SAP was defined primarily according to the Atlanta classification scheme [14], but modified by the presence of intensive care unit (ICU) admission (as a surrogate of acute physiology and chronic health evaluation [APACHE] II score ≥8), organ dysfunction or failure, gastrointestinal bleeding or local complications [12, 13]. The enrollment of the patients is shown in Figure 1. We excluded patients (n=1,414) with biliary AP who received
cholecystectomy and intensive care and had no organ failure, gastrointestinal bleeding or local complications because these patients might have mild biliary AP and receive an ICU care only after the surgery [12]. After exclusion, we enrolled 22,551 patients in the following analysis.
Exposure variable
Annual number of SAP cases per hospital was the main exposure variable. The distribution of hospital volume versus hospital mortality per hospital-year is shown in Figure 2.
We first measured hospital volume as a continuous variable (per 1 case increase per hospital-year) to assess the effect of hospital volume on outcomes [8]. Then, the hospital volume was sorted and divided into 4 and 9 about-equal subsets, respectively, to help visualize the effect of increasing volume and for practical uses. The quartile ranges were 1, 25, 613 and ≥14 SAP cases per hospital-year, respectively. The 9-quantile ranges were 1, 2, 3, 4-5, 6-8, 9-12, 13-19, 20-33, ≥34 SAP cases per hospital-year, respectively. Patients were allocated essentially in decentile except the two extremes due to the skewed nature of the volume that the proportions of categories with 1 and 34+ cases per hospital-year deviated from the mean of the central subsets. The quartiles were used for both presentation and comparison of the results and the 9-quantiles were used primarily to depict the trend of volume effect on hospital mortality.
Covariates
covariates were patient and hospital characteristics. The patient characteristics included age, sex, year of admission, urbanization (including urban, suburban and rural area) [15], Charlson comorbidity index [16, 17], and causes (including biliary, alcohol-related, both or others) and severity criteria of AP.
The hospital characteristics included hospital level (including medical center [>500 beds], regional [250–500 beds] and district hospitals [20–249 beds]) [13], hospital ownership (including public, private not-for-profit, or private for-profit) [18] and
geographical location (northern, central, southern, and eastern Taiwan).
Additional covariates were employed to account for the process of care and included the following selected treatments: cholecystectomy and life-support measures (including total parenteral nutrition [TPN], hemodialysis, vasopressors and mechanical ventilation
[MV]) [12]. Outcomes
Primary outcome was hospital mortality [12]. Secondary outcomes were hospital charges and hospital length of stay (LOS). Charges were adjusted to 2009 price level in United States Dollars (USD) [12].
Statistics
Data were analyzed with SAS software, version 9.1 (SAS Institute, Inc., Cary, NC, USA). Continuous variables are presented as median (interquartile range, IQR); discrete ones as
We hypothesized that hospital volume is inversely associated with hospital LOS, charges and mortality. We assumed that the relationship is linear. In the univariate analysis, we performed ANOVA test for linearity of scaled variables and linear-by-linear association Chi-square test for categorical data. To account for clustering, the effect of hospital volume was analyzed using regression model with generalized estimating equations methods [1819], specifying an exchangeable structure of a working correlation matrix, to construct regression models. Hospital mortality was regressed with a logit link function and hospital LOS and charges were log-transformed and then regressed with a linear link function on hospital volume. Both univariable and multivariable analyses were performed to yield the crude and adjusted estimates. In the multivariable analysis, we performed two consecutive models adjusting for the baseline covariates in model 1 and for the baseline and additional covariates in model 2. We examined the volume effect first using hospital volume as a continuous variable and then using it as a categorical one as aforementioned. The effects of hospital volume are presented as odds ratios (OR) with 95% confidence interval (CI) for hospital mortality and as percentage changes with 95% CI, which were calculated by exponentiated regression coefficients minus 1 [1920], for hospital LOS and charges. Model performance was assessed through R-squared and c statistics. The variance of outcomes explained by hospital volume was assessed and compared to that by other covariates using the coefficient of determination (r2) for hospital LOS and charges and by the percentage
change of -2 log likelihood (-2LL) for hospital mortality, respectively. The change of -2LL (%) was calculated by dividing the difference in -2LL values between univariable and the intercept-only models by the corresponding value of the intercept-only model. The r2 was
derived from the univariable linear regression model. We examined the estimated slope coefficients and standard errors of the mean and found no indication of collinearity.
RESULTS Hospital and patient characteristics
Table 1 shows characteristics of the patients with SAP. Hospital volume was correlated with hospital level, ownership and geographic location. Lower quartile hospitals tended to be at the district level, private-for-profit ownership and located in the southern Taiwan, whereas higher quartile ones to be at the regional or center level, public or private not-for-profit
ownership and located in the north.
More than two-thirds of the patients were treated in the highest quartile hospitals and the proportion increased over time. With increasing hospital volume, patients tended to be older and less male-predominance, to live in urban areas and to have more complex comorbidities (Charlson-Comorbidity Index ≥3) and biliary causes. Among severity criteria of AP, organ failure was the most common, but the distributional pattern of individual severity criteria differed. As hospital volume increased, the prevalence fell in gastrointestinal bleeding, but increased in ICU admission, organ failure and local complication.
There were more patients receiving TPN, vasopressors, hemodialysis and MV in higher volume hospitals. Cholecystectomy was rarely performed in SAP and tended to be
done in higher volume hospitals.
Hospital volume-outcome relationship
hospital volume. Similar trend was also observed for hospital mortality except that the mortality slightly fell in the second volume quartile (Table 1).
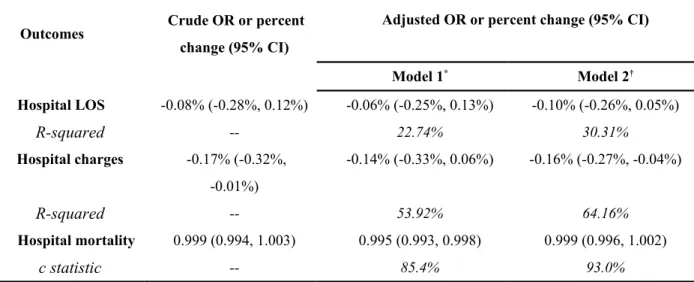
When hospital volume was entered into the regression models as a continuous variable (Table 2), the unadjusted effect of volume on hospital mortality was not statistically significant. Model 1 shows that hospital volume was inversely associated with hospital mortality. After controlling for additional treatment-related covariates, the volume effect on hospital mortality attenuated and became insignificant (Model 2). Volume, as a continuous variable, appeared to have no effect on hospital LOS, whereas it was inversely associated with a lower hospital charges in the unadjusted and fully adjusted models.
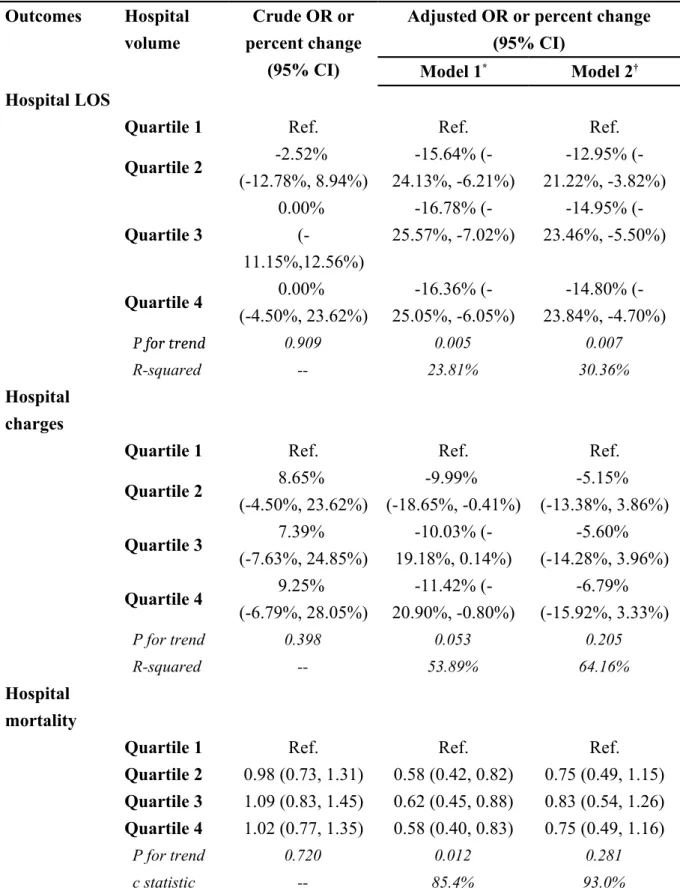
When hospital volume was entered into the regression models as a categorical variable (Table 3), results of volume effect on hospital mortality were similar to those modeled using volume as a continuous one. Compared to the lowest quartile hospitals, SAP patients treated in higher volume ones had a nearly 40% lower risk of hospital mortality (Model 1). The volume effect became insignificant when differences in treatment among volume quartiles were controlled for. When hospital volume was divided into 9 about-equal subsets, the effect of volume on hospital mortality appeared to plateau at ≥3 SAP cases per year (Figure 3). However, regarding hospital LOS and charges, results differed from those using volume as a continuous variable. For example, compared to the lowest quartile hospitals, patients treated in higher volume ones had a shorter hospital stay after controlling for the baseline
covariates (Model 1). The volume effect on hospital LOS attenuated but persisted after additional adjustment of the treatment covariates (Model 2). Conversely, the volume effect on hospital charges was significant only after controlling for the baseline covariates (Model
1).
Variances of outcomes explained by various variables are shown in Figure 4. The size of effect from hospital volume was greater on hospital mortality than on hospital LOS and charges. Despite that, the effect size associated with hospital volume on various outcomes
DISCUSSION
In this study, we found that hospital SAP volume, either as a continuous variable or as a categorical one, was inversely associated with hospital mortality after controlling for the baseline covariates. The volume effect disappeared when differences in treatment among hospitals were controlled for, suggesting that the effect could be largely explained by the different levels or processes of care across hospitals. Although results on hospital LOS and charges were somewhat dependent on the definition of volume measures, trend analyses suggested that higher hospital volume appeared to be associated with a shorter
stay and a lower cost.
We found that SAP patients treated in higher volume hospitals had a nearly 40% lower risk of hospital mortality than the lowest volume quartile ones. A recent report from Japan showed an even greater risk reduction in high volume hospitals [6]. In the report, Murata and coworkers [6] analyzed 7,007 patients with AP, including 662 severe cases, in 776 hospitals recruited over a 9-month period and found that in-hospital mortality (within 30 days) was about 66% lower for severe cases in high volume hospitals (defined as >16 AP cases) than in low volume ones (<10 AP cases). If they had limited the analysis to the volume of SAP cases and extended the study period to one year, the cutoff point for the lowest volume category (about 1 SAP case/year) would be very close to ours. However, in addition to having a relatively small sample size, they also failed to
exclude readmissions or recurrences of AP and did not account for hospital clustering effect in the analysis; therefore, the effects are likely to be overinflated [2021]. Besides, they defined SAP only as a dichotomous variable, which may limit the severity adjustment. Moreover, similar to an earlier study in the United States [5], they also included both mild and severe cases in the analysis, which implies that volume-based selective referral, if adopted, would be applied to all patients with AP. However, because of some potential disadvantages of the volume-based policy [11], we believe that selective referral should be limited to high risk patients, such as SAP cases. It is unreasonable to transfer to a distant high-volume hospital for a mild AP patient who would recover within several days without a need of specific treatment other than simple
supportive care [10].
The beneficial effects associated with high hospital SAP volume are likely related to the overall experience of the health care team, processes of care and some organizational features including availability of specialists, interventions and intensive care for complicated cases [5, 11, 2122]. We found that the volume effect in SAP patients disappeared after additional adjustment of cholecystectomy and life-support measures, indicating that different levels or processes of care may have contributed to the observed effect. This finding is interesting and novel because previous studies did not take account of the variation of treatment regimens across hospitals [5, 6], which may be a probable
mechanism responsible for the observed relationship between volume and outcomes. High volume hospitals are likely to have more specialists, interventions, and advanced intensive cares that are critical in saving lives of pancreatitis patients. Besides, we found that hospital mortality plateaued at ≥3 cases/year, suggesting a possible threshold effect of hospital volume on SAP outcome. The threshold effect may also be responsible for the insignificant associations of hospital volume, as continuous variable, with hospital LOS and charges. Because the number of cases per year is within the margin of error of other values (Figure 3), the threshold value requires further validation.
This study has important implications on the health policy and future research for the treatments of pancreatitis in Taiwan. Our recent study shows that hospital charges per patient with acute pancreatitis in Taiwan increased by nearly 50% from 2000 to 2009 [12]. Most of the increase is likely due to a lack of formal referral system and an improper reimbursement policy. In Taiwan, reimbursement for some services (e.g., physician staffing and ICU bed) increases with hospital level, which has promoted the growth of higher level hospitals out of the proportion to lower level ones [23]. As a result, patients with mild pancreatitis who can be treated properly in lower level hospitals usually seek medical care in higher level ones, leading to an overall higher cost of health care for pancreatitis. The reimbursement policy may also help explain why hospital volume did not affect hospital charges in this study because most hospitals with lower
quartile volumes were lower level hospitals (i.e., district hospitals) and most of the hospitals with higher quartile volumes were at higher levels (i.e., regional hospitals or medical centers). Findings in this study support a need for a better referral system that can limit the access of patients with mild pancreatitis and transfer severe cases to high-volume hospitals in Taiwan, which may in turn lead to appropriate reallocation of the medical resources. However, further research is needed to examine the outcome of transfer and the cost-effectiveness of the volume-based selective referral.
Some limitations deserve comments. First, the definition of SAP in this study tended to include patients who had a more severe attack and received intensive care and/or invasive treatments. For example, some patients might not be included if they had an APACHE II score ≥8 but were cared for only outside an ICU or if they had local complications but did not receive invasive procedures. Besides, some patients with organ failure may also be missed because of limited number of diagnostic codes. However, the selection of a more severe group of patients is non-differential among hospitals, which tends to bias the observed effect towards the null. Second, residual confounding may be present because there might be a lack of an adequate adjustment for potential confounders, which is especially true for biliary and alcohol-related AP. The potential bias arising from residual confounding is however uncertain. Finally, generalizability of the findings may be limited by the different prevalence of causes in other regions of the world because the
hospital volume outcome relationship may be more important for biliary causes (e.g., expertise in ERCP) of pancreatitis as compared to alcoholic causes.
CONCLUSIONS
The results of this study support volume-based selective referral for patients with SAP. The volume threshold is rather low (i.e., 3 cases/year) and would not pose a significant case load for the current high volume hospitals. Outcomes of transfer of SAP patients to
high volume hospitals and its cost-effectiveness require further research.
Key Messages
The performance of a hospital has been linked to hospital volume of various surgical procedures and medical conditions.
Documentation of the volume-outcome relationship is important because patient outcomes may be improved by volume-based selective referral.
We found that SAP patients treated in higher volume hospitals had a nearly 40% lower risk of hospital mortality than the lowest volume quartile ones.
However, an inverse relationship between volume and hospital stay or hospital charges was observed only when volume was analyzed as a categorical variable.
suggest that differences in levels or processes of care across hospitals may have contributed to the volume effect.
Abbreviations
-2LL: -2 log likelihood AP: Acute pancreatitis
APACHE II score: acute physiology and chronic health evaluation II score CI: Confidence interval
ICD-9-CM: International Classification of Diseases, Ninth Revision, Clinical Modification ICU: Intensive care unit
IQR: interquartile range LOS: Length of stay
MV: Mechanical ventilation OR: Odds ratio
NHIRD: National Health Insurance Research Database SAP: Severe acute pancreatitis
TPN: Total parenteral nutrition USD: United States Dollar
Competing interests
Shen HN has no conflicts of interest to disclose. Lu CL has no conflicts of interest to disclose. Li CY has no conflicts of interest to disclose.
The authors declare that they have no competing interests. Authors' contributions
HNS designed the study, obtained funding, performed data mining and processing, did statistical analyses, drafted the initial manuscript, and revised important content. CLL contributed to the study design, data mining and processing, analyses and interpretation of results, and revision for important content. CYL participated in the interpretation of results and revision for important content. All authors read and approved the final manuscript.
Acknowledgments
The study was performed in Chi Mei Medical Center and supported by grants
CMFHR10025 and CMFHR10136 from the hospital. The study was based in part on data from the National Health Insurance Research Database provided by the Bureau of National
Health Insurance, Department of Health and managed by National Health Research Institutes. The interpretation and conclusions contained herein do not represent those of Bureau of National Health Insurance, Department of Health or National Health Research Institutes.
REFERENCES
1. Epstein AM: Volume and outcome--it is time to move ahead. N Engl J Med 2002, 346:1161-1164.
2. Halm EA, Lee C, Chassin MR: Is volume related to outcome in health care? A systematic review and methodologic critique of the literature. Ann Intern Med 2002, 137:511-520.
3. Kahn JM, Linde-Zwirble WT, Wunsch H, Barnato AE, Iwashyna TJ, Roberts MS, Lave JR, Angus DC: Potential value of regionalized intensive care for
mechanically ventilated medical patients. Am J Respir Crit Care Med 2008, 177:285-291.
4. Glance LG, Li Y, Osler TM, Dick A, Mukamel DB: Impact of patient volume on the mortality rate of adult intensive care unit patients. Crit Care Med 2006, 34:1925-1934.
5. Singla A, Simons J, Li YF, Csikesz NG, Ng SC, Tseng JF, Shah SA: Admission volume determines outcome for patients with acute pancreatitis.
Gastroenterology 2009, 137:1995-2001.
6. Murata A, Matsuda S, Mayumi T, Yokoe M, Kuwabara K, Ichimiya Y, Fujino Y, Kubo T, Fujimori K, Horiguchi H: Effect of Hhospital Vvolume on Cclinical Ooutcome in Ppatients Wwith Aacute Ppancreatitis, Bbased on a Nnational
7. Wu BU: The impact of hospital volume on outcomes in acute pancreatitis: a case for centers of excellence? Gastroenterology 2009, 137:1886-1888.
8. Livingston EH, Cao J: Procedure volume as a predictor of surgical outcomes. JAMA 2010, 304:95-97.
9. Altman DG, Lausen B, Sauerbrei W, Schumacher M: Dangers of using "optimal" cutpoints in the evaluation of prognostic factors. J Natl Cancer Inst 1994,
86:829-835.
10. Banks PA, Freeman ML: Practice guidelines in acute pancreatitis. Am J Gastroenterol 2006, 101:2379-2400.
11. Shahian DM, Normand SL: The volume-outcome relationship: from Luft to Leapfrog. Ann Thorac Surg 2003, 75:1048-1058.
12. Shen HN, Lu CL, Li CY: Epidemiology of first-attack acute pancreatitis in Taiwan from 2000 through 2009: a nationwide population-based study. Pancreas (publish ahead of print) 2012. DOI: 10.1097/MPA.0b013e31823db941. 13. Shen HN, Lu CL: Incidence, resource use, and outcome of acute pancreatitis
with/without intensive care: a nationwide population-based study in Taiwan. Pancreas 2011, 40:10-15.
14. Bradley EL, 3rd: A clinically based classification system for acute pancreatitis. Summary of the International Symposium on Acute Pancreatitis, Atlanta, Ga,
15. Liu C, Hung Y, Chuang Y, Chen YJ, Weng WS, Liu JS, Liang KY: Incorporating development stratification of Taiwan townships into sampling design of large scale health interview survey. J Health Manag 2006, 4:1-22.
16. Charlson ME, Pompei P, Ales KL, MacKenzie CR: A new method of classifying prognostic comorbidity in longitudinal studies: development and validation. J Chronic Dis 1987, 40:373-383.
17. Deyo RA, Cherkin DC, Ciol MA: Adapting a clinical comorbidity index for use with ICD-9-CM administrative databases. J Clin Epidemiol 1992, 45:613-619. 18. Kuo JS, Ho YC: Board composition and community benefit expenditures of
nonprofit hospitals. [http://nccur.lib.nccu.edu.tw/handle/140.119/41790]
1819. Hanley JA, Negassa A, Edwardes MD, Forrester JE: Statistical analysis of correlated data using generalized estimating equations: an orientation. Am J
Epidemiol 2003, 157:364-375.
1920. Flanders WD, DerSimonian R, Freedman DS: Interpretation of linear regression models that include transformations or interaction terms. Ann Epidemiol 1992, 2:735-744.
2021. Panageas KS, Schrag D, Riedel E, Bach PB, Begg CB: The effect of clustering of outcomes on the association of procedure volume and surgical outcomes. Ann
Intern Med 2003, 139:658-665.
effect of process and outcomes measures. Surgery 2004, 135:569-575. 23. Bureau of National Health Insurance, Department of Health, Executive Yuan.
[http://www.nhi.gov.tw/webdata/webdata.aspx?
menu=17&menu_id=661&WD_ID=689&webdata_id=3351]
FIGURE LEGENDS Figure 1
Study flow diagram
(Note: Patients hospitalized for AP between 1996 and 1999 were excluded to ensure the inclusion of first-attack cases because most relapses occur within the first 4 years after the
first attack.) Figure 2
Distribution of hospital volume versus hospital mortality per hospital-year in severe acute pancreatitis (Note: There were 467 hospitals contributing to a total of 2,208 hospital-years.
Median hospital volume was 5 cases per hospital-year [interquartile range 213]).
Figure 3
Effect of hospital volume on hospital mortality in severe acute pancreatitis adjusting for patient and hospital characteristics (Note: Hospital volume was divided into 9 about-equal subsets).
Figure 4
Variances of outcomes (A: hospital mortality, B: hospital length of stay, C: hospital charges) explained by various variables (MV: mechanical ventilation; TPN: total parenteral
nutrition; AP: acute pancreatitis)
Table 1 Characteristics of hospitals and patients with severe acute pancreatitis (n=22,551)
Variables
Hospital volume quartiles (by case No. per hospital-year)
P value s for trend 1 2-5 6-13 14+ Hospital characteristics No. of hospital-years 486 679 514 529 No. of hospitals 276 261 165 104 Hospital level, % <0.00 1 Medical center 0 0.5 5.0 39.1
Regional hospital 4.5 16.8 46.7 48.1 District hospital 95.5 82.7 48.3 12.8 Hospital ownership, % <0.00 1 Private (for-profit) 70.3 53.2 32.9 17.8 Private (not-for-profit)* 10.8 17.6 33.9 50.7 Public 18.9 29.2 33.2 31.5 Geographic location, % <0.00 1 Northern 24.5 36.2 39.6 37.4 Central 29.8 26.5 28.4 28.3 Southern 39.7 32.4 25.1 29.5 Eastern 6.0 4.9 6.9 4.7
Patient No. by year of admission <0.00 1 2000-2001 129 578 929 2150 2002-2003 102 410 1037 2689 2004-2005 95 400 953 3520 2006-2007 89 379 873 3544 2008-2009 71 338 803 3462 Patient characteristics
Median age (IQR), yr 50
(38-70) 52 (39-72) 54 (41-73) 57 (42-73) <0.00 1 Male sex, % 75.1 72.4 68.0 64.9 <0.00 1 Urbanization, % 0.039 Urban 45.8 49.8 49.9 50.8 Suburban 37.7 34.6 35.7 34.6 Rural 16.6 15.6 14.3 14.6
Charlson Comorbid Index, % 0.688 0 15.6 20.6 21.1 24.9 1 47.1 42.9 42.8 37.0 2 24.9 23.4 20.8 21.5 ≥3 12.3 13.1 15.3 16.5 Causes, % <0.00 1
Biliary stone 10.3 15.0 16.6 17.1 Alcohol abuse 4.1 3.5 4.0 4.1 Severity criteria ICU admission 24.5 37.1 45.4 49.7 <0.00 1 Organ failure 48.4 51.6 52.2 60.1 <0.00 1 Gastrointestinal bleeding 42.2 37.5 33.2 27.5 <0.00 1 Local complications 3.7 4.2 7.1 7.0 <0.00 1 Treatments, % Cholecystectomy*† 1.0 1.0 1.6 1.9 0.001
Total parenteral nutrition
1.9 2.7 6.7 12.7 <0.00 1 Vasopressors 14.8 18.2 21.3 26.1 <0.00 1 Hemodialysis 4.5 4.2 7.4 9.7 <0.00 1 Mechanical ventilation 17.5 18.2 22.4 30.0 <0.00 1 Median hospital LOS (IQR), d 6
(4-13) 7 (3-13) 8 (4-16) 10 (5-20) <0.00 1 Median hospital charges
(IQR), USD 515 (284-1736) 713 (354-1845) 1069 (510-2814) 1715 (713-4619) 0.044 Hospital mortality, % 12.8 12.2 14.2 16.6 <0.00 1 IQR: interquartile range; ICU: intensive care unit; LOS: length of stay; USD: United States dollars.
* A private not-for-profit hospital is a tax-exempt, commercial and entrepreneurial organization, which operates roughly in the same way with a private for-profit hospital
except the difference in missions and goals on providing community benefit services [18].
Table 2 Effects of hospital volume (as a continuous variable) on outcomes in patients with severe acute pancreatitis (n=22,551)
Outcomes Crude OR or percent
change (95% CI)
Adjusted OR or percent change (95% CI)
Model 1* Model 2† Hospital LOS -0.08% (-0.28%, 0.12%) -0.06% (-0.25%, 0.13%) -0.10% (-0.26%, 0.05%) R-squared -- 22.74% 30.31% Hospital charges -0.17% (-0.32%, -0.01%) -0.14% (-0.33%, 0.06%) -0.16% (-0.27%, -0.04%) R-squared -- 53.92% 64.16% Hospital mortality 0.999 (0.994, 1.003) 0.995 (0.993, 0.998) 0.999 (0.996, 1.002) c statistic -- 85.4% 93.0%
OR: odds ratio; CI: confidence interval; LOS: length of stay.
* Covariates in model 1 included age (as a continuous variable), sex, year of admission, Charlson-Comorbidity Index (categorized as 0,1,2 and ≥3), urbanization, hospital level, the ownership of hospital, the region of hospital, causes of acute pancreatitis (categorized into biliary, alcohol-related, both or others), intensive care unit admission, organ failure, gastrointestinal bleeding and local complication.
† Model 2 enrolled all covariates of model 1 and additional treatment covariates, including cholecystectomy, total parenteral nutrition, vasopressors, hemodialysis and mechanical
Table 3 Effects of hospital volume (as a categorical variable) on outcomes in patients with severe acute pancreatitis (n=22,551)
Outcomes Hospital volume
Crude OR or percent change
(95% CI)
Adjusted OR or percent change (95% CI)
Model 1* Model 2†
Hospital LOS
Quartile 1 Ref. Ref. Ref.
Quartile 2 -2.52% (-12.78%, 8.94%) -15.64% (-24.13%, -6.21%) -12.95% (-21.22%, -3.82%) Quartile 3 0.00% (-11.15%,12.56%) -16.78% (-25.57%, -7.02%) -14.95% (-23.46%, -5.50%) Quartile 4 0.00% (-4.50%, 23.62%) -16.36% (-25.05%, -6.05%) -14.80% (-23.84%, -4.70%) P for trend 0.909 0.005 0.007 R-squared -- 23.81% 30.36% Hospital charges
Quartile 1 Ref. Ref. Ref.
Quartile 2 8.65% (-4.50%, 23.62%) -9.99% (-18.65%, -0.41%) -5.15% (-13.38%, 3.86%) Quartile 3 7.39% (-7.63%, 24.85%) -10.03% (-19.18%, 0.14%) -5.60% (-14.28%, 3.96%) Quartile 4 9.25% (-6.79%, 28.05%) -11.42% (-20.90%, -0.80%) -6.79% (-15.92%, 3.33%) P for trend 0.398 0.053 0.205 R-squared -- 53.89% 64.16% Hospital mortality
Quartile 1 Ref. Ref. Ref.
Quartile 2 0.98 (0.73, 1.31) 0.58 (0.42, 0.82) 0.75 (0.49, 1.15) Quartile 3 1.09 (0.83, 1.45) 0.62 (0.45, 0.88) 0.83 (0.54, 1.26) Quartile 4 1.02 (0.77, 1.35) 0.58 (0.40, 0.83) 0.75 (0.49, 1.16)
P for trend 0.720 0.012 0.281
c statistic -- 85.4% 93.0%
OR: odds ratio; CI: confidence interval; LOS: length of stay.
Charlson-Comorbidity Index (categorized as 0,1,2 and ≥3), urbanization, hospital level, the ownership of hospital, the region of hospital, causes of acute pancreatitis (categorized into biliary, alcohol-related, both or others), intensive care unit admission, organ failure, gastrointestinal bleeding and local complication.
† Model 2 enrolled all covariates of model 1 and additional treatment covariates, including cholecystectomy, total parenteral nutrition, vasopressors, hemodialysis and mechanical ventilation.