CHIXESE JOURNAL OF PHYSICS VOL. 37, NO. 4 AUGUST 1999
Dynamic Pulse Buildup in Continuous-Wave Passively Mode-Locked
Picosecond Ti: Sapphire/DDI and Ti: Sapphire/IR140 Lasers
Ci-Ling Pan, Nen-Wen Pu, and Jia-Min Shieh
Institute of ElectTo-optical Engineering, National Chiao Tung University, Hsinchu, Taiwan 300, R.O.C.
(Received February 23, 1999)
We have studied both theoretically and experimentally the buildup of mode-locked pulses out of noise in continuous wave (cw) passively mode-locked Ti: sapphire lasers with DDI and IR140 dye saturable absorbers, which have significantly different optical properties. The evolution of the laser output from cw, to partial mode-locking, to complete mode-locking was investigated experimentally by measuring the contrast ratio of transient autocorrelation trace, the second-harmonic-generation (SHG) conversion efficiency, the fractional energy, optical and radio frequency (RF) spectra at consecutive delay times using the time-gating technique. Theoretically, we have simulated the pulse buildup numerically by adopting the two-level model for the saturable absorber. The experimental results are in good agreement with the predictions of numerical simulation. PACS. 42.55.R~ - Doped-insulator lasers and other solid state lasers.
PACS. 42.60.F~ - Modulation, tuning, and mode locking. I. Introduction
The solid-state nature, high saturation power, excellent thermal, mechanical and op-tical properties, as well as broad bandwidth of the Ti: sapphire crystal have allowed it to become one of the most important laser materials for the generation and amplification of ultra-short optical pulses [l]. In the past decade: various mode-locking methods, some of them proposed and demonstrated for the first time, e.g., Kerr-lens mode-locking (KLM) [2]? additive pnlse mode-locking (APM) [3], and resonant passive mode-locking (RPM) [4], have been reported for the Ti: sapphire laser. Among them, passive mode locking using organic dye solutions as the saturable absorber has proven to be an easy and reliable way to generate picosecond (ps) or femtosecond (fs) light pulses [5]. Much effort has been devoted to the study of the pulse-forming dynamics and the effect of dyes in passively mode-locked Ti: sapphire lasers [6-91. Our group [6] and Sarukura and Ishida [7] investigated the buildup dynamics of passively mode-locked Ti: sapphire lasers with DDI (Cz7Hz7N21 or l,l’-Diathyl-2, 2’-dicarbocyanine Iodide) and HITCI (l:l’: 3,3,3’, 3’-Hexamethylindotricarbocyanine Io-dide) dye jets as saturable absorbers respectively. tither, we showed that the pulse widths and the spectra of steady-state femtosecond pulses generated by the Ti: sapphire/DDI lasers were not affected by the concentration of the DDI jet, whereas those of picosecond pulses were [8]. This implies that nonlinear pulse shortening forces such as Kerr-lens effect and
361 @ 1999 THE PHYSICAL SOCIETY
362 DYNAMIC PULSE BUILDUP IN . . VOL. 37 self-phase modulation are dominant for femtosecond pulses but not picosecond pulses. In related work, Wang et al. [9] determined the self-starting threshold of the mode-locked Ti: sapphire/dye laser by varying the concentration of the intracavity dilute dye saturable absorber that starts the mode locking.
It is important to study the early startup stage of mode locking: which is the key to the understanding of physical mechanisms for pulse formation in the laser. Recently, we have improved the time-gating technique [lo], which allows us to observe the evolution of laser output from cw all the way to complete mode-locked picosecond pulses. Transient autocorrelation traces and spectra can be measured. Three experimental parameters de-rived from the transient autocorrelation trace, i.e., the inverse contrast ratio, the second harmonic generation (SHG) conversion efficiency, and the fractional energy were found to be useful parameters in characterizing the degree of mode-locking of the laser during the pulse buildup. In this article, we review this experimental procedure in some detail. It is also shown that a two-level model for the saturable absorber can predict many of the features of pulse forming dynamics of the cw passively mode-locked Ti: sapphire laser with intracavity dye saturable absorbers. This is verified for two organic dyes: DDI and IR140 (C&-LAAWl~) with significantly different characteristics, e. g., excited state lifetime and absorption cross-section.
II. Theoretical model and numerical simulation results
The primary pulse shortening mechanisms in passively mode-locked Ti: sapphire lasers with intracavity saturable absorbers but without dispersion-compensating prisms are saturable absorption and Kerr-lens-mode-locking (KLM). The effects of these two mecha-nisms on mode locking have been discussed and analyzed in many articles [ll-121. Most of the authors perform their analyses under the assumption that a well-defined single pulse has already formed [9,13]. This is, however, not the case in the start-up stage of mode locking. Multiple pulses, pulses with complex structure, and pulses with cw background are very common in this stage. How the perfect picosecond single pulse grows out of cw noises is the central theme of the present study. Since the peak intensity of the laser output is relatively small in this stage, the nonlinear effects in the Ti: sapphire crystal such as self-phase modulation (SPM) and KLM can be neglected. In addition, gain saturation effect is insignificant in the Ti: sapphire crystal due to its high saturation intensity. Therefore, we are able to focus on the role of saturable absorber dyes played in mode locking. This is justified for the picosecond laser cavity considered in this work. The simplest model that can be used for describing the behavior of a saturable absorber is the two-level system. Let represents the absorbing population difference between lower and upper levels, the rate equation can be written as
$AN(i) = -+&jqq -
c!!$ +
i$.,
a
(1)
where hv and I(t) are the photon energy and the light intensity of incident beam, respec-tively. The absorbing population difference under thermal equilibrium with 1(t) = 0 is given by AN,. A, is the beam area on the absorber. r,, ua are the excited state relaxation time and the absorption cross-section of saturable absorber, respectively. In the small signal
VOL. 37 CI-LING PAN, NEN-WEN PU, AND JIA-MIN SHIEH 363
case, the relation between input and output intensities of laser beam through the saturable
absorber: is given by
lout(t) = Iin
exp[-c,
. AN(t) . &I,(2)
where d, is the path length of the Brewster-angled saturable absorber jet. The exponential
term in Eq. (2) is just the transmittance of the saturable absorber.
T(t) = exp[-c,
.AN(t) . d,].
(3)
At room temperature, AN, is approximately equal to the number of dye molecules per unit
volume. In this work, the concentrations (in molar fractions) of DDI and IR140 dye jets are
3 x 10m4 M and 6 x 10m6 M, respectively. These correspond to the same linear absorption per
pass, 1.5%. For DDI: oa = 8
xlo-” cm2
[14]and 7, = 30 ps
[15];for IR140, oa = 4 x lo-l6
cm2 [14] and 7, = 165 ps [15]. These and other relevant parameters of DDI and IR140 are
summarized in Table I. For our laser system
A, =8
xlOA cm2, and d, = 100 pm. These
were determined by measurements of the interference pattern of reflected beams from the
dye jet. We assume the total laser energy in the cavity was maintained at 150 nJ. This is
equivalent to an average output power of 600 mW. The Runge-Kutta-Fehlberg method [16]
was employed to solve Eq. (1) for AN(t). We assumed that the initial laser intensity l+,(t)
consisted of purely cw noises with randomly phased longitudinal modes. Substituting ~iin(t)
and AN(t) into Eq. (2), we can evaluate the output intensity, lout(t), through the absorber.
For each round trip, the laser light passes through the absorber dye jet twice. The effect of
the gain medium with negligible gain saturation is taken into account by keeping the total
intracavity energy a constant, i.e., 150 nJ.
Figure 1 and Fig. 2 show the calculated results for the evolution of AN(t) and I(t)
for a picosecond Ti: sapphire/DDI laser. In order to compare the prediction of the model
with the experimental results, we have also computed the evolution of the normalized
autocorrelation trace, I’(r). (See Fig. 3) It is defined as I’(n,r) = 2G(2)(r)/G(2)(0), where
n is the delay in round trips with respect to the laser onset. r is the relative delay between
the two arms of the background-free second harmonic intensity autocorrelator. Gc2)(r) is
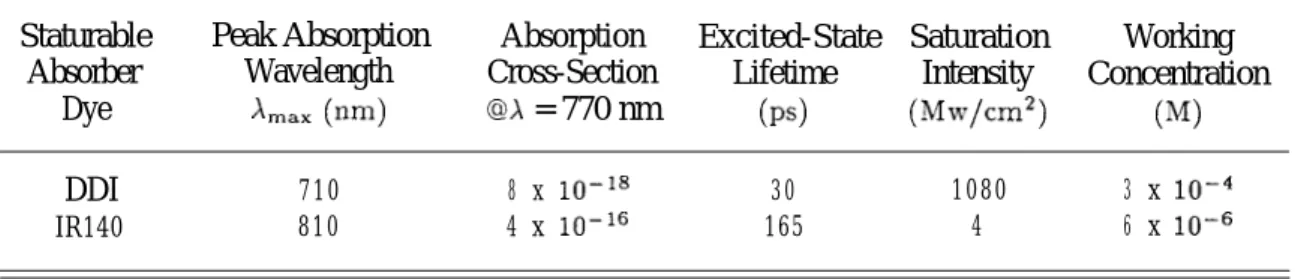
TABLE I. Optical properties of the saturable absorber dyes, DDI and IR140. The working
concentration was chosen such that the linear absorbances of the two dyes are
the same.
Staturable
Peak Absorption
Absorption
Excited-State Saturation
Working
Absorber
Wavelength
Cross-Section
Lifetime
Intensity
Concentration
Dye
x max (nnr)
@X = 770 nm
(PS)
(Mw/cm’)
(M)
DDI
710 8 x lo--” 30 1080 3 x 10-4364 DYNAMIC PULSE BUILDUP IN VOL. 37 FIG. 1. n=5UU 2ooy1 n=1550 200 /--if /-I -I' I \ 100 Oi 3000 3400 3800 n=lOOO n=l700 :::;1, ::;m 3000 3400 3800 3000 38003400 n=l300 n=l800
“3b
3800“!ooo
3400 38CNumerical simulation results for the evolution of AN(t) for a picosecond Ti: sapphire/DDI laser at a delay of n round trips from the laser onset (AN, = 1.8 x 10z3 md3). The vertical axes are in units of 1021 rnm3. The horizontal axes are in units of picoseconds.
the intensity autocorrelation function given by
Gc2)(r) = J-“, I(t)l(t + ~)dt.
The maximum value of I’(r) is normalized to 2; according to the conventional definition. The corresponding results for IR140 case are shown in Fig. 4 through 6. Examining Fig. 1 through 6, we can discern some apparent differences between the two cases:(1)
(2)
(3)
It is much easier to saturate IR140 than DDI; as shown in the evolution of AN(t). For IR140, saturation will occur even in the cw stage. This is because the saturation intensity 1; of IR140 is two orders of magnitude smaller than that
of DDI (see Table
1).
The recovery time for IR140 after saturation is obviously longer than that of DDI. This is due to the longer excited-state relaxation time for IR140.
In the early stage, at least for the fist 1000 round trips after the laser onset, IR140 provides stronger selective absorption than DDI. This is also due to the low saturation
VOL. 37 CI-LING PAN, NEN-WEN PU, AND JIA-MIN SHIEH 36.5 n=lOOO 300 / IO0 n=1300 6o01 0 3000 3400 381 n=l550 n=1700 n=1800 :::;m ';-;~~ ::I:;~ 3000 3400 3800 3000 3400 3800 3000 . 3400 38t
FIG. 2. Numerical simulation results for the evolution of the intracavity peak power, I(t) for a picosecond Ti: sapphire/DDI laser at a delay of n round trips from the laser onset. The vertical axes are in Watts. The horizontal axes are in units of picoseconds.
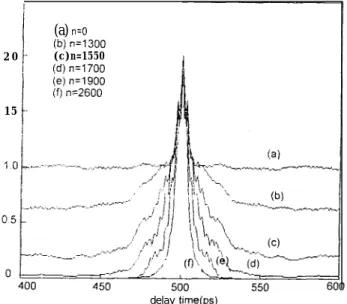
I
(a) n=O 1 (b)n=1300 2 0 (c)n=1550 i (d)n=1700 I (e)n=1900 (f)n=2600 15 delay time(ps)FIG. 3. Numerical simulation results for the evolution of the normalized autocorrelation traces, r(r), for a picosecond Ti: sapphire/DDI laser at a delay of n round trips from n = 0 to n = 2600. The horizontal axis is in unit of picoseconds.
366 DYNAMIC PULSE BUILDUP IN . VOL. 37
n=1000 n=3350
51
7
n=1450 n=4300
:hj;b
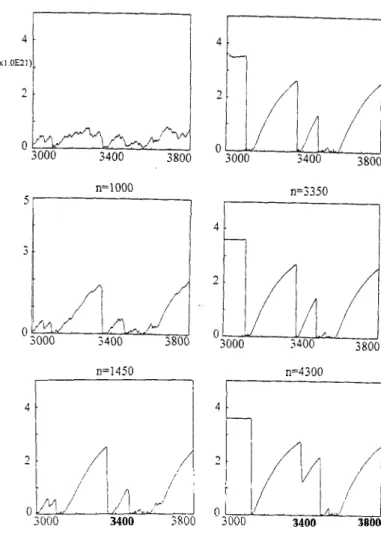
3000 3400 3400 3800FIG. 4. n’umerical simulation results for the evolution of 4-V(t) for a picosecond Ti: sapphire/IRl40 laser at a delay of n round trips from the laser onset (AN, = 3.6 x 10zl me3). The vertical axes are in units of 10zl m- 3. The horizontal axes are in units of picoseconds.
intensity of IR140 (see Table I). It is well known that the discrimination of low-intensity noise bursts from high-low-intensity ones is the primary mechanism for pulse formation [li’]. In the cw stage, when all the noise bursts are relatively small, an absorber with lower saturation intensity will more easily pick the larger noise bursts out of the average. Compare Fig. 2 with Fig. 4: we find the pulse forming speed of the Ti: Sapphire/DDI laser is much faster than that of the Ti: Sapphire/IR140 laser after 1500 round trips. A “pulse” is nearly shaped for the Ti: Sapphire/DDI laser at about 1900 round trips. On the other hand, it takes more than 5000 round trips for the Ti: Sapphire/IR140 laser to reach the same state, which is about 3 times as long. This is also due to the low saturation intensity of IR140, as well as the longer relaxation time. It is so easily saturated and takes such a long time to recover that hardly any
VOL. 37 CI-LING PAN, NEN-WEN PU, AND JIA-MIN SHIEH 367
FIG. 5.
n=500
Numerical simulation results for the evolution of the peak intracavity power, I(t), for a picosecond Ti: sapphire/IR140 laser at a delay of n round trips from the laser onset. The vertical axes are in Watts. The horizontal axes are in units of picoseconds.
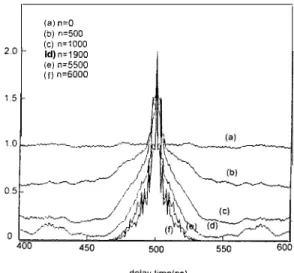
(a) n=O (b) n=500 ZO- (CL)id) n=1900 n=lOOO
(e) n=5500 (1) n.6000
FIG. 6. Numerical simulation results for the evolution of the normalized autocorrelation traces, l?(r), for a picosecond Ti: sapphire/IR140 laser at a delay of R round trips from n = 0 to n = 6000. The horizontal axis is in unit of picoseconds.
368 DYNAMIC PULSE BUILDUP IN FIG. 7. f g 10 P Y I P 5 1000 2000 3000 ’ 4000
number of round trips
VOL. 35
Numerical simulations of the evolutions of the peak intracavity intensity of the largest noise burst for picosecond Ti: sapphire/DDI and Ti: sapphire/IR140 lasers as a function of the delay time in number of round trips.
significant
suppression of the undesired noise bursts can be achieved. Compared to
the Ti: sapph.ire/DDI laser, there are more clusters of undesired noise bursts apart
from the primary one in a Ti: sapphire/IR140 laser at the same stage. Figure 7
illustrates this phenomenon by tracing the evolution of peak intracavity intensity for
the largest noise burst in each case.
We have also simulated the pulse evolution of the passively mode-locked Ti:
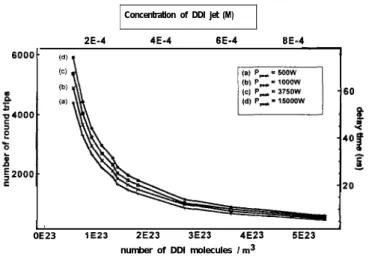
Sap-phire/DDI laser for various dye concentrations. This is shown in Fig. 8. The buildup time
for the formation of mode-locked pulses is apparently an exponential function of dye
concen-tration. This can be easily understood from the exponential form of transmission function
of dye given in Eq. (4). Based on the above numerical results, we can make the following
observations about the role of the dye saturable absorber in the pulse forming process of
passively mode-locked Ti: sapphire lasers without dispersion-compensating prisms:
(1)
(2)
(3)
The dyes are not merely starters of mode locking. Picosecond single pulses can grow
out of the cw signals by the help of the saturable absorber dyes without the presence
of KLM.
The pulse formin g dynamics down to the ps regime depends mostly on the dye
pa-rameters e.g., TV,, and g‘a.
A plausible physical picture of mode locking in these lasers is as follows: In the
beginning, thousands of randomly phased modes in the cavity interfere with each
other. As a result, the cw laser output is described by the so-called Gaussian noises.
With the presence of the saturable absorber dye, the strongest noise bursts are selected
and amplified, while the others are gradually suppressed. Finally, a primary cluster
of noise burst is formed which eventually evolves into the single pulse.
VOL. 37 CI-LING PAN, NEK-WEK PU, AND JIA-MIX SHIEH 369
Concentration of DDI jet (M)
6000.
2E-4 4E-4 6E-4 6E-4 VI (Cl (b) (a) .60 I 2 1
0E23 1E23 2E23 3E23 4E23 6E23 number of DDI molecules I m3
FIG. 8. Numerical simulations of the effect of the dye concentration on the buildup time of the intracavity peak power of the largest noise burst to (a) 500 W, (b) 1000 W, (c) 3750 W , (d) 15000 W in a picosecond passively mode-locked Ti: Sapphire/DDI laser.
III. Experimental methods
A block diagram of the experimental setup is shown in Fig. 9. The configuration of ps passively mode-locked Ti: sapphire laser is shown in the inset of Fig. 9. It employed an &mm Ti: sapphire crystal in a six-mirror linear astigmatically compensated cavity. The Ti: sapphire laser was aligned such that it would not self-start without the saturable dye jet. That is, the Kerr-lens strength was weak. The lasing wavelength was set at X = 770 nm by a 0.5mm-thick birefringent filter. Self-starting, sustaining and stable mode-locked pulses were achieved for DDI concentrations in the range of 2 x 10e5 to 10e3 M. Pumped by an all-lines 6-W cw argon-ion laser, the Ti: sapphire/DDI and Ti: Sapphire/IR140 lasers routinely generate steady-state pulses with duration’s of 5ps and lops, respectively. With 5% output coupling, the average output powers were 600 mW at 79.4 MHz. For the investigation of the dynamics of pulse formation in our laser, the cw argon-ion laser was mechanically chopped to produce 500-Hz square pulses with a FWHM of lms and a rise time of 2 ps. The output was divided into three beams. The first beam was detected by a fast photodetector for a real-time display of the pulse train on the oscilloscope. The second beam was directly detected by a gatable photomultiplier tube, gated by 1-ms pulses delayed with respect to the onset of the laser. The output was sent to a RF spectrum analyzer that monitors the transient beat notes. The third beam was fed to a non-collinear autocorrelator or a monochromator and detected by a photomultiplier tube. A boxcar integrator with a 50-ns gate then selected four pulses in the window at a given delay time and averaged the signal. By delaying the gate with respect to the chopped pumping signal, we can sample the transient temporal and spectral behavior of the output of the Ti: sapphire laser at consecutive moments in the evolution process.
370 DYNAMIC PULSE BUILDUP IN VOL. 37
FIG. 9. Block diagram of the experimental arrangement: MC, mechanical chopper; BS’s, beam splitters; PD’s, photodetectors; PMT’s, photomultiplier tubes; PC, personal computer: .4/D, analog-to-digital converter. The inset shows the configuration of the passively mode-locked picosecond Ti: sapphire/dye laser; S-4, saturable absorber, BF, birefringent filter; Ml iV M6, mirrors.
IV. Experimental results and discussions
For various concentration of DDI, the pulse formation time: the steady-state buildup time, the steady-state pulse width, and the steady-state time-bandwidth product are sum-marized in Table II. It is interesting that all these quantities are exponentially dependent on the concentration. The exponential form of transmission function of dye can also explain this. It is in good agreement with the simulation results as well. For the data presented below, the concentrations of DDI and IR140 are fixed at the values given in Table I.
From the real-time oscilloscope trace (see Fig. lo), we observed that the chopped laser output exhibited relaxation oscillation at 200 kHz during the first 15 ps after the laser onset. Afterwards, a pulse train appeared and soon became stable at about 45 ,LLS for the Ti: sapphire/DDI laser, and 150 ,US for the Ti: sapphire/IR140 laser. Relaxation oscillation is caused by the interplay of population inversion and stimulated emission. Because gain saturation is not an important pulse-shaping mechanism in solid-state lasers, we do not expect relaxation oscillation to affect the starting dynamics of the Ti: sapphire/DDI or /In140 laser.
The normalized background-free intensity autocorrelation traces are plotted as a function of the delay time in Fig. 11 for the Ti: sapphire/DDI laser and Fig. 12 for the Ti: sapphire/IR140 laser, respectively. Zero delay time was chosen to coincide with the fist relaxation-oscillation peak. Curve (a) in each of the above two figures is a typical autocorrelation trace for a randomly phased cw laser. The baseline of the trace is at unity.
VOL. 37 CI-LING PAN, NEN-WEN PU, AND JIA-MIN SHIEH 3 7 1
TABLE II. The effect of DDI concentration on the pulse forming dynamics of the
picosec-ond Ti: sapphire/DDI laser.
Dye
Linear
Pulse Forming
Steady-State
Steady-State Pulse Width
Concentration
Loss
Time
Buildup Time
Pulse Width BW Product
( 10-4M)
(%) ( r o u n d t r i p s )
(round trips)
(ps)
AvAr
6.0
3
1200
3600
- 2
N 2.0
3.0
1.5
1300
4000
- 5
N 4.0
1.25
0.7
3600
6400
N 8.5
N 8.0
0.84
0.4
11900
20000
N 12
N 11
FIG. 10. Real-time display of the dynamics of pulse formation. The
upper trace is thechopped
argon-ion laser pump pulse. The lower trace shows the pulse train buildup in
the Ti: sapphire/dye laser measured with a fast photodetector.Fig. 11(a) exhibits a 9ps-wide coherent spike.
The coherent spike is due to a chaotic
collection of picosecond fluctuations, not to well-defined picosecond pulse [18-201. The
width of this spike corresponds to the coherence time of the laser [18] and should be inversely
proportional to the spectral bandwidth of the laser [18-191. From this formula, we estimated
that the corresponding bandwidth of the Ti: sapphire/DDI laser was about 2A. This is in
good agreement with our spectral measurements. (See Figs. 15 and 16) The secondary
spikes located at approximately a lo-ps delay from the coherent spike peak were due to the
372 DYKAMIC PULSE BUILDUP Ii-K ‘. VOL. 37
-100 0 100
delay time(ps’)
FIG. 11. Experimentally observed transient intensity autocorrelation traces of a picosecond Ti: sapphire/DDI laser at different delay times after the laser onset.
-200
delayOtime(ps) 200
FIG. 12. Experimentally observed transient intensity autocorrelation traces of a picosecond Ti: sapphire/IR140 laser at different delay times after the laser onset.
mutual correlation between side clusters of longitudinal modes observed in our transient spectral measurements (See also Fig. 15 and 16). For the Ti: sapphire/DDI laser, an autocorrelation trace (trace (e) in Fig. 11) with negligible background was first observed at about 20 ps (or E 1600 round trips). The baseline of trace (e) in Fig. 11 is nearly zero. The height and FWHM of the shoulder are 0.23 and 72 ps respectively. The distinction between the coherence spike and the shoulder is not apparent. The corresponding time for
VOL. 37 CI-LING PAN, NEN-WEN PU, AND JIA-MIN SHIEH 373 the Ti: Sapphire/IR140 laser to reach this state is about 90 ~LS (or M 7200 round trips) while the height and FWHM of the shoulder are 0.75 and 175 ps respectively. This trend is in good agreement with our theoretical prediction presented in Sec. 2.
In order to examine the buildup dynamics more quantitatively, we introduce the following parameters: First of all, we define the contrast ratio,
R,
as the peak-to-shoulder ratio of the autocorrelation trace, i.e., the local contrast ratio [20]. In the 1970’s, many numerical calculations have been performed to simulate varying degrees of mode locking of the laser with the contrast ratio as an index [21-251.R-'
is related to the contrast ratio in the two-photon fluorescence (TPF) case,RTpp =
3/(2R-1 + l), in the above studies [23]. The SHG conversion efficiency E(‘) and the fractional energy /? were also found to be useful for characterizing the pulse formation process. The SHG conversion efficiency is defined as ~(~1 = Ei2)/Eb2), where Ei2) denotes the actual SHG energy generated and Ei2) is the SHG energy that would have been generated by the fundamental wave of the same shape and of the same total energy but without background. Previously, Von der Linde [24] has pointed out E(~) is insensitive to the pulse shape and is a very sensitive measure of the background level. The transient value of &c2) was obtained by measuring the transient fundamental power, the SHG power, and the pulse width [26]:where rp, pwj and p2w are transient pulse width, fundamental power, and SHG power: respectively. The parameters, r;‘, jjr, p;; are corresponding steady-state values. The fractional energy ,f3 is defined as p = &> where
E,
is the energy of the pulse andEtotal
is the energy of pulse with background. It can be calculated from the SHG conversion efficiency by using the relation [24]:
and 1 v Q2” =
( )
t,1
c--Tic/2 Y
H
7’~/2s
IW)l”~~
J p-,(t)l2(2-“)&
-TR/~ -TIT/~!
TR/~I>
s
lYPM4~~
-TRIP(5)
(6)
where TR, rpp:
VP
are respectively, the cavity round trip time, the pulse width, and the analytic signal associated with the optical field of the pulse envelope.Let us examine the autocorrelation traces shown in Fig. 11 in some detail using the above parameters.
R z
2;orR-'z
During the first 10 ~_ls, the contrast ratio remained nearly a constant, 0.5. The laser behaved like a cw laser. As the circulating energy inside the cavity increased and saturated the absorber dye, the output of the Ti: sapphire laser became slightly modulated. In this stage (see curves (b) and (c) of Fig. ll), a very small degree of
374
DYNAMIC PULSE BUILDUP IN VOL. 35interdependence among the phases of a few
neighboring modes has been developed. Thus
the value
ofR-l
gradually decreased, but anapparent pulse profile has yet appeared. At
16 ps (M 1280 round trips): the autocorrelation trace
displayed a low baseline, upon which
was
superposed a broad Lorentzian shoulder with a width rs of z 155 psand a normalized
height of z 0.3.
The width of the central coherent spike remained unchanged throughout the buildup process up to this point. The width of the broad hill on which the spike rides, rs, is proportional to the duration of the burst of light with phase-locked modes 1181, while the presence of the narrow central spike reveals the unclean appearance of the burst of light with numerous picosecond substructures on it [18-251. At 20 ps (E 1600 round trips), weobserved the first autocorrelation trace with negligible cw background in the whole buildup process, with a peak-to-shoulder contrast ration of z 8.7 (R-l E 0.12), [curve (e) of Fig. 111. The central portion of the trace has a two-sided exponential profile. This corresponds to 4.4 ps - wide primary pulse. The residual pedestal in the trace (assumed to be Lorentzian) has a width of N 72 ps and a normalized height of w 0.23. Further locking of modal phases manifested as increasing R until the steady state with practically infinite contrast (R-l N 0)
was reached. At a delay of 40 ps, a time-bandwidth product T~AV z 0.5 was measured. This is close to the transform limit of Gaussian pulses (0.44). We note further that after 45 ps, the laser spectra broadened considerably due to the effect of self-phase modulation (SPM) [27]. The ime-bandwidth product eventually increased to N 4, much greater thant’ the transform limit. This implies the existence of significant chirp within the pulse. The steady-state pulse shape is Gaussian; with a FWHM pulse width of 5 ps. The steady-state pulse width for the Ti: sapphire/IR140 laser is w 10 ps.
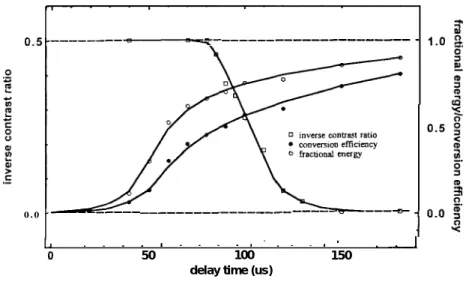
In Figs. 13 and 14, we display the inverse contrast ratio, R-l, as a function of delay time (open squares) for Ti: sapphire/DDI and Ti: sapphire/IR140 lasers, respectively. Also shown in Figs. 13 and 14 are the SHG conversion efficiency E(‘) (filled circles) and the fractional energy ,0 (open circles) as a function of the delay time. As we can see in Figs. 13 and 14: the parameters, R-l: E(‘), and p all exhibit apparent asymptotic behavior toward the steady state. Thus they are convenient for quantitatively characterizing different stages during the buildup of mode-locked pulses. In the cw regime, the contrast ratio, R - 2. or R-l N 0.5, while ~(‘1 and p are nearly zero. When more and more longitudinal modes were locked with stronger phase interdependence, the value of R-l began to decrease, while ~(~1 and ,0 increased. Further locking of modal phases manifested itself as increasing R or decreasing ~(~1 or p until the steady state was reached. The steady-state pulse exhibited an autocorrelation trace with nearly zero background, practically infinite contrast (R-l ry
0)
and 100% SHG conversion efficiency and fractional energy. Examining Fig. 14, we find that second harmonic signal for the Ti: sapphie/IR140 laser was observed very earlier but rose rather slowly during the buildup, while R-l remains N 0.5 until a delay of N 70 ps. In contrast, a sharp decline of R-l and subsequently rapid rise of ~(~1 or p were observed for the Ti: sapphire/DDI laser after the fist 10 ps. Furthermore, the buildup time for the Ti: sapphire/DDI laser, which almost reached its steady state at 60 ps (Z 4800 round trips). was much faster than the Ti: sapphie/IR140 laser (about 150 ps or 12000 round trips). These are consistent with the theoretical predictions presented in section 1. We note that the steady state pulse width for the Ti: sapphire/DDI laser (5 ps) was also significantly shorter than that of
the Ti: sapphire/IR140 laser (10 ps). To calculate the
steady-state pulse width, one has to include all kinds of broadening and shortening mechanisms and findVOL. 37 CI-LING PAN, NEN-WEN PU, AND JIA-MIN SHIEH 375
1
20 40 60
delay time (us)
FIG. 13. The inverse contrast ratio, R-’ (open squares), SHG conversion efficiency ~(~1 (filled circles) and the fractional energy /? (open circles) as a function of the delay time for a picosecond Ti: sapphire/DDI laser.
oar_---__-
_______-__---_--0.0 -
___---_-7 Is .... I .... I . . -. I .
..I
0 50 100 150
delay time (us)
FIG. 14. The inverse contrast ratio, R-l (open squares), SHG conversion circles) and the fractional energy p (open circles) as a function of picosecond Ti: sapphire/IR140 laser.
efficiency ~(~1 (filled the delay time for a
the balancing point for them. This is the subject of our forthcoming paper. Our simple model gives a rough estimate of the steady-state pulse, N 10 ps for both lasers. This is of the same order of magnitude as the experimental data.
376 DYNAMIC PULSE BUILDUP IN ‘. . VOL. 3i i \ ___- -_____-- --___a-r-L---- j ‘.,
!i
__‘t, IcJus -m-m___-/siii
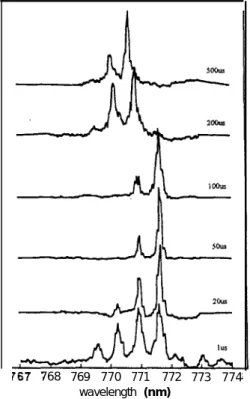
768 770 772 774 Wavelength (nm)FIG. 15. The evolution of the optical spectra for the output of a picosecond Ti: sapphire/DDI laser during the pulse buildup.
FIG. 16
768 769 770 771 772 773 774 wavelength (nm)
The evolution of the optical spectra for the output of a picosecond Ti: sapphire/IR140 laser during the pulse buildup.
Fig. 15 and 16 show the evolution of optical spectra for the two cases. In the starting stage of both lasers, we observe spectral features separated by 0.7 nm. This was due to the etalon effect of the 500-mm-thick, Brewster-angled birefringent filter. We note that there was a spectral blue shift for the Ti: sapphire/DDI laser as it evolved to the steady state. This can be qualitatively explained by the shift of the net gain curve due to the saturation of DDI [6,7]. The absorption peak of DDI dissolved in ethylene glycol is at 710 nm, whereas the gain peak of Ti: sapphire is at 800 nm. As DDI became saturated during the evolution, the net gain of the laser shifted to the blue. This phenomenon, however. was not observed in the Ti: sapphire/IRl40 laser. It can be easily explained. Examining Fig. 4, we can see that the IR140 dye is highly saturated even at the beginning of the cw regime. There is no mechanism for the gain curve to shift throughout the evolution process. Also note that for the Ti: sapphire/DDI laser the spectra broadened considerably as the steady-state 5-ps pulse was formed (at a delay beyond N 45 ps). This is manifestation of the nonlinear self-phase modulation (SPM) effect. Concurrently, the time-bandwidth product of the laser increased from 0.5 (rddelay z 30 N 40 ps) to 4 (rddelay > 60 ps), much greater than the transform limit. This implies the existence of significant chirp within the pulse.
VOL. 37 CI-LING PAN, NEN-WEN PU, AND JIA-MIN SHIEH 16 "8 0.0 0.5 1.0 1.5 Frequency (Hz) 0.0 0.5 1.0 1.5 frequency (Hz) 377 <lo9
FIG. 17. The transient RF beat-note spectra for a picosecond Ti: sapphire/DDI laser during the pulse buildup.
FIG. 18. The transient RF beat-note spectra for a picosecond Ti: sapphire/IRl40 laser during the pulse buildup.
Comparing
to the Ti: Sapphire/DDI laser; the spectral broadening of the Ti: sapphire/IRl40
laser is much less pronounced. This is because its steady-state pulse duration is twice as
long (- 10 ps). As a result, the intracavity peak intensity is only half the value of the Ti:
sapphire/DDI laser and hence less spectral broadening due to SPM.
We note that the pulse-evolution data correlate well with the transient optical spectra
as well as the RF beat-note spectra shown in Fig. 17 and 18. For the latter, we found that
some beat notes began to emerge as the mode locking proceed (at a delay time of 16 ps for
DDI and 50 ps for IR140). The growth of these beat notes implies the increasing degree of
interdependence between modal phases and therefore is an indication of the extent of mode
locking. The steady-state RF beat-note spectra was observed at about 60 ~LS for the Ti:
sapphire/DDI laser, and 150 ,us for the Ti: sapphire/IR140 laser. These are also in good
agreement with the observation of trends for the autocorrelation traces.
IV. Summary
In this article, we review in detail our theoretical and experimental studies of the
entire build-up process of mode-locked pulses in cw passively mode-locked picosecond Ti:
3 7 8 DYNAMIC PULSE BUILDUP IN
sapphire lasers with intracavity dye saturable absorbers. We show of the saturable absorber dye is satisfactory for simulation of the in these lasers. The evolution of laser output using two kinds of
VOL. 37
that a two-level model pulse build-up process dyes with significantly different excited-state lifetimes and cross- sections, DDI and IR140, were presented. We found that, rather than serving as merely a starter of mode locking, the nonlinear absorption of dye is actually the most significant mechanism in a laser cavity without dispersion-compensating prisms and weak Kerr-lens strength. The mode-locking process depends on the dye parameters r,,
I,
and N,. In the early, stage, IR140 provides stronger selective absorption than DDI for self-starting. On the other hand, the pulse forming speed of the Ti: Sapphire/DDI laser is much faster than that of the Ti: Sapphire/IR140 laser due to the low saturation intensity of IR140, as well as the longer relaxation time. By the help of the saturable absorber dyes, picosecond pulses can grow out of the cw noises without the presence of KLM.Experimentally, we were able to examine the complete dynamic process of pulse formation from the cw stage to the steady state using the time-gating technique. Incom-plete mode locking of various degrees that were determined quantitatively from the inverse contrast ratio of transient autocorrelation trace, the SHG conversion efficiency, and the fractional energy were observed. The comparison between the two different dyes DDI and IR140 being used as the saturable absorbers has been made. The corresponding transient RF beat notes spectra and the optical spectra are also consistent with the above mea-surements. The experimental results are in good agreement with the predictions of our numerical simulation.
Acknowledgments
This work was supported in part by the National Science Council of the Republic of China under various grants.
References
[ 1 ] K. Yamakawa et al., Opt. Lett. 23, 525 (1998).
[ 2 ] L. Spinelli et al., Dig. Conf. Lasers Electra-Opt., Washington, D. C., Opt. Sot. Amer., 1991, Paper CPDP7.
[ 3 ] J. Mark et al., Opt. Lett. 14, 48 (1989).
[ 4 ] U. Keller, W. H. K nox: and H. Roskos, Opt. Lett. 15, 1377 (1990), H. A. Haus et al., J. Opt. Sot. Am. B8, 1252 (1991).
[ 5 ] N. Sarukura and Y. Ishida, Opt Lett. 18, 888 (1992). [ 6 ] J.-C. Kuo et al., Opt. Lett. 17, 334 (1992).
[ 7 ] N. Sarukura and Y. Ishida, Opt Lett. 17, 61 (1992). [ 8 ] Ci-Ling Pan et al., Opt. Lett. 17, 1444 (1992). [ 9 ] Yuh-Fwu Chou et al., Opt. Lett. 19, 566 (1994). [lo] N.-W. Pu et al., Opt. Lett. 19, 566 (1994). [ll] H. A. Haus, J. Appl. Phys. 46, 3049 (1975).
[12] G. Cerullo, S. De Solvestri, and V. Magni, Opt. Lett. 19, 1040 (1994). [13] Ferenc Krausz et al., IEEE J. Quantum Electron. QE-28, 2097 (1992). [14] P. Sperber et al., Opt. Quantum Electron. 20, 395 (1988).
VOL. 37 CI-LING PAN, NEN-WEN PU, AND JIA-MIK SHIEH 379
[15] F. Ganikhanov, J. -M. Shieh, and Ci-ling Pan, Optics Communications, 114, 289 (1995). [16] L. Lapidus, and J. H. Seinfeld, in N~merica2 solutions of ordinary diflerential eqmtions (New
York: Academic, New York, 1971).
[17] S. L. Shapiro, Ultrashort light pulses (Topics in Appl. Phys., Vol. 18). (Berlin-New York: Springer-Verlag, 1997).
[18] D. J. B r adley, and G. H. C. New, Proc. IEEE 62, 313 (1974). [19] H. A. Pike and M. Hercher, J. Appl. Phys. 41, 4562 (1970).
.[20] M. A. Duguay, J. M. Hansen, and S. L. Shapiro, IEEE J. Quantum Electron. QE-6, 725 (1970).
[21] R. H. Picard and P. Schweitzer, Phys. Rev. A, 1, 1803 (1970). [22] H. P. Weber, Phys. Lett. 27A, 321 (1968).
[23] H. E. Rowe and T. Li, IEEE J. Quantum Electron. QE-6, 49 (1970). [24] D. Von der Linde, IEEE J. Q uantum Electron. QE-8, 328 (1972).
[25] M. A. Duguay, J. A. Giordmaine, and S. L. Shapiro, Appl. Phys. Lett. 13, 174 (1968). [26] C. Chen and J. M. Liu, Appl. Phys. Lett. 47, 662-664 (1985).