Incorporating Daily Rainfall to Derive At-Site Hourly
Depth-Duration-Frequency Relationships
Shiang-Jen Wu
1; Yeou-Koung Tung
2; and Jinn-Chuang Yang
3Abstract: Two models are herein presented to derive at-site hourly based rainfall depth-duration-frequency 共DDF兲 relationships by incorporating daily rainfall information. The model development is motivated by the desire to utilize daily rainfall data that are in existence prior to the conversion from a manned gauge to an automatic one for improving the establishment of hourly based rainfall DDF relation at the site. The performance of the proposed models is assessed by comparing the rainfall DDF relationships derived from the conventional method using solely annual maximum rainfalls of various durations. Hourly rainfall data at Hong Kong Observatory over the period of 1884–1990 are used to demonstrate the application of the two proposed models and to examine their performance. Results from the numerical experiments show that the two proposed models, which incorporate daily rainfall data, are capable of producing more accurate and reliable rainfall DDF relationships than the conventional method solely on the basis of annual maximum hourly rainfalls. DOI: 10.1061/共ASCE兲HE.1943-5584.0000065
CE Database subject headings: Frequency analysis; Rainfall frequency; Poisson ratio.
Introduction
Rainfall depth of a storm event with a specified return period and duration, often required in conventional hydrosystem infrastruc-tural designs, is estimated by rainfall frequency analysis. In gen-eral, the quality and record length of available rainfall data affect the reliable determinations of underlying probability distribution and the associated rainfall depth-duration-frequency共DDF兲 rela-tionships. However, due to the evolution of measurement technol-ogy over time, the record length of available hourly 共or shorter time resolution兲 rainfall data from automatic rain gauges is gen-erally significantly shorter than that of nonrecording daily rainfall records. At a given site, daily rainfall data might have been in existence for some time before the rain gauge is upgraded or converted to an automatic one. In general, daily rainfall depth and the corresponding maximum rainfall for a specified duration, to a certain extent, are correlated. It is reasonable to hypothesize that incorporating concurrent or extended daily rainfall record could potentially enhance the reliability and accuracy in establishing hourly based rainfall DDF relationships.
As the availability of hourly rainfall data are limited by the operation period of automatic gauges, one approach to extend the length of hourly based rainfall record at a site by incorporating
additional daily rainfall record is to disaggregate daily rainfall records into hourly data. Many studies have been made on rainfall disaggregation共Hershenhorn and Woolhiser 1987; Connolly et al. 1998; Koutsoyiannis and Onof 2001; Koutsoyiannis et al. 2004兲. The disaggregation approach is indirect in that daily rainfalls are first decomposed into hourly rainfalls through an appropriate mechanism. The annual maximum hourly rainfalls from disaggre-gated data are then used to establish the hourly based rainfall DDF relationships
In case hourly rainfall records are available, Nguyen and his coworkers 共Nguyen and Chaleeraktrgkoon 1990; Nguyen and Pandey 1994; Nguyen et al. 1998兲 introduced a practical idea to relate rainfall characteristics of different durations through the establishment of quantile relationship. However, their quantile re-lationships are derived on all available hourly and daily rainfall data rather than the extreme type of rainfalls. This makes the assessment of protection level, in terms of annual exceedance probability, for a hydrosystem infrastructure difficult, if not im-possible. For this reason, Wu et al. 共2005兲 modified the idea of Nguyen and his coworkers to develop daily hourly rainfall quan-tile relationships by using the maximum hourly rainfalls corre-sponding to the annual maximum daily rainfall events. The rainfall quantile relationships established in such a way could facilitate the derivation of various hourly based rainfall DDF curves. The idea has been shown to be more accurate than the conventional method of exclusively using annual maximum hourly based data when rainfall duration is shorter than 6 h共Wu et al. 2005兲. This is primarily because, for a longer duration rain-fall 共say, 12 h兲, the events consisting of annual maximum 12-h rainfall may not occur inclusively within the day of annual maxi-mum daily rainfall. The likelihood of hourly based annual t-h maximum rainfall that concurrently occurs with the annual maxi-mum daily event decreases as the rainfall duration increases.
This paper modifies the earlier annual-maximum-event共AME兲 model proposed by Wu et al. 共2005兲 and further develops an all-event 共AE兲 model for establishing at-site annual maximum hourly based rainfall DDF relationships by incorporating concur-rent and/or extended daily rainfall data. Through numerical
appli-1
Associate Researcher, National Center for High-Performance Com-puting, 7 R and D 6th Rd., Hsinchu, 30076 Taiwan, Republic of China. E-mail: sjwu@nchc.org.tw
2
Professor, Dept. of Civil and Environmental Engineering, Hong Kong Univ. of Science and Technology, Clear Water Bay, Kowloon, Hong Kong. E-mail: cetung@ust.hk
3
Professor, Dept. of Civil Engineering, National Chiao-Tung Univ., 1001 University Rd., Hsinchu, Taiwan 300, Republic of China. E-mail: jcyang@mail.nctu.edu.tw
Note. This manuscript was submitted on July 17, 2007; approved on December 16, 2008; published online on February 19, 2009. Discussion period open until February 1, 2010; separate discussions must be submit-ted for individual papers. This paper is part of the Journal of Hydrologic
Engineering, Vol. 14, No. 9, September 1, 2009. ©ASCE, ISSN
1084-0699/2009/9-992–1001/$25.00.
cations, the performance and capability of the two proposed models in establishing hourly based rainfall DDF relationships are examined.
Methodology
This section describes the three major tasks involved in the pro-posed models. They are共1兲 classification of rainstorm events; 共2兲 establishment of quantiles relation between maximum hourly and daily based rainfall depths; and共3兲 derivation of probability dis-tribution of hourly based annual maximum rainfall from available daily rainfall data.
Classification of Rainstorm Events
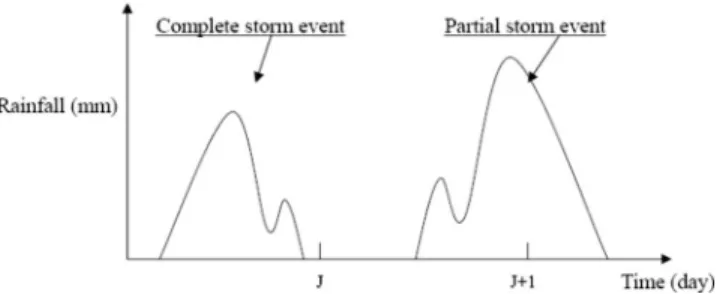
According to the occurrence time of rain, rainfall events can be classified into complete events and partial events as shown in Fig. 1. A complete rainfall event herein is defined as the one that begins and ends on the same day while a partial event begins on one day and ends on a different day. A day is designated as a rainy day if at least one rainfall event 共complete or partial兲 occurs within that day. There are several ways to define a rainfall event in the literature and one can refer to Yen et al.共1993兲. In deriving an at-site rainfall DDF relationship, the rolling-time annual maxi-mum rainfall depth for a specified duration is commonly retrieved from the recorded rainfall sequence consisting of both complete and partial events. A rainfall event may occur in the form of a complete event or a partial event that straddles across 2- or more consecutive rainy days. To extract maximum rainfall for storm durations between 2–24 h strictly within an individual rainy day may result in underestimating the annual maximum rainfalls in frequency analysis 共Wu et al. 2005兲. Table 1 共a and b兲 lists the number of events with different periods of consecutive rainy days that contain the annual maximum rainfall for various durations at Hong Kong Observatory 共HKO兲 over a 100-year record period. The table shows that most of the annual maximum rainfalls of different durations occur in an event straddling 2-consecutive rainy days. It is clear that the data series associated with the annual maximum events共AMEs兲 of varying periods of consecu-tive rainy day could not capture all annual maximum rainfall events of a fixed duration, especially when the rainstorm duration under consideration is short.
To circumvent the shortcomings of dealing with individual rainy day mentioned above and to better capture the occurrences of rolling-time annual maxima of hourly based rainfalls, the pro-posed models classify rainy days into different types of events according to the period of consecutive rainy days共see Fig. 2兲. For illustration, a single rainy day event is an isolated day which may contain one or more complete rainfall events within a single day.
A 2-consecutive rainy day event may contain multiple complete rainfall events or a mixture of several complete events and one single partial event that begins on one day and ends on the next day.
Quantile Relations of Hourly Based Maximum Rainfall and Total Rainfall
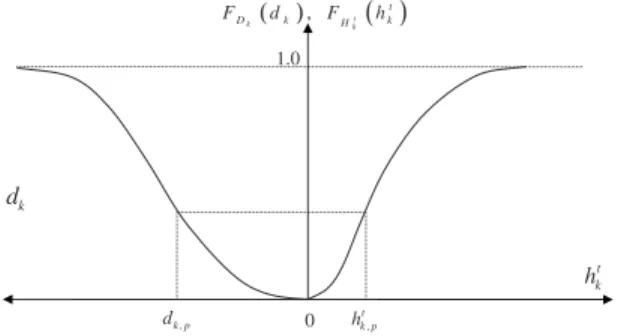
The proposed models utilize quantile relation between the total rainfall depth of the k-consecutive rainy day event and the asso-ciated t-h maximum rainfall defined as
hk,pt = gkt共dk,p兲 共1兲
in which gkt共•兲=general expression of a function and dk,p and
hk,pt = quantile values of the random total rainfall depth of the
k-consecutive rainy day event 共Dk兲, respectively, and the associ-ated t-h maximum rainfall depth 共Hkt兲 at the same probability level p, that is, FD
k共dk,p兲=Pr共Dkⱕdk,p兲=Pr共Hk tⱕh
k,p t 兲=F
Hkt共hk,pt 兲 Fig. 1. Definition of complete and partial storm events
Table 1. Frequencies of Varying Consecutive Rainy Day Events
Con-taining Annual Maximum Values of Different Storm Durations Event duration
1 h 2 h 6 h 12 h 24 h
共a兲 All consecutive rainy days
1 33 32 26 18 13
2 42 38 45 48 53
3 15 18 16 19 19
4 10 12 13 15 15
Total 100 100 100 100 100
共b兲 Annual maximum consecutive rainy days
1 11 15 23 18 13
2 25 25 37 44 52
3 14 16 15 18 19
4 9 11 13 15 15
Total 59 67 88 95 99
Fig. 2. Different types of consecutive rainy days events
= p with Fx共•兲 representing the cumulative distribution function 共CDF兲 of random variable X. Eq. 共1兲 can be determined through the use of marginal frequency relationship for Dk and Hkt, as shown in Fig. 3. Adopting a commonly used unimodal distribu-tion for Dkand Hkt, the quantile relationship between hk,pt and dk,p will be monotonically increasing.
The idea behind Eq.共1兲 is from Nguyen and Chaleeraktrgkoon 共1990兲 who used all available hourly and daily rainfall data to empirically establish such quantile functional relationship in sev-eral locations in Canada. As Nguyen’s study used the complete hourly and daily rainfall data, the estimated rainfall quantiles are not easily usable to derive the annual exceedance probability as-sociated with an event. Hence, a modification to consider daily based rainfall events and their corresponding maximum t-h rain-fall depths, such as Eq. 共1兲, would facilitate the derivation of probability distribution of maximum t-h rainfall on the annual basis.
Probability Distribution of Annual Maximum Hourly Based Rainfall
Quantile values of random maximum t-h rainfall associated with the k-consecutive rainy day event can be estimated from the quan-tiles of total rainfall depth of the corresponding event by Eq.共1兲. Since hk,pt is a monotonically increasing function of dk,p, the prob-ability p can be calculated from the marginal probprob-ability distribu-tion of the total rainfall depth associated with the k-consecutive rainy day event.
According to the total rainfall depths of selected k-consecutive rainy day events, two models are developed herein: 共1兲 the annual–maximum-event共AME兲 model and 共2兲 the AE model. The former model uses only the annual maximum total rainfall depths of k-consecutive rainy day events while the latter is based on the total rainfall depths of all such k-consecutive rainy day events in the record.
AME Model
Suppose that rainy days are classified into K varying periods of consecutive rainy day events and such events are statistically in-dependent. Let Dmax,kand Hmax,k
t , respectively, be the random an-nual maximum total rainfall depth associated with the
k-consecutive rainy day event and the maximum t-h rainfall of the
corresponding event. Since the overall annual maximum t-h rain-fall depth Hmaxt is equal to the maximum value of兵H
max,k
t 其
k=1,2,. . .,K, i.e., Hmaxt = max共Hmax,1t , Hmax,2t , . . . , Hmax,K
t 兲, the CDF of the annual maximum t-h rainfall depth can be expressed as
FHmaxt 共h兲 = Pr共Hmaxt ⱕ h兲
= Pr关共Hmax,1t ⱕ h兲 艚 共Hmax,2t ⱕ h兲 艚 ¯ 艚 共Hmax,Kt ⱕ h兲兴 = Pr关艚
k=1 K
共Hmax,k
t ⱕ h兲兴 共2兲
Under the condition of statistical independence for K rainfall events with varying period of consecutive rainy days, Eq.共2兲 can be rewritten as FHmaxt 共h兲 =
兿
k=1 K Pr关共Hmax,k t ⱕ h兲兴 共3兲As the quantiles of Dmax,kand Hmax,k
t are related in the form of Eq. 共1兲 as hmax,k,p
t = g
max,k
t 共d
max,k,p兲, substituting this relation into Eq.
共3兲 results in FHmaxt 共h兲 =
兿
k=1 K Pr关共Hmax,kt ⱕ h兲兴 =兿
k=1 K Pr关共Dmaxⱕ dk兲兴 =兿
k=1 K FDmax共dk兲 共4兲where dkrepresents a specific value of total rainfall depth associ-ated with the annual maximum k-consecutive rainy day event obtainable from solving h = gmax,kt 共dk兲. From Eq. 共4兲, the return period 共T-year兲 of the annual maximum t-h rainfall hT can be calculated as T =关1−FH
max
t 共hT兲兴−1.
When extracting k-consecutive rainy day events used in the AME model, it is possible that such events might not occur in every single year. Hence, the annual maximum value of the total rainfall depth for the corresponding event is zero. This situation is becoming more likely to occur as the period of consecutive rainy day event increases. As can be seen in Table 2, based on 100 years of hourly rainfall record at HKO, except for the case of single rainy day, the number of years having zero occurrences of events with k 共kⱖ2兲 consecutive rainy days is positive and it increases with k. Hence, the probability distribution used to fit the annual maximum total rainfall depth series for k-consecutive rainy day events with zeros should be treated.
Hosking and Wallis共1997兲 proposed a mixed CDF to fit rain-fall data including nonzero and zero observations as
Fx共x兲 =
再
p0, x = 0
p0+共1 − p0兲Gx共x兲, x ⬎ 0
冎
共5兲 in which Fx共·兲=CDF of rainfall depth; p0= probability thatrain-fall depth is zero; and Gx共·兲=CDF for the positive-valued rainfall data. The parameters in Gx共.兲 are calibrated with the positive-valued data. In this paper, Eq.共5兲 is applied in the AME model to establish the quantile relationship between the annual maximum total rainfall depth of a certain period of consecutive rainy days and its corresponding maximum t-h rainfall.
k d 1.0 t k h ( ), t( ) k k t D k H k F d F h 0 k , p d t k , p h
Fig. 3. Marginal distribution functions for Dkand Hkt
Table 2. Number of Years at the HKO Having Zero Occurrences of
Events with Varying Number of Consecutive Rainy Days
Consecutive rainy days Number of years with zero events
1 0
2 4
3 53
4 76
AE Model
Since the AE model considers all k-consecutive rainy day events, the probability of the overall annual maximum t-h rainfall should also depend on the annual number of such events. Suppose that the number of the k-consecutive rainy day event in a year is nk. The total rainfall depth of the k-consecutive rainy day event and the associated maximum t-h rainfall depth are denoted as Dkand
Hkt, respectively. Referring to Eq. 共2兲, the CDF for the annual maximum t-h rainfall depth Hmax,kt , conditioned on nkoccurrences of k-consecutive rainy day events in a year, can be expressed as
FHmaxt 共h兩n1,n2, . . . ,nK兲 = Pr关共Hmaxt ⱕ h兩n1,n2, . . . ,nK兲兴 = Pr关艚 k=1 K 共Hmax,k t ⱕ h兩n k兲兴 共6兲
Assuming that the maximum t-h rainfall depths of different con-secutive rainy day events are statistically independent, i.e., Cov共Hmax,kt , Hmax,k⬘
t 兲=0 for k⫽k
⬘, Eq.共6兲 can be rewritten as
FHmaxt 共h兩n1,n2, . . . ,nK兲 =
兿
k=1 KPr关共Hmax,kt ⱕ h兩nk兲兴 共7兲 Furthermore, assume that the maximum t-h rainfall depths of
nkk-consecutive rainy day rainstorm events, Hk,i
t 共i=1,2, ... ,n k兲, are statistically independent from an identical probability distri-bution, that is, Hk,it i.i.d.⬃ F
H k
t共h兲. Then, Eq. 共7兲 can be rewritten as FHmaxt 共h兩n1,n2, . . . ,nK兲 =
兿
k=1 K Pr关共Hmax,k t ⱕ h兩n k兲兴 =兿
k=1 K Pr关共Hk,1 t ⱕ h兲 艚 共H k,2 t ⱕ h兲 艚 ... 艚 共H k,nk t ⱕ h兲兴 =兿
k=1 K冋
兿
i=1 nk Pr关共Hk,it ⱕ h兲兴册
=兿
k=1 K 关Pr共Hk tⱕ h兲兴nk=兿
k=1 K 关FHkt共h兲兴nk 共8兲 Through the quantile relationship of dk,p and hk,pt defined in Eq. 共1兲, the CDF for Hmaxt conditioned on 共n
1, n2, . . . , nK兲 can be ex-pressed in terms of daily rainfall depth quantiles associated with the k-consecutive rainy day event as
FHmaxt 共h兩n1,n2, . . . ,nK兲 =
兿
k=1 K 关FHkt共h兲兴nk=兿
k=1 K 关FDk共dk兲兴nk 共9兲 in which h and dkare related in the form of Eq.共1兲.Note that the number of the k-consecutive rainy day event in a year is random. Hence, let Nk be a discrete random variable rep-resenting the number of the k-consecutive rainy day event occur-ring yearly and Pr共Nk= nk兲, for nk= 0 , 1 , 2 , . . . ,⬁, be the probability of having nk occurrences of the k-consecutive rainy day event in a year. Combining Eq.共9兲 with Pr共Nk= nk兲, the un-conditional CDF of the annual maximum t-h rainfall depth can be obtained as FH max t 共h兲 =
兿
k=1 K再
兺
nk=0 ⬁ 兵关FDk共dk兲兴nk⫻ Pr共Nk= nk兲其冎
共10兲Modeling Annual Occurrence of k-Consecutive Rainy Day Events
To calculate the probability of annual maximum t-h rainfall depth
Hmaxt by Eq.共10兲, the probability distribution of Nkmust be speci-fied. Poisson distribution is often adopted to describe the random number of occurrence of hydrologic events. It is defined by a single parameter, that is, the mean number of occurrence of hy-drologic events of interest within a specified time interval共or the average rate of event occurrence per unit time兲. Although Poisson distribution is often used to describe the random number of oc-currences of hydrologic events, it is not necessarily appropriate for all situations due to its requirement about the equality of the mean and variance.
The generalized Poisson distribution 共GPD兲 introduced by Consul and Jain 共1973兲 has two parameters and with the probability mass function for the random number of occurrence 共N兲 as Pr共N = n兲 = PN共n兩,兲 =
冦
共 + n兲n−1e−共+n兲 n! , n = 0,1,2, . . . ; ⱖ 0 0 otherwise冧
共11兲 The parameters共,兲 can be determined by the first two moments 共Consul 1989兲 of N asE共N兲 =
1 −; Var共N兲 =
共1 − 兲3 共12兲
The variance of the GPD model can be greater than, equal to, or less than the mean depending on whether the second parameter is positive, zero, or negative. The values of mean and variance of a GPD random variable tend to increase as increases. Joe and Zhu共2005兲 proved that the GPD model is a mixture of Poisson distribution and it fits counting data with large zero fractions bet-ter than negative binomial distributions. Therefore, The GPD model has greater flexibility to fit various types of random count-ing processes, such as binomial, negative binomial, or Poisson distribution, and many other observed data. As the condition of equality of mean and variance is not required, the GPD is used in this paper to describe the random annual number of occurrences of k-consecutive rainy day events.
Determining T-Year, t-h Maximum Rainfall Depth
In the process of determining the quantile value of annual maxi-mum t-h rainfall depth for the AME and AE models, one-dimensional golden-section search technique is used to solve Eqs. 共4兲 and 共10兲 for the unknown h associated with a specified return period T by using the following objective function
Min关共hTt兲兴 =
冏
FHmaxt 共hTt兲 − FˆHmaxt 共hTt兲 FH max t 共hTt兲冏
=冏
1 − T⫻ FHmaxt 共hTt兲 T − 1冏
共13兲 where FHmaxt 共hTt兲=cumulative probability associated with a return period T-year specified in advance for the unknown rainfall depth
hTt and FˆHmaxt 共hT
t兲=estimated cumulative probability computed by the AME and AE models using Eqs. 共4兲 and 共10兲, respectively. The T-year, t-h rainfall depth hTt is found when the objection function共hTt兲 is less than the specified tolerance.
Model Application
Description of Data
For the development, application, and performance evaluation of the proposed AME and AE models, hourly rainfall data in 1884– 1990 at HKO, with an interruption in 1940–1946 due to the World War II, are used.
Since the model development focuses on the rainfall events which could potentially produce significant surface runoff, the criteria adopted for defining rainstorm events and their retrieval are the following:共1兲 rainstorm interevent time: ⱖ1 h; 共2兲 event rainfall depth: ⱖ30 mm/event; and 共3兲 hourly rainfall depth within an event: ⱖ10 mm/h. A day is considered to be a rainy day when at least one rainstorm event satisfying the above criteria exists. Accordingly, events with varying periods of consecutive rainy days are identified and the corresponding event total rainfall depth and maximum t-h rainfall depths are extracted and used to develop the proposed AME and AE models.
Classification of Events for Rainy Days
To develop the proposed AME and AE models, events with vary-ing periods of consecutive rainy days are determined in advance. Referring to Eqs.共4兲 and 共10兲, the computational burden hinges on the number of categories of such events. Therefore, it is desir-able and practical to examine if the total number of categories of varying periods of consecutive rainy day events can be reduced by combining some of them. For this, two-sample Kolmogorov-Smirnov共KS兲 goodness-of-fit test is used to examine the equality of the probability distributions for the total rainfall depth associ-ated with the different period of consecutive rainy days. In doing
so, fewer but suitable number of event categories with the varying periods of consecutive rainy days can be determined.
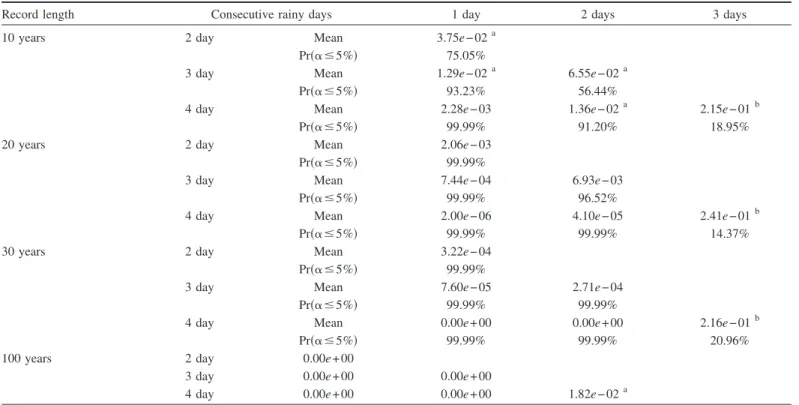
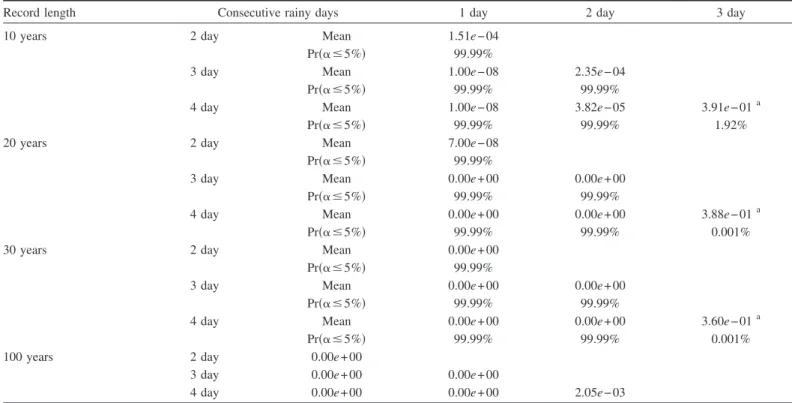
Initially, events with different period of consecutive rainy days are classified into four categories, as shown in Table 1. To con-sider the sampling uncertainty in the two-sample KS test, 50 dif-ferent subsamples of 10, 20, and 30 years of rainfall data following chronological sequence are randomly extracted from the complete record of 100 years. Tables 3 and 4 show the p values of the two sample KS test on the equality of probability distributions of the annual maximum total rainfall depth共for the AME model兲 and the total rainfall depth 共for the AE model兲 be-tween rainfall event with different period of consecutive rainy days based on 10, 20, 30, and 100 years of rainfall record. It is observed that, when the rainfall record length is longer than 10 years, the mean p values among events with 1-, 2-, and 3-consecutive rainy days are less than a significant level of 5%. While for a 10-year record length, the mean p values among events with 1- and 2-consecutive rainy days are smaller than 5%. Also shown in the parentheses below the mean p value are the percentages that the p value is less than the 5% significant level in the 50 random trials. The Pr共␣ⱕ5%兲 between 1- and 2-consecutive rainy day events共for 10 years兲 and those among 1-, 2-, and 3-consecutive rainy day events共for 20 years and longer兲 are greater than 90%. This indicates that the probability distribu-tion funcdistribu-tions of the total rainfall depth 共for AE model兲 and the corresponding annual maximum value共for AME model兲 at HKO for 2-, 3-, and 4-consecutive rainy days are statistically similar to a 10-year record length and, hence, can be combined into one group. By the same token, rainfall depths for events with 3- and 4-consecutive rainy days can be combined into one single group when a rainfall record period is longer than 10 years.
Table 3. p-Values of Two-Sample KS Test on the Equality of Annual Maximum Total Rainfall Amount Distributions for Events with Varying Consecutive
Rainy Days
Record length Consecutive rainy days 1 day 2 days 3 days
10 years 2 day Mean 3.75e − 02a
Pr共␣ⱕ5%兲 75.05%
3 day Mean 1.29e − 02a 6.55e − 02a
Pr共␣ⱕ5%兲 93.23% 56.44%
4 day Mean 2.28e − 03 1.36e − 02a 2.15e − 01b
Pr共␣ⱕ5%兲 99.99% 91.20% 18.95%
20 years 2 day Mean 2.06e − 03
Pr共␣ⱕ5%兲 99.99%
3 day Mean 7.44e − 04 6.93e − 03
Pr共␣ⱕ5%兲 99.99% 96.52%
4 day Mean 2.00e − 06 4.10e − 05 2.41e − 01b
Pr共␣ⱕ5%兲 99.99% 99.99% 14.37%
30 years 2 day Mean 3.22e − 04
Pr共␣ⱕ5%兲 99.99%
3 day Mean 7.60e − 05 2.71e − 04
Pr共␣ⱕ5%兲 99.99% 99.99%
4 day Mean 0.00e + 00 0.00e + 00 2.16e − 01b
Pr共␣ⱕ5%兲 99.99% 99.99% 20.96%
100 years 2 day 0.00e + 00
3 day 0.00e + 00 0.00e + 00
4 day 0.00e + 00 0.00e + 00 1.82e − 02a
Note: Pr共␣ⱕ5%兲 stands for the probability of p value less than the significant level of 5%.
a
Significant at 1%.
b
Significant at 5%.
In summary, rainstorm events at HKO are classified into two groups共single- and more-than-1 consecutive rainy day events兲 for a 10-year rainfall record or shorter and into three groups共single, two-, and more-than-2 consecutive rainy day events兲 for a record length longer than 10 years to develop and verify the proposed AME and AE models.
Establishing hkt-dkand hmax,k
t -d
max,kFrequency-Quantile
Relationships
As the magnitude of T-year, t-h rainfall depth is calculated by Eqs. 共4兲 and 共10兲, the frequency-quantile relationships for 共hk,p
t , d
k,p兲 and 共hmax,k,p
t , d
max,k,p兲 should be established in advance.
In the study, rainfall depth quantiles of different data series are determined through the frequency analysis. Two moment-based methods are commonly adopted in hydrologic frequency analysis: product-moment and L-moment methods. L moments are linear combination of ordered statistics and have theoretical advantages over the product-moment method of being able to characterize a wider range of distributions and, when estimated from a sample, of being more robust in the presence of outlier in the data 共Hosk-ing et al. 1997兲. The L-moment method is used in rainfall fre-quency analysis to estimate rainfall quantiles in this study.
Referring to Eq.共1兲, an often used parametric functional form for gmax,kt 共dmax,k兲 or gk
t共d k兲 is
hkt=␣共dk兲 共14兲
Fig. 4共a兲 shows hmax,k,p
t and estimated hˆ max,k,p
t by Eq.共14兲 for the 2-consecutive rainy day event extracted from 100 years of hourly rainfall record at HKO. It is observed that hˆmax,k,pstarts to deviate
from hmax,k,pt as dmax,k,p increases, meaning that the discrepancy
increases with return period. Furthermore, Fig. 4共b兲 shows that the relation between hmax,k,pt and dmax,k,pcould vary with the
pe-riod of consecutive rainy days k. It is, therefore, impractical to use
Table 4. p Values of Two-Sample KS Test on the Equality of Total Rainfall Amount Distributions for Events with Varying Consecutive Rainy Days
Record length Consecutive rainy days 1 day 2 day 3 day
10 years 2 day Mean 1.51e − 04
Pr共␣ⱕ5%兲 99.99%
3 day Mean 1.00e − 08 2.35e − 04
Pr共␣ⱕ5%兲 99.99% 99.99%
4 day Mean 1.00e − 08 3.82e − 05 3.91e − 01a
Pr共␣ⱕ5%兲 99.99% 99.99% 1.92%
20 years 2 day Mean 7.00e − 08
Pr共␣ⱕ5%兲 99.99%
3 day Mean 0.00e + 00 0.00e + 00
Pr共␣ⱕ5%兲 99.99% 99.99%
4 day Mean 0.00e + 00 0.00e + 00 3.88e − 01a
Pr共␣ⱕ5%兲 99.99% 99.99% 0.001%
30 years 2 day Mean 0.00e + 00
Pr共␣ⱕ5%兲 99.99%
3 day Mean 0.00e + 00 0.00e + 00
Pr共␣ⱕ5%兲 99.99% 99.99%
4 day Mean 0.00e + 00 0.00e + 00 3.60e − 01a
Pr共␣ⱕ5%兲 99.99% 99.99% 0.001%
100 years 2 day 0.00e + 00
3 day 0.00e + 00 0.00e + 00
4 day 0.00e + 00 0.00e + 00 2.05e − 03
Note: Pr共␣ⱕ5%兲 stands for the probability of p value less than the significant level of 5%.
a Significant at 5%. 0 20 40 60 80 100 120 140 0 200 400 600 800 1000 1200 m a x imu m 1 -h r ra in fa ll (mm)
Total daily rainfall amount (mm)
Single-rainy-day event Two-consecutive-rainy-day event three-consecutive-rainy-day event 0 30 60 90 120 150 0 200 400 600 800 1000 A nnu a l 1-hr m axim u m rainf all (m m )
Total rainfall of events with 2-consecutive days 1hr_AMS
1hr_Eq(15)
(a)
(b)
Fig. 4.共a兲 Comparison of quantile relationship between 1-h
maxi-mum rainfall derived by AMS 共1-h AMS兲 and Eq. 共14兲 and total rainfall amount 共1-h_Eq兲 for the 2-consecutive rainy day rainfall events; 共b兲 quantile relationships between 1-h maximum and total rainfall amount for 1-, 2-, and 3-consecutive rainy day rainfall events
a single parametric function form to describe frequency-quantile relationships for all durations. To circumvent the potential inac-curacy resulting from using inadequate parametric functions, in-terpolation approach is adopted in this study to estimate hkt 共or
hmax,kt 兲 for a given dk 共or dmax,k兲 based on the available quantile
pairs of 共hk,pt , d
k,p兲 and from the L-moment-based frequency analysis.
Performance Evaluation and Verification
To evaluate the proposed AME and AE models, rainfall frequency-quantile 共rainfall DDF兲 relationships estimated by the proposed AME and AE models are compared with those obtained by the conventional method using solely observed annual maxi-mum rainfall data of various durations. Specifically, the perfor-mance evaluation aims at 共1兲 examining the ability of proposed AME and AE models to estimate quantiles of annual maximum rainfall depths of varying durations by incorporating concurrent daily rainfall data and 共2兲 investigating the ability of two pro-posed models to establish more reliable and accurate quantiles estimation by incorporating extended daily rainfall record. The conventional method using exclusively the annual maximum t-h rainfall series is denoted herein as the annual-maximum-series 共AMS兲 model. The procedure for performance evaluation is out-lined below.
Step 1. Extract annual maximum rainfall depths of various durations from the complete n years of hourly rainfall record. Perform frequency analysis by using L-moment method to estab-lish the rainfall DDF relationships, denoted asn,AMS, and use it as the baseline for performance evaluation.
Step 2. Select m years out of n years of the complete record 共mⱕn兲 and treat them as the “available” data. Then, from the
m-year available rainfall record, extract k-consecutive rainy day
events for various k values. The rainfall DDF relationships de-rived from m-year available hourly rainfall data by the AMS model and proposed AME and AE models are denoted asm,AMS, m,AME and m,AE, respectively. Additionally, using additional ␦-year daily rainfall record 共m+␦ⱕn兲, the rainfall DDF relation-ships obtained by the two proposed models are denoted as m+␦,AMEandm+␦,AE.
Step 3. Repeat Step 2 many times and calculate the statistical features of the rainfall DDF relationships m,AMS,m,AME/AE, and m+␦,AME/AE.
In the performance evaluation, three scenarios of hourly records with partial record lengths共m=10, 20, and 30 years兲 are used as the available data and four additional daily rainfall record of varying lengths 共␦=10, 20, 30, and 40 years兲 are used for examining the performance of two proposed models. Fifty repeti-tions are carried out to calculate the statistical features of the rainfall DDF relationships by the AME, AE, and AMS models under various sample sizes for performance evaluation.
To compare the accuracy of estimated rainfall DDF relation-ships by the three models, the absolute relative error of derived rainfall DDF relationships by the three models with respect to the baseline 共n=100,AMS兲 under various available record length 共m years兲 are computed by
m,model=
冏
m,model−100,AMS
100,AMS
冏
共15兲 where subscripts model= AMS, AME, AE and m = 10, 20, 30. To evaluate the effect of additional daily rainfall data on the accuracy
of derived rainfall DDF relationships, similar error measure is used
m+␦,model=
冏
m+␦,model−100,AMS
100,AMS
冏
共16兲 where model= AME, AE; m = 10, 20, 30; and ␦=10, 20, 30, and 40.
Comparison of Proposed Models with the Conventional Model
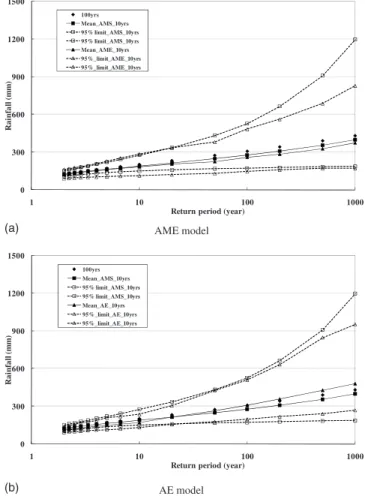
The relative performance of the AME and AE models under dif-ferent conditions are evaluated by comparing their estimated rain-fall DDF relationships with those conventionally derived solely from the same available m-year annual maximum hourly rainfall datam,AMS. For the purpose of brevity, a typical result with rain-fall duration t = 6 h is chosen for illustration. For other durations, similar behavior can be observed and readers are referred to Wu 共2006兲 for more detailed information. Figs. 5共a and b兲, respec-tively, show the comparison of the mean and 95% probability bounds for 6-h rainfall DDF relationships derived under the avail-able record m = 10 years by the conventional AMS model against the AME and AE models. As can be seen, the mean rainfall DDF curves derived by the AME and AE models are close to the base-line curves共n=100,AMS兲. Also, the 95% probability bound of esti-mated rainfall DDF relationships, which indicates the model output variability can capture the baseline DDF relationship. For
0 300 600 900 1200 1500 1 10 100 1000 Ra in fa ll (mm )
Return period (year)
100yrs Mean_AMS_10yrs 95% limit_AMS_10yrs 95% limit_AMS_10yrs Mean_AME_10yrs 95%_limit_AME_10yrs 95%_limit_AME_10yrs AME model 0 300 600 900 1200 1500 1 10 100 1000 Ra in fa ll (mm )
Return period (year)
100yrs Mean_AMS_10yrs 95% limit_AMS_10yrs 95% limit_AMS_10yrs Mean_AE_10yrs 95%_limit_AE_10yrs 95%_limit_AE_10yrs AE model (a) (b)
Fig. 5. Comparison of statistical features of 6-h rainfall DDF
rela-tionships of varying durations by the AMS and AME models under
m = 10 years:共a兲 AME model; 共b兲 AE model
great majority of the rainfall durations considered 1–18 h the width of 95% probability bounds for both AME and AE models are narrower than those of the AMS model under the same avail-able record length, especially for high return periods. This is be-cause a lower standard error is associated with the quantile estimation by the proposed models. A plausible explanation is that the incorporation of concurrent daily rainfall data enriches the information content in the process of deriving rainfall DDF rela-tions.
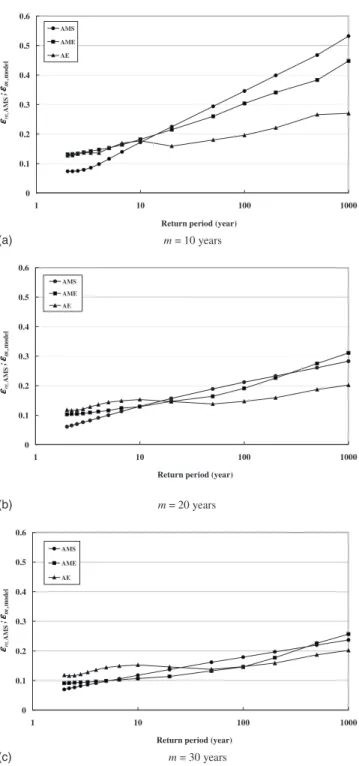
Figs. 6共a–c兲 show the mean absolute relative error 共¯m,AME, ¯m,AE, and¯m,AMS兲 of 6-h rainfall DDF relationships from the 50 randomly drawn samples under different available rainfall record
lengths. It is interesting to observe that the proposed models yield a larger error than the conventional AMS model when the return period is smaller than the available record length. However, as the return period increases, the proposed AME and AE models yield smaller error than the conventional AMS model.
As expected, the magnitude of error decreases as the available record length increases. Furthermore, the difference in error curves associated with the three models diminishes as the avail-able record length increases. A general observation can be drawn from this study: when the return period of interest is significantly smaller than the available record length共e.g., T⬍5 years when
m = 10 years; T⬍10 years when m=20 years; and T⬍20 yr
when m = 30 years兲, the AME and AE models do not produce improved estimation of rainfall quantiles, if not making the esti-mation less accurate. Based on the results obtained, the proposed models, particularly the AE model, are capable of yielding more accurate and reliable at-site rainfall DDF relations than the AMS model when the return period is higher than the available record length.
Effect of Additional Daily Rainfall Record
In some situations, the rain gauge at a gauging location is up-graded from a previously manned gauge to an automatic record-ing gauge. Then, daily rainfall data exist prior to the availability of hourly rainfall data. This section examines the performance of two proposed models by incorporating additional daily rainfall records beyond the period of automatic gauging.
By incorporating additional daily rainfall record, the corre-sponding marginal frequency-quantile relationship of Dk 共left-hand curve in Fig. 3兲 would be affected. Therefore, the frequency-quantile relations of Dkand Dmax,kand, consequently, the hk
t⬃d k and hmax,kt ⬃d
max,krelations in Eq.共1兲 would have to be updated.
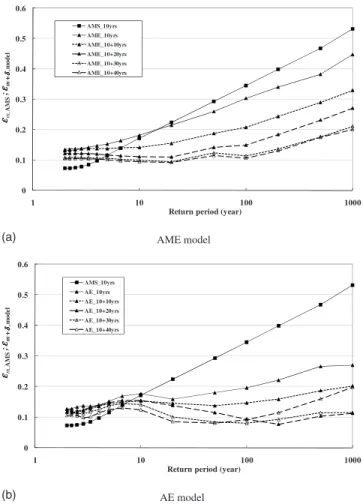
Figs. 7共a and b兲 show the mean absolute relative error 共¯m+␦,AME, ¯m+␦,AE, and¯m,AMS兲 of the 6-h rainfall DDF relationships estab-lished by the AME and AE models, respectively, under available record length共m=10 years兲 along with different additional daily rainfall record of␦ years. The figures clearly reveal that ¯m+␦,model
for the proposed models decrease as the record length of addi-tional daily rainfall 共␦兲 increases. This behavior has been ob-served for all other storm durations and available record length 共m兲 considered 共Wu 2006兲.
To consider the effect of sampling uncertainty of rainfall data on the rainfall DDF relationships, the probability of m+␦,model
共with model=AME, AE兲 being less than or equal to m,AMS, Pr共m+␦,modelⱕm,AMS兲, is calculated from the 50 absolute relative errors of estimated 6-h rainfall DDF relationships. Fig. 8 shows the relation between Pr共m+␦,modelⱕm,AMS兲 and ␦ year at HKO for some selected return periods 共T=50, 100, and 200 years兲 under available record m = 10 years. It is observed that the value of Pr共m+␦,modelⱕm,AMS兲 increases with additional daily rainfall record length 共␦兲. The value of Pr共m+␦,modelⱕm,AMS兲 is about 70% for all selected return periods and it could reach as high as 90% at higher return periods for some storm durations consid-ered. Therefore, the proposed AME and AE models demonstrate their ability to enhance the accuracy of at-site rainfall DDF rela-tionship by incorporating additional daily rainfall records, if such data exist.
Comparison between Proposed Models
It has been shown above that both AME and AE models have the ability to enhance more reliable and accurate estimation of at-site
0 0.1 0.2 0.3 0.4 0.5 0.6 1 10 100 1000
Return period (year)
AMS AME AE m = 20 years mo de l AM S , m ; εεεε εεεεm, 0 0.1 0.2 0.3 0.4 0.5 0.6 1 10 100 1000
Return period (year)
AMS AME AE m = 10 years mo de l AM S , m ; εεεε εεεεm, 0 0.1 0.2 0.3 0.4 0.5 0.6 1 10 100 1000
Return period (year)
AMS AME AE m = 30 years mo de l AM S , m ; εεεε εεεεm, (a) (b) (c)
Fig. 6. Mean absolute relative error of 6-h rainfall DDF relationships
for different “available” record lengths: 共a兲 m=10 years; 共b兲 m = 20 years; and共c兲 m=30 years
rainfall DDF relationships by incorporating concurrent and/or ad-ditional daily rainfall data, if available. This section focuses on the comparison of two proposed models.
Referring to Fig. 6, without additional daily rainfall record 共␦=0兲, the mean absolute relative error values of rainfall quan-tiles calculated by the AE model are smaller than those of the AME model. Fig. 7 also shows that the rate of accuracy improve-ment decreases with additional daily record length. The rate of accuracy improvement by the AME model is significantly higher than the AE model, especially for the smaller number of
addi-tional daily record length, say, ␦=10 years. From Fig. 8, the value of Pr共m+␦,AEⱕm,AMS兲 is significantly higher than those of Pr共m+␦,AMEⱕm,AMS兲, indicating that the AE model is more likely to yield a more accurate rainfall DDF relation than the AME model.
By incorporating concurrent daily rainfall data, the AE model, in general, produces more accurate rainfall DDF relationships than the AME model under 10–30 years available hourly rainfall record at HKO. However, the accuracy level between the two proposed models is compatible when the record length is about 30 years or possibly longer by extrapolation of the trend. From the viewpoint of data processing and computational complexity, the AME model is simpler than the AE model. Hence, it is reasonable to suggest the use of AME model rather than the AE model, when the available record length for hourly rainfall data are relatively long. Otherwise, the AE model is recommended.
Conclusions
This paper presents two models, namely, the AME model and the AE model, which incorporate daily rainfall information to estab-lish at-site hourly rainfall DDF relationships. The application of proposed AME and AE models requires共1兲 classification of rainy days into events with varying periods of consecutive-rainy days; 共2兲 establishment of the rainfall quantiles relation between hourly and daily rainfall depths; and 共3兲 derivation of the probability distribution for annual maximum hourly rainfall depth in terms of the daily rainfall probability distribution.
For illustration and performance evaluation, the proposed AME and AE models are applied to estimate at-site rainfall DDF relation by incorporating daily rainfalls using the data at HKO. From the numerical experiments, the AME and AE models dem-onstrate their ability to yield more accurate DDF relations than the conventional model based solely on the basis of available annual maximum hourly rainfall record when the return period of interest is larger than the available record length. Moreover, the proposed AME and AE models show promising potential to fur-ther enhance the accuracy of rainfall DDF relationships by incor-porating additional daily rainfall records at the site, if available. As a result, the proposed models can be viable for improving hourly based rainfall DDF relationships by using daily rainfall data available at the site prior to the conversion from a manned gauge to automatic recording.
To summarize the above results, the proposed AME and AE models would be carried out for the design of rain gauge network. In detail, the AME and AE models can evaluate “adequate” hourly rainfall record length at an automatic rain gauge from which the reliable and stable rainfall DDF relationships are to be established. As the hourly rainfall record for an automatic rain gauge reaches this adequate length, it can be redeployed to other strategic locations and replaced by a less expensive gauge for collecting daily rainfalls. Hence, a more cost effective rain gauge network, consisting of automatic and man gauges, can be estab-lished to derive reasonably accurate and reliable DDF relation-ships for hydrological applications.
In the development of AME and AE models, an important assumption was made. That is, consecutive rainy day events are statistically independent. In fact, there probably exists correlation among these events. As a result, a future work could be made to take a correlation among consecutive rainy day events into ac-count to derive the AME and AE models.
0 0.1 0.2 0.3 0.4 0.5 0.6 1 10 100 1000
Return period (year)
AMS_10yrs AME_10yrs AME_10+10yrs AME_10+20yrs AME_10+30yrs AME_10+40yrs AME model mo de l AM S , m ; δδδδ εεεε εεεε ++++ m, 0 0.1 0.2 0.3 0.4 0.5 0.6 1 10 100 1000
Return period (year)
AMS_10yrs AE_10yrs AE_10+10yrs AE_10+20yrs AE_10+30yrs AE_10+40yrs AE model mo de l AM S , m ; δδδδ εεεε εεεε ++++ m, (a) (b)
Fig. 7. Mean absolute relative error of 6-h rainfall DDF relationships
different additional daily record lengths 共m=10 years and ␦ = 10, 20, 30, 40 years兲: 共a兲 AME model; 共b兲 AE model
50 75 100
0 10 20 30 40
Additional daily rainfall record length (years)
AME_T=50-yr AE_T=50-yr AME_T=100-yr AE_T=100-yr AME_T=200-yr AE_T=200-yr
Fig. 8. Pr共m+␦,modelⱕm,AMS兲 for AME and AE models of varying
return periods under m = 10 years
Acknowledgments
This study is conducted under the auspice of research project “Investigating issues in rainfall intensity-duration and timescale relations in Hong Kong“ 共Project No. 620505兲 funded by the Research Grant Council of Hong Kong Special Administration Region, China.
Notation
The following symbols are used in this paper: Dk, Hk
t ⫽ total rainfall depth of the k-consecutive rainy day event and the associated t-h maximum rainfall depth;
Dmax,k, Hmax,k
t ⫽ annual maximum total rainfall depth of the
k-consecutive rainy day event and the
associated t-h maximum rainfall depth;
FHmaxt 共h兲 ⫽ CDF of t-h annual maximum rainfall depth;
nk ⫽ number of k-consecutive rainy day event in a year;
m,AMS,m,model⫽ absolute relative errors of the rainfall DDF relationshipsm,AMS,m,mode with respect to n=100,AM;
m+␦,model ⫽ absolute relative error of the rainfall DDF
relationshipsm+␦,model with respect to
n=100,AMS;
m,model ⫽ rainfall DDF relationships derived from
m-year available hourly rainfall data by “model”;
n=100,AMS ⫽ rainfall DDF relationships derived by the AMS model using 100-year rainfall data; and
m+␦,model ⫽ rainfall DDF relationships obtained by model
using m-year available hourly rainfall data with additional␦-year daily rainfall record. References
Consul, P. C., and Jain, G. C.共1973兲. “A generalization of Poisson dis-tribution: Properties and application.” Technometrics, 15, 791–799.
Consul, P. C.共1989兲. Generalized Poisson distributions: Properties and
application, Marcel Dekker, New York.
Connolly, R. D., Schirmer, J., and Dunn, P. K.共1998兲. “A daily rainfall disaggregation model.” Agric. Forest Meteorol., 92, 105–117. Hershenhorn, J., and Woolhiser, D. A.共1987兲. “Disaggregation of daily
rainfall.” J. Hydrol., 95, 299–322.
Hosking, J. R. M., and Wallis, J. R.共1997兲. Regional frequency analysis:
An approach based on L-Moments, Cambridge University Press, New
York.
Joe, H., and Zhu, R.共2005兲. “Generalized Poisson distribution: the prop-erty of mixture of Poisson and comparison with negative binomial distribution.” Biom. J., 47共2兲, 219–229.
Koutsoyiannis, D., and Onof, C.共2001兲. “Rainfall disaggregation using adjusting procedures on a Poisson cluster model.” J. Hydrol., 246, 109–122.
Koutsoyiannis, D., Onof, C., and Wheater, H. S.共2004兲. “Multivariate rainfall disaggregation at a fine timescale.” Water Resour. Res., 39共7兲, 1–18.
Nguyen, V. T. V., and Chaleeraktrgkoon, C.共1990兲. “Estimation of hourly rainfall distribution based on available daily rainfall data.” J. Am.
Water Resour. Assoc., 11, 67–76.
Nguyen, V. T. V., and Pandey, G. R.共1994兲. “Estimation of short-duration rainfall distribution using data measured at longer time scales.” Water
Sci. Technol., 29共1兲, 39–45.
Nguyen, V. T. V., Nguyen, T. D., and Wang, H.共1998兲. “Regional esti-mation of short duration rainfall extremes.” Water Sci. Technol.,
37共11兲, 15–19.
Wu, S. J.共2006兲. “Development and application of stochastic generation model for rainfall series with time scale.” Ph.D. thesis, National Chiao-Tung Univ., Hsinchu, Taiwan.
Wu, S. J., Tung, Y. K., and Yang, J. C. 共2005兲. “A simple model to estimate hourly rainfall DDF relationships by incorporating daily rain-fall.” Proc., 31st IAHR Congress, Korea Water Resources Association, Seoul, Korea, 3698–3708.
Yen, B. C., Riggins, R., and Ellerbroek, J. W., III.共1993兲. “Probabilistic characteristics of elapsed time between rainfalls.” Management of
ir-rigation and drainage systems: Integrated perspectives, ASCE, New
York, 424–431.