國
立
交
通
大
學
生物資訊及系統生物研究所
博
士
論
文
A 型 H3N2 流行性感冒病毒之
基因演化與抗原性演化之關聯性研究
A Study of Relationships between Genetic and Antigenic
Evolution of Influenza A (H3N2) Viruses
研 究 生:黃章維
指導教授:楊進木 教授
A 型 H3N2 流行性感冒病毒之基因演化與抗原性演化之關聯性研究
A Study of Relationships between Genetic and Antigenic Evolution of
Influenza A (H3N2) Viruses
研 究 生:黃章維 Student:Jhang-Wei Huang
指導教授:楊進木 Advisor:Jinn-Moon Yang
國 立 交 通 大 學
生物資訊及系統生物研究所
博 士 論 文
A ThesisSubmitted to Institute of Bioinformatics and Systems Biology National Chiao Tung University
in partial Fulfillment of the Requirements for the Degree of
PhD in
Bioinformatics and Systems Biology
September 2010
Hsinchu, Taiwan, Republic of China
中華民國九十九年九月
A 型 H3N2 流行性感冒病毒之
基因演化與抗原性演化之關聯性研究
研究生:黃章維 指導教授: 楊進木博士
國立交通大學 生物資訊與系統生物研究所 博士班
摘 要
流行性感冒病毒經常對人類造成大規模的感染與死亡。發生在病毒表面紅血球凝集素 (hemagglutinin 簡稱為 HA)上的胺基酸突變在逐漸累積之後會產生不同抗原特性的病毒株 (稱為抗原性變異株),並且造成抗原性漂變(antigenic drift),此時疫苗常常需要在下一波疫 情來臨前重新設計以提供足夠的保護力。目前人們對於流感病毒的基因演化(genetic evolution)與抗原性演化(antigenic evolution)間之關聯性尚未十分清楚,探究它們的關聯性對 於公共衛生與疫苗發展是一個重要且有高度急迫性的議題。 在流感病毒中,A 型(H3N2)對人有高的致死率,且演化快速。本論文提供三個構面來 研究A 型(H3N2)流感病毒之基因演化與抗原性演化之關聯性。在第一構面中,針對 HA 的 抗原性變異株提出一個以決策規則為主的方法用以挑選關鍵的胺基酸位置、建立規則並研 究共同改變的胺基酸位置。做法是使用資訊獲得量(information gain,IG)與亂度(entropy)來 量度一個胺基酸位置用於區分抗原性變異株與相似株的鑑別力高低。該規則根據紅血球凝 集素的胺基酸突變來描述一株流行病毒株是否能被疫苗株產生之抗體所抑制,而共同改變 的胺基酸位置常與逃脫抗體辨識以及抗原性漂變相關。 在第二構面中,本研究加入抗原與抗體交互作用的概念,並且發展了一套抗原決定位 (epitope)為主的方法以鑑別抗原性漂變。首先定義一個「變異的抗原決定位」是一個具有 累積構形改變且逃脫抗體辨識的抗原決定位。實驗結果顯示,兩個關鍵胺基酸位置的改變 可以引起一個抗原決定位的構形改變。除此之外,鄰近受體結合區(receptor-binding site)的 兩個抗原決定位(A 與 B)在逃脫抗體辨識上扮演重要的角色。通常兩個改變的抗原決定位 可以造成抗原性漂變。 在第三構面中,本研究探討胺基酸位置是否具有相同抗原性影響力,並且發展了一套 以貝式理論為基礎的方法用以鑑別抗原性漂變。做法是利用概率比(likelihood ratio,LR)量 度每個胺基酸位置所造成的抗原性變化大小。根據單純貝式網路與概率比,此方法定義 ADLR用於量度一對紅血球凝集素序列間的抗原性距離(antigenic distance)。實驗結果顯示, 位於抗原決定位與空間上鄰近受體結合區的位置對於抗原性漂變有決定性的影響。除此之 外,ADLR與血球凝集抑制試驗(hemagglutination inhibition,HI)之血清測試值有高度的相關性,且可以解釋自西元1968 年至 2008 的 A 型(H3N2)疫苗株選擇。
整體而言,此論文顯示了上述模型對於描述基因演化與抗原性演化之關聯性具有可行
性與穩健度。根據 HI 之血清測試值、紅血球凝集素與抗體之結晶結構,此研究發現 A 型
(H3N2)流感病毒抗原性變異株的關鍵胺基酸位置、共同演化位置、胺基酸位置規則與抗原 決定位規則;更重要的是這些模型可以有效反映流感疫苗株的選擇、預測抗原性變異株及
對於抗原性漂變提供具有生物意義的新洞察角度。我們相信此研究有助於未來流感疫苗的 發展與了解流感病毒的演化,並能指引如何快速研發更有效的流感疫苗。未來可能的研究
A Study of Relationships between Genetic and Antigenic Evolution
of Influenza A (H3N2) Viruses
Student: Jhang-Wei Huang Advisor: Dr. Jinn-Moon Yang
Institute of Bioinformatics and Systems Biology
National Chiao Tung University
ABSTRACT
Influenza viruses often cause significant human morbidity and mortality. Gradually accumulated mutations on the glycoprotein hemagglutinin (HA) occur immunologically distinct strains (named as antigenic variants), which lead to the antigenic drift. The emergence and spread of antigenic variants often require a new vaccine strain to be formulated before each annual epidemic. The relationship between the genetic and antigenic evolution remains unclear and to understand the relationship is an emergent issue to public health and vaccine development.
Among the influenza viruses, the influenza A (H3N2) subtype causes high mortality rates and evolves rapidly. In this thesis, we study the relationship between the genetic and antigenic evolution of influenza A (H3N2) viruses focusing on the following three dimensions. In the first dimension, we proposed a rule-based method for identifying critical amino acid positions, rules, and co-mutated positions for antigenic variants. The information gain (IG) and the entropy are used to measure the score of an amino acid position on HA for discriminating between antigenic variants and similar viruses. Based on the IG, we identified the rules describing when one (e.g. circulating) strain will not be recognized by antibodies against another (e.g. vaccine) strain. In addition, our experimental results reveal that the co-mutated positions are often related to antibody recognition and the antigenic drift.
In the second dimension, we incorporated the concept of antigen-antibody interactions and developed an epitope-based method to identify the antigenic drift of influenza A utilizing the conformation changes on antigenic sites (epitopes). A changed epitope, an antigenic site on HA with accumulated conformation changes to escape from neutralizing antibody, can be considered as a "key feature" for representing the antigenic drift. Our experimental results show that two critical position mutations can induce the conformation change of an epitope. The epitopes (A and B), which are near the receptor-binding site of HA, play key role for neutralizing antibodies. Two changed epitopes often drive the antigenic drift.
antigenically equivalent and developed a Bayesian method to identify the antigenic drift of influenza A by quantifying the antigenic effect of each amino acid position on HA. We utilized the likelihood ratio (LR) to quantify the antigenic distance of an amino acid position. Based on naïve Bayesian network and LR, we developed an index, ADLR, to quantify the antigenic distance of a given pair of HA sequences. Our experimental results show that the positions locating on the epitopes and near the receptor-binding site are crucial to the antigenic drift. In addition, the ADLR values are highly correlated to the hemagglutination inhibition (HI) assays and can explain WHO vaccine strain selection from 1968 to 2008.
In summary, this thesis demonstrates that our models are feasible and robust to describe the relationship between the genetic and antigenic evolution. According to the HI assays and HA/antibody complex structures, we statistically derived the critical amino acid positions, co-evolution positions, residue-based rules and epitope-based rules of the antigenic variants for influenza A (H3N2) viruses. More importantly, our models can reflect the WHO vaccine strain selection, predict antigenic variants and provide biological insights for the antigenic drift. We believe that our models are useful for the vaccine development and understanding the evolution of influenza A viruses. The future work includes the study of seasonal H1N1 viruses and antigen-antibody interactions.
Acknowledgements
誌 謝
交大十年,在我的求學過程中扮演關鍵的角色。很榮幸地,在這段期間我遇見了許多 充滿研究熱情的師長與懷抱夢想的伙伴,在大家的陪伴下,走過了大學、碩士以及博士。 此論文得以完成,要歸功於許多人的熱心幫助與建議,在此衷心地感謝大家。 首先要感謝我的指導教授楊進木老師,在這段期間的用心指導與耐心栽培,並且花了 許多時間與我討論研究。此外也要感謝老師引導我進入生物資訊這個領域,更進一步展示 了許多有趣的研究議題。除了在研究上提供許多指引,在做人處世上老師也給了我很多啟 發,積極進取,樂於助人,每當我遇到困難或者心情低潮時,老師總是樂於伸出援手以及 適時給予鼓勵,能在老師的帶領下做研究是一件很幸福的事。此外也要感謝老師在助學金 上以及實驗室器材上提供豐富的資源,讓我們沒有後顧之憂地專心在研究上。 再來我要感謝台大流行病學研究所的金傳春教授啟發了我們團隊對於流感的研究,並 且分享內心對於研究產生熱情的燭火,以及對於此論文提供許多建設性意見。除此之外, 金教授懷抱著以公共衛生為己任的胸懷,亦是值得學生效法學習的精神之一。我也感謝高 成炎教授、金傳春教授、楊進木教授、盧錦隆教授、黃憲達教授以及蔡懷寬教授在百忙中 抽空擔任我的學位口試委員,並且在論文與報告內容上提出了有幫助的意見與指教。 接著我要感謝高成炎教授、盧錦隆教授、黃憲達教授以及蔡懷寬教授無償地分享個人 的寶貴研究經驗,以及給予我在研究上與人生上的鼓勵。此外在就讀研究所期間,我也感 謝盧錦隆教授在序列分析上的教導、黃憲達教授在資料庫上的教導以及黃鎮剛教授在分子 模擬上的教導,使我獲益良多。 BioXGEM 實驗室的伙伴們,也感謝你們提供地一切幫助。俊辰學長在文稿修改與日常生 活上提供了許多幫忙、其樺學長在同組的合作與討論中付出了許多心力、彥甫學長在繪圖 上的巧思與研究上的討論、凱程在研究上的討論以及這九年來的無數的無償協助與聊天談 心、怡馨在各方面的鼓勵與心情分享、宇書在研究上替我指出不足之處、一原在機器管理 的部分為大家提供方便的計算資源、丹尼爾在英文對話與文稿修改的協助,還有已經畢業 的永強、振寧、登凱分享在職場以及人生的許多心得。另外,也感謝學弟妹,彥修、敬立、 峻宇、彥超、韋帆、力仁、御哲、怡瑋、伸融,在實驗室生活上提供的歡樂與幫助。 最後要感謝我的父母親黃成湖先生與廖曉翎女士的多年養育之恩,以及妹妹郁芬的不 時鼓勵,因為有了你們的支持與照顧,此論文才得完成,你們是我最愛的家人,感謝你們。 除了上述的師長、伙伴與家人,還有許多貴人曾經提供幫助,請原諒我無法一一列出, 我仍誠摯感謝。Contents
摘 要... i
ABSTRACT ...iii
Acknowledgements ... v
Contents... vi
List of figures ...viii
List of tables ... ix
Chapter 1 Introduction ... 1
1.1. Background ... 1
1.1.1. Influenza and its impact ... 1
1.1.2. Genetic and antigenic evolution of influenza viruses ... 1
1.1.3. Annually reviewed vaccine and vaccine strain selection ... 2
1.2. Previous works ... 3
1.3. Challenges ... 5
1.4. Thesis organization... 5
Chapter 2 Co-evolution Positions and Rules for Antigenic Variants of Influenza A (H3N2) Viruses ... 7
2.1. Introduction ... 7
2.2. Motivation and aim ... 8
2.3. Materials and Methods ... 9
2.3.1. Data sets ... 9
2.3.2. Identifying critical positions on HA... 10
2.3.3. Discovering the rules of antigenic variants ... 11
2.3.4. Predicting antigenic variants ... 11
2.3.5. Identifying co-mutated positions for antigenic variants... 12
2.4. Results ... 12
2.4.1. Critical positions on HA... 12
2.4.2. The rules of antigenic variants and predicting accuracies... 17
2.4.3. Co-mutated positions for antigenic variants... 19
2.5. Discussion ... 22
2.6. Summary ... 23
Chapter 3 Changed Epitopes Drive the Antigenic Drift for Influenza A (H3N2) Viruses ... 24
3.1. Introduction ... 24
3.2. Motivation and aim ... 24
3.3. Materials and Methods ... 25
3.3.1. Changed epitopes ... 26
3.3.2. Data sets ... 26
3.3.3. Identifying critical positions on HA... 28
3.3.4. Models for antigenic variants based on changed epitopes ... 28
3.3.5. Variant ratio for measuring the antigenic drift ... 29
3.4. Results ... 30
3.4.1. Antigenic critical positions... 30
3.6. Summary ... 41
Chapter 4 A Bayesian Approach for Quantifying the Antigenic Distance of Influenza A (H3N2) Viruses ... 42
4.1. Introduction ... 42
4.2. Motivation and aim ... 43
4.3. Materials and methods ... 44
4.3.1. Data sets ... 44
4.3.2. Quantifying the antigenic distance of amino acid positions ... 49
4.3.3. Quantifying the antigenic distance of a pair of HA sequences ... 49
4.3.4. Variant ratio for studying the antigenic drift ... 50
4.3.5. Shannon entropy... 50
4.3.6. Contact-pair distance on antigen-antibody interaction... 51
4.3.7. Amino acid distance to sialic acid... 52
4.4. Results ... 52
4.4.1. Antigenic distance of amino acid positions... 52
4.4.2. Antigen-antibody interaction... 54
4.4.3. Antigenic distance for a pair of HA sequences ... 58
4.4.4. Predicting antigenic variants ... 58
4.4.5. Vaccine-vaccine transitions ... 58
4.4.6. Antigenic cluster change ... 60
4.4.7. Antigenic drift and vaccine strain selection ... 62
4.5. Discussion ... 64 4.6. Summary ... 65 Chapter 5 Conclusion ... 66 5.1. Summary ... 66 5.2. Future work ... 67 References ... 68 Appendix A ... 73 List of Publications... 73
List of figures
Figure 1.1 Overview of this thesis for studying the relationships between genetic and
antigenic evolution. ... 6
Figure 2.1 Overview of our method for predicting the antigenic variants of influenza A (H3N2) viruses... 8
Figure 2.2 The relationship between entropies and information gains of 329 amino acids on HA.. ... 14
Figure 2.3 The distribution of IG values and co-mutation scores on HA structure... 16
Figure 2.4 The decision tree and rules for predicting antigenic variants. ... 17
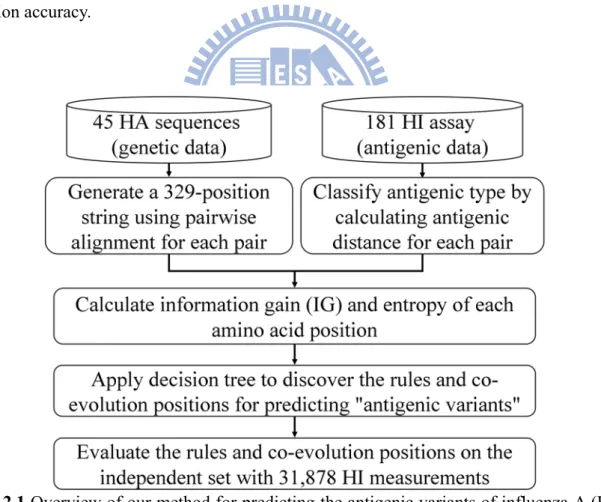
Figure 2.5 Comparison of our method with other two methods on predicting antigenic variants on two data sets... 18
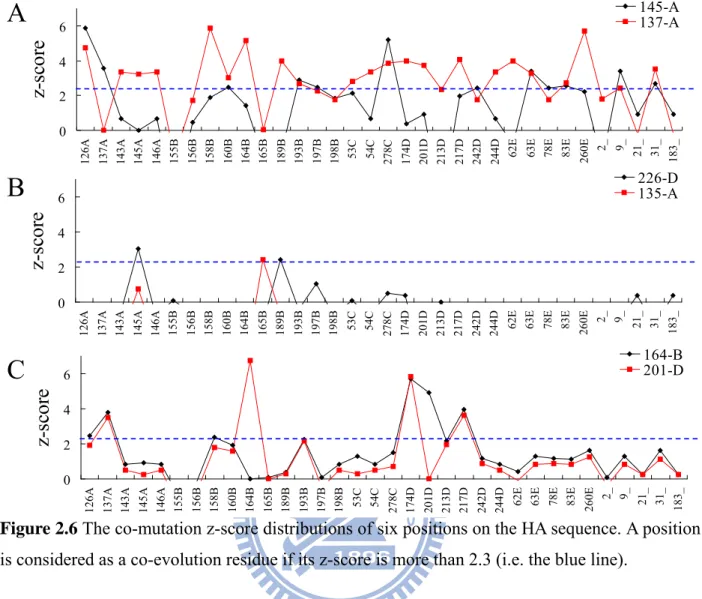
Figure 2.6 The co-mutation z-score distributions of six positions on the HA sequence. ... 21
Figure 3.1 Overview of our method for the antigenic drift. ... 25
Figure 3.2 The relationships between number of changed epitopes and antigenic variants based on four proposed models. ... 31
Figure 3.3 The changed-epitope composition and antigenic variants on 4 models... 32
Figure 3.4 The three HA-antibody complex structures.. ... 34
Figure 3.5 Comparison of our method with the other two methods on predicting antigenic variants on two data sets... 35
Figure 3.6 The HA/antibody structure and interface... 36
Figure 3.7 The epitope evolution and the antigenic drift from 1982-1983 to 2008 influenza season.. ... 37
Figure 3.8 The comparison between our method and Wilson & Cox's model in the antigenic drift from 1982-1983 to 2008 influenza season. ... 38
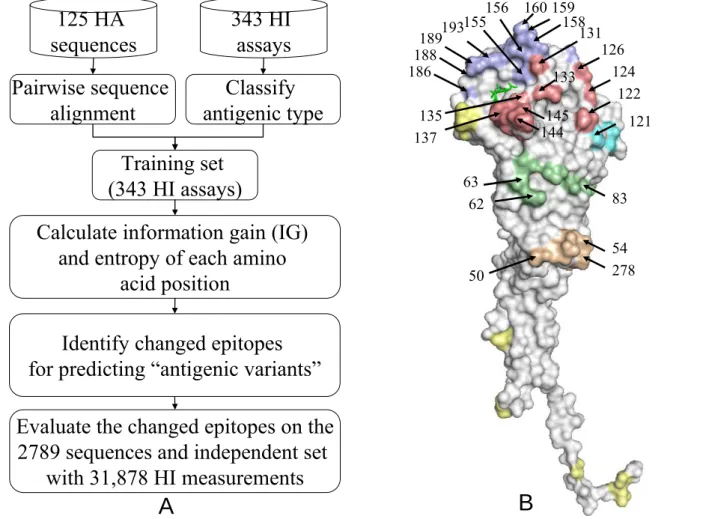
Figure 4.1 Overview of our method for quantifying the antigenic distance for amino acid positions and a pair of HA sequences... 43
Figure 4.2 The statistics of 54 antigen-antibody complex structures. ... 51
Figure 4.3 The frequency diagram of 10 amino acid positions on HA ... 54
Figure 4.4 The relationships between LR and HA-antibody complexes... 56
Figure 4.5 The LR values distribution of Smith's 43 positions. ... 57
Figure 4.6 The relationships between ADLR and HI assays... 57
Figure 4.7 The distribution of ADLR and the antigenic drift from 1968 to 2003... 61
Figure 4.8 The comparison of vaccine strain and other strains in BK79 and SY97 cluster. ... 62
Figure 4.9 The distribution of ADLR and the antigenic drift from 1982-1983 to 2008 influenza season... 63
List of tables
Table 2.1 The entropy, information gain, and co-mutated positions of 15 amino acid
positions on HA sequences... 15
Table 2.2 Comparison of our method with other methods for predicting the antigenic variants on 31,878 pairs... 19
Table 2.3 The number of co-mutation positions of five epitopes and the other area on HA... 20
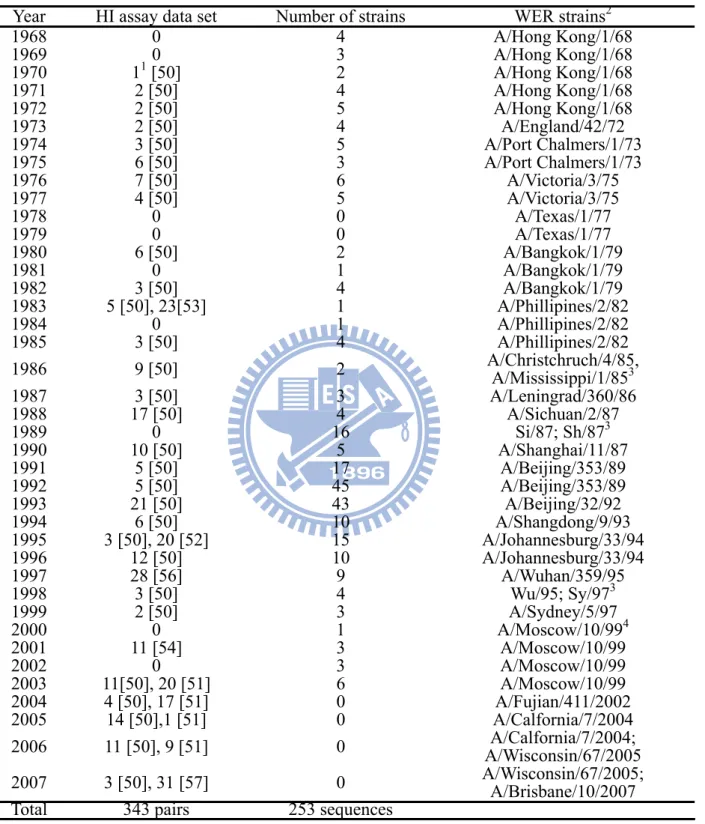
Table 3.1 The number of HI assays, number of sequences in Smith's dataset and WER strains from 1968 to 2007... 27
Table 3.2 Summary of 4 models ... 28
Table 3.3 The changed epitopes and mutations of 11 virus-pairs under 4 models ... 29
Table 3.4 The list of 64 critical positions in the five different epitopes [9, 31]... 30
Table 3.5 Example of 13 antigenic variants without changed epitopes... 39
Table 4.1 The data sources and composition of HI assay dataset from 1968 to 2007 ... 46
Table 4.2 The number of sequences and WER strains from 1982-1983 to 2008 influenza season ... 47
Table 4.3 The number of sequences and WER strains in Smith's dataset from 1968 to 2003... 48
Table 4.4 The summary of LR on 329 amino acid positions ... 53
Table 4.5 The TP, FP, p(fi |V),p(fi |S), LR and distance to sialic acid of 10 amino acid positions on HA... 53
Chapter 1
Introduction
1.1. Background
1.1.1. Influenza and its impact
Influenza is one of the most important infectious diseases occurring in humans. The annual epidemics cause an estimated 500,000 deaths in the world every year [1]. Moreover, the global pandemics can cause high mortality in humans with four pandemics occurring during the last 100 years. Among the four pandemics, the 1918 H1N1 pandemic caused about 20-50 million deaths [2]. Recently, the 2009 H1N1 pandemic that originated from swine influenza virus presented new threats to public health worldwide [3].
Influenza is a single-stranded, negative-sense RNA virus that infects humans and other animals including pigs, ferrets and many avian species. Three types (A, B and C) of influenza viruses circulate in human population. Type A virus has high genetic diversity and causes the highest rates of morbidity in humans [4]. There are eight genome segments that encode eleven proteins in the influenza A virus [5]. Among these eleven proteins, the two surface proteins hemagglutinin (HA) and neuraminidase (NA) are the main targets for the human immune system. In addition, the influenza A viruses are divided into subtypes based on major differences in HA and NA. Currently, 16 HA subtypes and 9 NA subtypes have been identified [6] and most of them are carried by the wild waterfowls [7].
1.1.2. Genetic and antigenic evolution of influenza viruses
The high genetic diversity of influenza viruses comes from error-prone RNA polymerase, high replication rates and gene segments reassortment [8]. The mutations (substitutions, deletions and insertions) are one of the most important mechanisms for generating genetic variation in influenza viruses.
1.1.2.1. Antigenic drift.
Although both HA and NA are surface proteins that are targeted by the antibodies, the HA contains the highest proportion of antigenic sites that can be recognized by the immune system [9-11]. Frequent and accumulated mutations on the influenza genome can cause conformational changes in the HA. Since the human immune system is not fully cross-protected against viral infection [12], the new mutations of HA may cause antibodies to no longer recognize the variant viruses and let the viruses to escape recognition by the immune system. This gradual change in antigenic structure with time is called antigenic drift [13]. In addition, the global influenza surveillance network regularly screens the emerging antigenic variants by hemagglutination inhibition (HI) assay [14-15], which is a binding assay representing the binding affinity between one (e.g. circulating) strain and animal antisera against another (e.g. vaccine) strain. Moreover, the HA is the primary component of current influenza vaccines [15].
1.1.2.2. Antigenic shift
When a host is co-infected by two or more different subtypes of influenza viruses, the segmented genomes between them may reassort and generate a new subtype of virus having novel mixtures of the HA and NA. This event is called antigenic shift [16-17] and the new subtype of virus often causes significant damage to humans because the human population is immunologically native to the new virus. In the last 100 years, there were four pandemics, which originated from a reassortment among HA and NA: 1918 (H1N1 subtype) [18], 1957 (H2N2 subtype) [19], 1968 (H3N2 subtype) [20] and recent 2009 pandemic (H1N1 subtype) [7] in which the genome of virus reassorted from swine [3, 21]. Moreover, the novel influenza virus is often the ancestor of circulating influenza viruses in the following years [22].
1.1.3. Annually
reviewed
vaccine
and
vaccine strain selection
Currently, vaccination is the primary preventive measure against influenza [23-24]. The vaccines can provide effective protection when the HA between vaccine strain and circulating strains share highly similar antigenic properties [25]. The human immune system can provide lifelong immunity for the invading influenza strain with one single infection [26]; however, the variant influenza viruses undergoing antigenic drift may infect people in the coming years. To ensure
that efficacy of a vaccine is sufficient against the circulating strains. WHO established a global surveillance network to detect the emergence of novel influenza viruses [27]. Each influenza season, a panel of experts meets together to select a suitable strain from recent isolates as the vaccine strain to be used in the coming winter [14]. This method raises the problem of which of today's strain is judged to cause epidemic in the following winter [28].
Since the production of flu vaccine requires 6 or more months [29], the recommendation of vaccine strain is made about 9-12 months before the season in which the vaccine is used [22]. Because of long production time for vaccines, the mismatch between vaccine strain and circulating strains may arise when the emerging variants are not identified early enough. A good example is the mismatch between vaccine strain and pandemic strains (H1N1 subtype), which occurred in year 2009.
1.2. Previous
works
One of the emergent issues of influenza viruses is the vaccine strains selection. A suitable vaccine strain can provide sufficient vaccine efficacy against the circulating strains [30]. To address this issue, many methods have been proposed to study the evolution of HA and vaccine development [15, 25, 31-32]. We divided them into several types according to the materials that they analyze.
1.2.1. Phylogenic
methods
Many works focus on the genetic evolution of influenza viruses because a huge amount of sequence data is available in the public databases. Bush et al. proposed the first method to predict the evolution of influenza virus based on HA sequences [31]. They collected 357 HA sequences from 1983 to 1997 and constructed a phylogenetic tree. Based on the phylogenetic tree, they identified 18 codons under positive selection [33]. According to the retrospective tests, their study showed that, "Viral lineages undergoing the greatest number of mutations in the positively selected codons on phylogenic tree were the progenitors of future H3 lineages in 9 of 11 recent influenza seasons." [31] Their study demonstrated that understanding the genetic evolution of HA is helpful for the vaccine strain selection.
1.2.2. Clustering methods based on genetic data
Plotkin et al. proposed a clustering method to predict the future dominant HA sequences and discussed its potential relevance to vaccine strain selection [34]. Based on the HA sequence clusters, their method select the most recent sequence in the current season's most dominant cluster as the future vaccine strain. Furthermore, they studied the spatio-temporal distribution of viral swarms and compared it to the influenza vaccines recommended by the WHO. Their study demonstrated that cluster structure analysis of HA sequences is helpful for the vaccine strain selection.
1.2.3. Clustering methods based on antigenic data
The global influenza surveillance network regularly characterizes antigenic properties of circulating strains by HI assay [14-15]. Although antigenic data is one of the key criteria for vaccine strain selection, the antigenic data are largely unexplored due to difficulties in quantitative interpretation. Smith et al. proposed an antigenic map of influenza A virus and showed that how antigenic evolution is mapped to genetic evolution [15]. The punctuated nature of the antigenic evolution of HA has been visualized in the antigenic map. Their approach quantifies the antigenic distances among vaccine strains and circulating strains from 1968 to 2003 and therefore helps with selection of vaccine strain. One of the most important discoveries in Smith el al's work is that, "Antigenic evolution was more punctuated than genetic evolution, and genetic change sometimes had a disproportionately large antigenic effect." [15] Their study demonstrated that both genetic and antigenic data provides valuable insights for the evolution of influenza viruses.
1.2.4. Hybrid method considering genetic and antigenic data
Currently, the HI assay is the primary method to characterize the antigenic properties for circulating strains. However, the quantity of HI assay data in public databases is far less than sequence data [35-37]. Lee et al. proposed the first method to predict antigenic variants based on HA sequences [25]. This data set contained 181 pairs of HA sequences pairs and the results showed that the model based on 5 antigenic sites had the best accuracy for predicting variants.
1.3. Challenges
One of the key issues in the development of influenza vaccine is to improve the accuracy of vaccine strain selection: that is, to select which of today's strain is likely to be dominant in the coming year's epidemic [28]. Furthermore, a more comprehensive understanding the relationship between genetic and antigenic evolution is useful to predict the evolution of influenza virus in advance while the surveillance system is not able to detect the variants in early stages. Moreover, there are several thousands HA sequences in public database that lack antigenic information. If a method could link the genetic evolution (sequence data) to antigenic evolution (antigenic data), it could provide valuable insights for the understanding of antigenic drift and vaccine development.
1.4. Thesis
organization
In this thesis, we study the relationships between genetic and antigenic evolution focusing on three dimensions and the thesis is organized as follows (Fig. 1.1). In Chapter 2, we developed a method for identifying antigenic critical amino acid positions, rules, and co-mutated positions for antigenic variants. The rules describe when one (e.g. circulating) strain will not be recognized by antibodies against another (e.g. vaccine) strain based on HA sequences. The co-mutated positions are two positions that mutate simultaneously on HA. We first identified the co-mutated positions and discussed its relatedness to the antigenic drift.
The critical positions are widely distributed on HA structure; however the antibody recognition of HA is highly correlated to the conformation changes on the antigenic sites (epitopes). In Chapter 3, we developed an antigenic site based method to identify the antigenic drift of influenza A utilizing the conformation changes on epitopes. We address two issues in this chapter: first, how to quantify the degree of conformational change in a changed epitope; second, what are the relationships between changed epitopes and antigenic drift.
From the previous two dimensions, we observed that some amino acid mutations can cause antigenic variants while other mutations have few effects for antigenic variants. In addition, we also noticed that mutations on epitope A and B seem more likely to cause antigenic variants. The above observations raise the question of whether the amino acid positions are antigenically equivalent or not. In Chapter 4, we developed a Bayesian method to identify the antigenic drift
the accumulated HI assay during last 40 years, we utilized the likelihood ratio (LR) to quantify the antigenic distance of an amino acid position. We discuss the relationships between LR values of positions and antigenic drift. Moreover, we developed an index, ADLR, to quantify the antigenic distance of a given pair of HA sequences based on naïve Bayesian network and LR. We evaluated ADLR for predicting antigenic variants, explaining the vaccine-vaccine transitions and selection the WHO vaccines on 2,789 circulating strains. Finally, Chapter 5 presents the conclusions and the future work.
v Vaccine strain Circulating strains Antigenic variants
Rules and co-mutated positions
Changed antigenic sites (epitopes) and antibody recognition
Antigenic distance of amino acid positions
Applications:
Predicting antigenic variants Identifying antigenic drift
and vaccine strain selection
Chanter 2 Chapter 3 Chapter 4
Predicting antigenic distance
0 0.5 1 1.5 2 2.5 3 05 10 15 20 25 30 35 40 45 50 55 60
Distance to sialic acid
L
ike
lihood
r
at
io Smith's 43 positionsOther LR>1 positions Others 0 10 20 30 40 50 60 70 N one A B C D E AB AC AD AE BC BD BE CD CE DE Changed epitope Nu mb er o f HI -a ss ay s Antigenic variants Similar viruses
A
B
C
Similar viruses Antigenic variants v Antigenic variants Similar viruses v Vaccine strain Vaccinestrain Antigenic distance
Figure 1.1 Overview of this thesis for studying the relationships between genetic and antigenic
evolution. (A) The vaccine strain and circulating strains. (B) The Chapter 2, 3 and 4 in this thesis. (C) The applications for our methods.
Chapter 2
Co-evolution Positions and Rules for
Antigenic Variants of Influenza A (H3N2)
Viruses
2.1. Introduction
Pathogenic avian and influenza viruses often cause significant damage to human society and economics [23]. The influenza viruses are divided into subtypes based on differences in the surface proteins HA and NA, which are the main targets for the human immune system. In circulating influenza viruses, gradually accumulated mutations on HA occur immunologically distinct strains (named as antigenic variants), which lead to antigenic drift. The antigenic drift often implies that vaccines should be updated to correspond with the dominant epidemic strains [23]. Mapping the genetic evolution to the antigenic drift of influenza viruses is one of key issues to public health. Many methods have been proposed to study the antigenic drift and vaccine development [15, 33, 38-40].
Retrospective quantitative analyses of the genetic data have revealed important insights into the evolution of influenza viruses [31, 33, 41]. In the current global influenza surveillance system, the ferret serum HI assay is the primary method to define the antigenic variants. Several studies used statistical models to predict the antigenic variant of a given pair of HA sequences based on these known HI assays and their respective HA sequences [15, 40]. Furthermore, Smith
et al. demonstrated that the antigenic evolution was more punctuated than the genetic evolution
[15], and the genetic change sometimes has a disproportionately large antigenic effect. Recently, few studies discusses the relationship between evolution and co-mutated positions on influenza
2.2. Motivation
and
aim
The current trivalent vaccine contains seasonal H1N1, H3N2 and influenza B virus strains [23]. Among the influenza viruses, the H3N2 subtype causes higher mortality [43] and evolves more rapidly [44]. In addition to all of the above, the large amount of genetic and antigenic data for H3N2 virus provides valuable opportunity for us to understand the relationships between genetic and antigenic evolution of influenza A viruses.
Here, we proposed a method to predict the antigenic variants of A (H3N2) viruses by identifying critical positions and rules which describe when one (e.g. circulating) strain will not be recognized by antibodies against another (e.g. vaccine) strain. Our method is also able to detect the co-mutated positions for predicting the antigenic variants. These critical positions and rules were evaluated on two datasets which consist of 181 and 31,878 pairs, respectively. The results demonstrate that our model is able to reflect the biological meanings and achieve high prediction accuracy.
Figure 2.1 Overview of our method for predicting the antigenic variants of influenza A (H3N2)
2.3.
Materials and Methods
Figure 2.1 shows the overview of our method for predicting the antigenic variants of influenza A
(H3N2) viruses by identifying critical positions, rules and their co-evolution on the HA.
2.3.1. Data
sets
We collected an HI assay data set, which contains 181 pairs of HA sequences with 45 HA (H3N2 viruses) sequences having 329 amino acids collected during the period, 1971 to 2002, from related work [40]. According to this data set, we applied the decision tree C4.5 [45] to predict the antigenic variants by identifying critical positions as well as discovering the rules and co-mutated positions. In this data set, the main samples (65%, 122 pairs among 181 pairs) consist of pairs of vaccine-circulating strains, and for each pair it is known whether there is inhibition of the circulating strain by antibodies against the vaccine strain ("antigenic variants" and "similar viruses"). Vaccine strains are selected by World Health Organization (WHO) and are often the dominant strains of influenza seasons. Each pair includes the HI assay value (i.e. antigenic distance) and a bit string of 329 binary bits by aligning a pair of HA sequences (329 amino acids). For a specific position on a pair of HA sequences, the binary value is "1 (named as mutation)" if the residue types of the two sequences on this position are different; conversely, its binary value is "0 (named as no mutation)". In general, an influenza vaccine should be updated if an HI assay value is more than 4.0 between the current vaccine strain and the strains expected to circulate in next season [15]. The antigenic distance is defined as the reciprocal of the geometric mean of two ratios between the heterologous and homologous antibody titers [40]. Among 181 pairs of HA sequences, 125 pairs with antigenic distance ≥ 4 are considered as "antigenic variants" and 56 pairs with antigenic distance < 4 are classified as "similar viruses". For example, the antigenic distance of the pair of HA sequences, A/Port_Chalmers/1/73 and A/Victoria/3/75, is 16 and this pair is considered as "antigenic variants". Conversely, the antigenic distance of the pair of HA sequences, A/Wuhan/359/95 and A/Nanchang/933/95, is 1 and this pair is considered as "similar viruses".
Furthermore, we prepared another HI assay data set proposed by Smith et al. to independently evaluate our model and compare with other methods for predicting the antigenic variants [15]. This data set consists of 253 H3N2 viruses which are clustered into 11 antigenic
viruses" pair and a virus-pair in different groups is considered as a "antigenic variants" pair. Finally, we obtained 31,878 HI measurements and these sequences were extracted from supporting materials of publication [15].
2.3.2. Identifying critical positions on HA
In this study, positions with a both highly antigenic discriminating score and highly genetic diversity are considered as critical positions. We first evaluate the genetic diversity, which commonly believed, relates to immune selection [33], of each amino acid position on HA. Here, Shannon entropy was used to measure the genetic diversity of an amino acid position i (i=1~329) with 20 amino acid types and is defined as
)) ( log( ) ( ) ( 20 1 T A P T A P i H i i T
(1)where P(Ai=T) is the probability of the position i with amino acid type T. The information gain [45] measures the score of an amino acid position on HA for discriminating between antigenic variants and similar viruses. An amino acid with high IG at a specific position implies that a mutation on this position is highly correlated to antigenic variants. The IG of the position i associates to antigenic type Y (i.e. antigenic variants (V) and similar viruses (S)) is defined as
) | ( ) ( ) , (i Y H Y H Y i IG (2)
H(Y) is the entropy of antigenic type Y and is defined as
} , { )) ( log( ) ( ) ( S V T T Y P T Y P Y H (3)H(Y| i) is the conditional entropy of Y when given the position i. Two states of the position i are
mutation (M) and non-mutation (N). H(Y| i) is defined as
} , { ) | ( ) ( ) | ( N M K i i K A Y H K A P i Y H (4)P(Ai=K) is the probability of the position i in state K. H(Y|Ai=K) is the entropy of antigenic type Y when given the position i in state K. H(Y|Ai=K) is given as
} , { )) | ( log( ) | ( ) | ( S V T i i i K P Y T A K PY T A K A Y H (5)For example, for the position 145, the numbers of the "mutation" and "non-mutation" are 62 and 119, respectively, among 181 pair-wise HA sequences in the training data set. For 62 mutation pairs, the numbers of "antigenic variants" and "similar viruses" are 61 and 1, respectively. The numbers of "antigenic variants" and "similar viruses" are 55 and 64, respectively, for 119 non-mutation pairs. According to these data, we can calculated that P(A145=M) is 0.34 and
H(Y|A145=M) is 0.12 for the mutation state; P(A145=N) is 0.66 and H(Y|A145=N) is 1.0 for the non-mutation state. Finally, we obtained H(Y| i)=0.70. The values of information gain and entropy of 329 HA positions are normalized in the range from 0 to 1.
2.3.3. Discovering the rules of antigenic variants
After identifying critical positions, we discovered the rules for predicting antigenic variants by applying the decision tree C4.5 [45]. These antigenic amino acid positions are considered as the attributors (features). An amino acid position with high IG was selected as an internal node in the tree to discriminate "antigenic variants" and "similar viruses". According to the selected positions and constructed tree, we can easily identify the rules according to the paths from the root to the leaves of the tree.
2.3.4. Predicting antigenic variants
In order to evaluate and compare our model with other methods [9, 40] for predicting antigenic variants, we collected two data sets. The first data set consists of 181 pair-wise HI measurements and the second independent data set contains 31,878 HI measurements proposed by Smith et al. [15]. Wilson & Cox [9] suggested that a drift viral variant of epidemiologic importance usually contains more than 4 residues changes located on at least 2 of the five epitopes on the HA. Lee & Chen [40] proposed a model based on the hamming distance (HD) of 131 positions on all the five epitopes of HA to predict antigenic variants. Their model predicted a pair of HA sequences as the antigenic variants if there are more than 6 amino acid mutations between this pair of HA sequences.
2.3.5. Identifying co-mutated positions for antigenic variants
Here, we used the decision tree hierarchy to identify co-mutation of two amino acid positions. In order to identify all potential co-mutated pairs on HA, the positions (i.e. 101 positions among 329 positions), which occur mutations in 181 pairs of HA sequences, are sequentially selected to identify its co-mutated positions. Based on these 101 positions, the total number of two-position combinations is 10,100. For each amino acid positions (i), the co-mutation score (S(i,j)) between the position i and its partner position j is defined as
) , ( ) , ( ) , (i j IG jY IG jY S W Ri (6)
where IGW(j,Y) is the IG value, which is derived from the whole data set (i.e. 181 pairs of HA sequences in the training set) using Equation (2), of the position j; IGRi(j,Y) is the IG value of the position j derived from the data set R by removing the pairs, in which the position i is mutated, from the whole data set. The z-score of the S(i,j) of a pair of co-mutated positions is derived from 10,100 pairs and it is defined as
( , ) ) , (i j S i j Z (7)
μ and σ are the mean and standard deviation of all 10,100 position pairs. For example, position
145 (IG is 1.0) is selected as the first node in the tree. Among 181 pairs, 62 pairs are mutated on the position 145. The amino acid positions are considered as co-mutated positions of the position 145 if their IG values significantly decrease after these 62 pairs are removed from the data set. For example, the z-score of the S(145, 137) of the pair-positions 145 and 137 is 3.58
2.4. Results
2.4.1. Critical positions on HA
In this study, we used the information gain (IG) and Shannon entropy to measure the scores of an amino acid, which is located at a specific position on HA, for discriminating antigenic variants and similar viruses. The highest and lowest values of both IG and entropy are 1 and 0, respectively. An amino acid with high IG at a specific position implied that this position is highly correlated to the antigenic variants. An amino acid with high entropy means that this position is
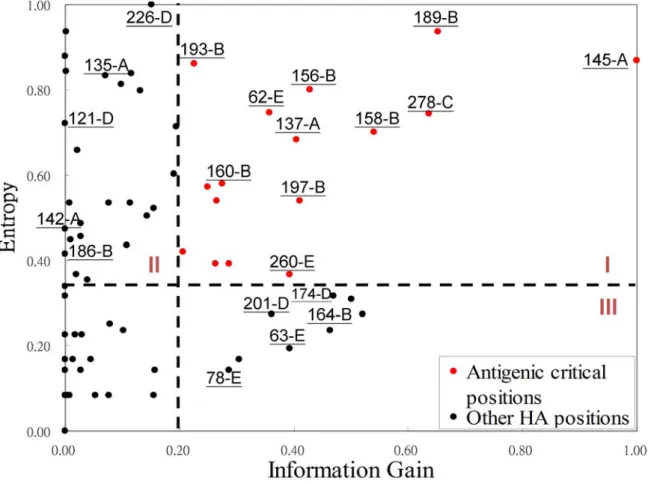
often mutated in the data set. Figure 2.2 shows the relationship of IG values and entropies of HA positions. The summary of some amino acid positions are listed in Table 2.1. Of the 329 amino acids of HA, 131 positions are considered to lie in or near the five antibody combining sites (named as epitopes) which are labeled A through E [9]. The first rank (i.e. position 145-A) locates at the epitope A of HA. Its IG and entropy are 1.0 and 0.87, respectively. Among 181 pairs of HA sequences in the training set, the position 145-A mutates on 62 pairs and 61 pairs are the antigenic variants. This result implies that a mutation on this position highly induces an antigenic drift. This observation is consistent to previous results [15], that is, the single amino acid substitution N145K can be responsible for antigenic cluster transition. We observed that the other positions with high IG values obtained the similar behaviors.
The relationship between IG values and entropies of 101 positions in HA is shown in Fig. 2.2
by excluding 228 positions which have zero for both IG and entropy. All positions can be classified into four groups according to the values of IG (antigenic degree) and entropy (i.e. genetic diversity). Those 19 positions with high IG and high entropy (i.e. Area I) are considered as critical positions in this work. According to the HA structure obtained from protein data bank (PDB code 1HGF [46]), 18 of the positions locate at all the five epitopes and 15 of them are on the surface (Fig. 2.3) by using PyMOL [47]. The positions in Area II (i.e. high entropy and low antigenic degree) imply that high genetic diversity may infer low antigenic discriminating score. For example, the positions (e.g. 226-D, 135-A, 121-D, 142-A and 186-B) have high entropies and low IG values (Table 2.1 and Fig. 2.2). Among 181 pairs of HA sequences, the position 226-D mutates on 61 pairs and 34 of these pairs are the antigenic variant. A low IG position indicates that a mutation on this position less preferred to be an antigenic variant. Our method can avoid the disadvantage of considering only the genetic data, which was widely used in previous works.
Figure 2.2 The relationship between entropies and information gains of 329 amino acids on HA.
The positions in area I (e.g. 145-A, 189-B and 278-C) with both high entropy and high IG values are highly correlated to the antigenic variants. 145-A denotes the amino acid position 145 located at the epitope A.
Table 2.1The entropy, information gain, and co-mutated positions of 15 amino acid positions on HA sequences Position-e pitope Entropy IG Number of co-mutate positions
Co-mutated positions selection Positive Transition Cluster 145-A1 0.87 1.00 12 9,31,63,78,83,126,137,160,193,197,242,278 + 2 + 3 137-A 0.68 0.41 23 9,31,53,54,62,63,83,126,143,145,146,158,160,164,174,189, 193,201,213,217,244,260,278 + 193-B 0.86 0.23 17 9,31,63,78,83,126,137,145,158,160,164,174,201,217,242,26 0,278 + + 160-B 0.58 0.28 16 2,31,54,62,126,137,143,146,156,158,164,197,217,244,260,2 78 + 156-B 0.80 0.43 8 54,62,143,146,160,197,244,260 + + 226-D 1.00 0.15 2 145,189 + 135-A 0.83 0.07 1 165 + 121-D 0.72 0.00 0 + 142-A 0.47 0.00 0 + 186-B 0.41 0.00 0 + 164-B 0.24 0.46 6 126,137,158,174,201,217, + 201-D 0.27 0.36 4 137,164,174,217 + 78-E 0.14 0.29 4 31,63,126,242 174-D 0.32 0.47 4 137,164,201,217 + 63-E 0.19 0.39 6 78,83,126,137,242,278
1 The epitope of the position on HA sequence.
2 the position is under positive selection defined by Bush et al. [33].
3 the position is a cluster-difference substitution defined by Smith et al. [15].
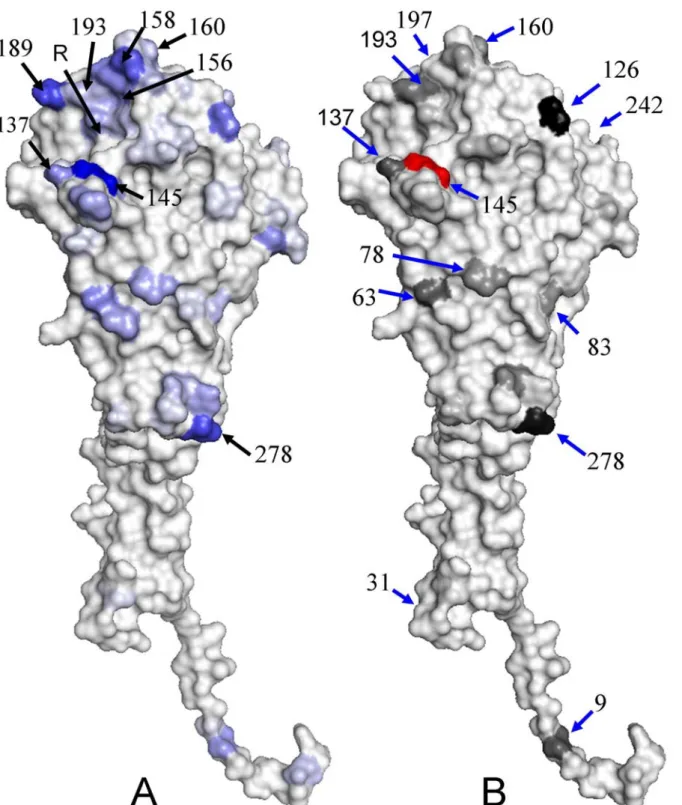
The relationship between IG values and structural locations of 329 positions is shown in Fig. 2.3A. The positions with four highest IG values (i.e. 145-A, 189-B, 278-C, and 158-B) are blue and other positions are near to gray based on the IG values. The positions with high IG values are located on the protein surface. Three (145-A 189-B and 158-B) of top four IG-value positions are located around the receptor-binding site, which is the key for neutralizing influenza virus. In addition, the high IG positions also prefer to locate on the top head, which are more exposed and preferable recognized by antibodies, of HA and on the interface between HA monomers.
Figure 2.3 The distribution of IG values and co-mutation scores on HA structure. (A) The
distribution of IG values of 329 amino acids on HA structure (PDB code 1HGF [46]) and the R indicates the receptor-binding site. The blue and gray indicate the highest IG value and the lowest IG value, respectively. (B) The structural locations and scores of 12 co-mutation positions of the position 145. These structures are presented by using PyMOL [47].
2.4.2. The rules of antigenic variants and predicting accuracies
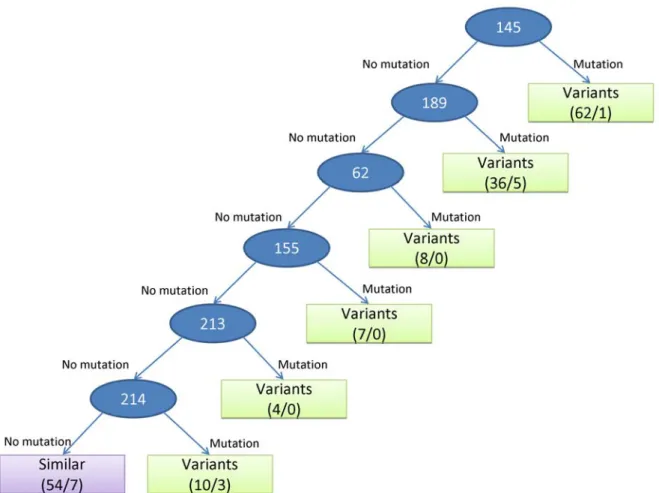
We used the decision tree (Fig. 2.4) to build a model for predicting antigenic variants of influenza A (H3N2) virus. Based on the IG values of 329 amino acid positions derived from 181 pairs in training data set, six amino acid positions are selected as internal nodes in this tree. The first rule of this tree is that the antigenic type is predicted as the antigenic variant if the position 145 is mutated, that is, the residue types of a pair of sequences on the position 145 are different. Among 181 pairs of sequences in the training set, 62 pairs can apply this rule and 61 pairs can be predicted correctly. The last rule of this tree is that the antigenic type is predicted as the similar viruses if six positions (i.e. 145, 189, 62, 155, 213, and 214) are not mutated.
Figure 2.4 The decision tree and rules for predicting antigenic variants. Each internal node
(circle) is represented as an amino acid position. The leaf node (square) includes the predicted antigenic type (i.e. "antigenic variants" and "similar viruses"), the numbers of total pairs (the first value) and predicted error pairs (the second value) by applying this rule in this node.
Based on this model, we can derive seven rules and the predicted accuracies are 91.2% (165/181) for training data set and 96.2% (30,675/31,878) for independent data set, respectively. As shown in Fig. 2.5 and Table 2.2, our method outperformed two comparative methods, i.e. Wilson & Cox (89.7%) [9] and Lee & Chen (92.4%) [40], on the independent data set. For the independent data set, the accuracies of Wilson & Cox method on predicting the antigenic variants and the similar viruses are 99.71% and 32.74%, respectively. Conversely, our model performed well for predicting the antigenic variants (99.73%) and the similar viruses (76.34%).
Figure 2.5 Comparison of our method with other two methods (Wilson & Cox [9]; Lee and Chen
Table 2.2 Comparison of our method with other methods for predicting the antigenic variants on
31,878 pairs
Antigenic variants Cox, 1990 [9] Wilson &
Lee & Chen, 2004
[40]
Our
method Similar viruses
Wilson & Cox, 1990 [9] Lee & Chen, 2004 [40] Our method HK68-EN72 (210 1) 210 206 210 HK68 (91 1) 24 52 37 EN72-VI75 (135) 135 135 135 EN72 (105) 36 79 48 VI75-TX77 (27) 27 27 27 VI75 (36) 30 36 21 TX77-BA79 (48) 48 48 45 TX77 (3) 1 2 1 BA79-SI87 (400) 400 381 400 BA79 (120) 13 46 58 SI87-BE89 (1600) 1577 863 1600 SI87 (300) 125 233 276 BE89-BE92 (3648) 3648 3648 3648 BE89 (2016) 872 1725 2016 BE92-WU95 (1596) 1542 1391 1562 BE92 (1596) 372 928 732 WU95-SY97 (448) 448 448 448 WU95 (378) 53 156 325 SY97-FU02 (96) 96 96 96 SY97 (120) 24 65 120 Other inter clusters
(18890) 18889 18870 18855 FU02 (15) 15 15 15 Number of predicted pairs 27020 26113 27026 Number of predicted pairs 1565 3337 3649 Accuracy 99.71% 96.37% 99.73% Accuracy 32.74% 69.81% 76.34%
1 the number of the pairs in the cluster.
2.4.3. Co-mutated positions for antigenic variants
Two amino acid positions may mutate simultaneously to cause antigenic drift or highly co-evolution in H3N2 virus. Understanding the co-mutation of amino acid position-pairs is one of the key steps to recognizing the antigen-antibody interactions. Here, we used the co-mutation score, S(i,j), between the position i and its co-mutated position j to measure the co-mutated pair (i ,j) for predicting the antigenic variants. We calculated all of the co-mutated combinations (i.e. 10,100 pairs) of 101 amino acid positions which mutated more than once on 181 pairs of HA sequences in the training data set.
Table 1 show the co-mutated positions of some HA positions. In this work, the position (j) is considered as the co-mutation position of the position (i) when its co-mutation z-score (i.e. Z(i,j) defined as Equation (7)) is more than 2.3 because the score of the position i and j is significant (p-value is 0.01) derived from 10,100 pairs. Among 329 positions of HA sequences, 40 positions have co-mutated positions. The number of co-mutated positions for a position ranges from 0 to 23 and the total number of the significant pairs are 308 among 10,100 pairs.
145-A are (145-A, 126-A), (145-A, 278-C) and (145-A, 137-A). The 145-A, 278-C, and 137-A are the residues to cause the transition from cluster EN72 into cluster VI75 [15]. In addition to position 145-A, the residue 156-B has 8 significant co-mutated positions (Table 2.1). Seven (except position 260-E) of these 8 positions co-mutate with 156-B to cause the transition from the cluster TX77 into the cluster BK79 [15].
Table 2.3 The number of co-mutation positions of five epitopes and the other area on HA
Epitope A Epitope B Epitope C Epitope D Epitope E Other area sum
Epitope A 15 24 8 11 16 8 82 Epitope B 19 15 6 13 13 5 71 Epitope C 15 11 3 5 9 4 47 Epitope D 12 13 3 8 6 4 46 Epitope E 13 11 4 6 7 3 44 Other area 4 2 1 3 4 4 18
Table 2.3 shows the numbers of significant co-mutation positions on six blocks, including
five epitopes and the other area on the HA. The numbers (24 and 19 pairs, respectively) of the co-mutation pairs, which located at epitopes A and B, are significantly higher than other block. This result implies that the mutation on epitopes A and B could yield a high probability to cause the antigenic drift. Moreover, residues in epitopes A and B form 82 and 71, respectively, significant co-mutation pairs which are much higher than other blocks. On the other hand, the number (i.e. 18 pairs) of significant co-mutation pairs formed by the residues in non-epitope block is the smallest among 36 combinations of six blocks (Table 2.3). These observations demonstrate that epitopes A and B are more important than other blocks and the five epitopes are more important than the other area. Previous works shows that epitopes A and B are more antigenic important since they are around the receptor-binding site [9].
0 2 4 6
126A 137A 143A 145A 146A 155B 156B 158B 160B 164B 165B 189B 193B 197B 198B 53C 54C 278C 174D 201D 213D 217D 242D 244D 62E 63E 78E 83E 260E 2_ 9_ 21_ 31_ 183_
z-sco
re
145-A 137-A 0 2 4 6126A 137A 143A 145A 146A 155B 156B 158B 160B 164B 165B 189B 193B 197B 198B 53C 54C 278C 174D 201D 213D 217D 242D 244D 62E 63E 78E 83E 260E 2_ 9_ 21_ 31_ 183_
z-s
co
re
226-D 135-A 0 2 4 6126A 137A 143A 145A 146A 155B 156B 158B 160B 164B 165B 189B 193B 197B 198B 53C 54C 278C 174D 201D 213D 217D 242D 244D 62E 63E 78E 83E 260E 2_ 9_ 21_ 31_ 183_
z-sco
re
164-B 201-DA
B
C
Figure 2.6 The co-mutation z-score distributions of six positions on the HA sequence. A position
is considered as a co-evolution residue if its z-score is more than 2.3 (i.e. the blue line).
Figure 2.6 shows the distributions of co-mutation z-scores of six HA positions. The positions
(i.e. 145-A and 137-A located in Area I in Fig. 2.2) which have high IG values and high entropies, own 12 and 23 co-mutated positions (Fig. 2.6A and Table 2.1), respectively. On the other hand,
Figure 2.6B shows two positions (i.e. 226-D and 135-A located in Area II in Fig. 2.2) , which
have low IG values and high entropies, own 2 and 1 co-mutated positions (Table 2.1), respectively. Finally, the positions 164-B and 201-D have similar distributions (Fig. 2.6C) and their correlation coefficient is 0.73. To consider both IG values and entropies provide insight to the antigenic draft and co-evolution positions on influenza virus. These observations show our method is able to identify co-mutated positions that participate in the antigenic drift for influenza seasons. These significant co-mutated positions show biological meaning.
2.5. Discussion
Previous works using genetic data for identifying highly diverse positions which are exposed to immune selection have shown prospective [33]. However, Smith et al. demonstrated that antigenic evolution is more punctuated than genetic evolution [15], which implies that only genetic data may not be enough to detect critical positions. For example, the antigenic discriminating score (i.e. IG=0.15) of position 226-D is low, while its genetic diversity (i.e. entropy is 1.0) is largest. The position 226-D is also selected as a positive selection codon [33]. According to 181 pairs in the training set, position 226-D has 61 mutations, but 27 of them are "similar viruses" pairs. Therefore, its antigenic discriminating score is low and a mutation on this position does not cause the antigenic drift. The position 121-D, which is under positive selection, has similar behaviors.
Although the HI assay can successfully detect antigenic drift, this assay is labour-intensive and time-consuming. Therefore, the quantity of HI data is far less than sequence data and sometimes the problem of bias sampling is encountered [34]. The position 164-B, which was identified by Smith et al. as a cluster-difference substitution from 253 sequences [15], has 28 mutations in 181 pairs and all of them happen in "antigenic variants" pairs. Mutations on this position (i.e. IG is 0.46) have high preference to antigenic variant. But our method didn't select this position because the genetic diversity (i.e. entropy is 0.24) of this position is not high enough.
In the independent data set (31,878 pairs), the accuracies of three methods are more than 96% for the "antigenic variants", but their accuracies on the "similar viruses" pairs are significantly different (Table 2.2). The method proposed by Wilson and Cox [9] falsely predicts 67% of "similar viruses" pairs, which implies this method is very sensitive in the same antigenic group. Comparing our model with the hamming distance (HD) model which is based on epitope positions proposed by Lee & Chen [40], our model has higher accuracies in three groups, i.e. BE89, WU95 and SY97 (Table 2.2). For example, for 2016 "similar viruses" pairs in the BE89 group, the HD model falsely predicted 291 pairs, which are correctly predicted by our model, and the average HD of these 291 pairs is 7.3. Most of these 291 pairs mutate on seven positions (i.e. 50-D, 80-E, 137-A, 159-B, 167-D, 173-D and 197-B). Except positions 137-A and 197-B, the other five positions have low antigenic discriminating scores based on our model.
position i and j have different antigenic discriminating scores. For example, the z-scores of position-pairs (133-A, 156-B) and (156-B, 133-A) are 5.03 and -1.13, respectively. Furthermore, the IG values of positions 156-B and 133-A are 0.43 and 0.11, respectively. The antigenic effect of the only mutation on position 133-A is not significant. On the other hand, the antigenic discriminating score is significant when position 133-A co-mutates with position 156-B. Among 181 pairs in the training set, position 133-A has 38 mutations; 32 of them are "antigenic variants" pairs, and 31 pairs of them co-mutate with the position 156-B. This position pair is observed to cause the transitions from cluster TX77 into cluster BK79 and from the cluster BE89 into the cluster BE92 [15].
Among 329 positions of HA sequences, 137-A, 193-B, and 160-B are top three positions with the highest numbers of co-mutated positions. The position 137-A has 23 co-mutation positions and the top three pairs are (137-A, 158-B), (137-A, 260-E) and (137A, 164-B). These four positions are observed to cause the transitions from cluster EN72 into cluster VI75 and from cluster VI75 into cluster TX77 [15].
There are total 308 significant position-pairs but only 142 pairs of them are observed in cluster-difference substitutions [15]. For example, 15 pairs with top 50 z-scores not identified as cluster-difference substitution are: (83-E, 126-A), (145-A,126-A), (193-B, 126-A), (126-A, 63-E), (278-C, 126-A), (63-E, 126-A), (137-A, 126-A) (83-E, 278-C), (193-B, 63-E), (31,9), (83-E, 63-E), (126-A, 278-C), (9,31), (275-C, 145-A) and (126-A, 145-A). Nine pairs of them could be observed in the 1976 fixation [41] in which they analyzed large amount of HA protein sequences (2248 sequences from 1968 to 2005). These observations imply our method is able to detect potential co-mutated positions related to antigenic drift from limited HI-data.
2.6. Summary
This study demonstrates our model is robust and feasible by considering both genetic and antigenic data. Based on decision tree, our method is able to identify critical amino acid positions of HA and the rules of antigenic variants for influenza H3N2 viruses. The accuracies of our method are 91.2% and 96.2% for the training set and independent data set, respectively, and our method is significantly better than the other two methods being compared on these two sets. The identified critical amino acid positions are similar to related works and the co-mutated positions are able to reflect the biological meanings. We believe that our method is useful for vaccine
Chapter 3
Changed Epitopes Drive the Antigenic
Drift for Influenza A (H3N2) Viruses
3.1. Introduction
Influenza spreads around the world and causes significant morbidity and mortality [14]. The surface proteins HA and NA are the primary targets of the protective immune system. In circulating influenza viruses, gradually accumulated mutations on the HA, which interacts with infectivity-neutralizing antibodies, lead to the escape of immune system.
Most of methods measuring the antigenic variances on HA focused on amino acid position mutations, such as hamming distance [34] or phylogenic distance [31]. Recently, few studies discuss the relationships between the antigenic sites (epitopes) and vaccine efficiency [48].
3.2. Motivation
and
aim
We have identified critical positions and rules for antigenic variants in previous chapter. However, the critical positions are widely distributed on HA structure and the antibody recognition is highly correlated to the conformation change on the epitopes, which locate on HA surface. Moreover, an antibody often utilizes complementarily-determining regions (CDRs) to bind two epitopes on the antigen (HA) [49]. To quantify a changed epitope for escaping from neutralizing antibodies is the basis for the antigenic drift and vaccine development.
Here, we have proposed a method to identify the antigenic drift of influenza A by quantifying the conformation change of an epitope. Our method is able to predict antigenic variants of a given pair of HA sequences which are often a vaccine strain and a circulating strain. Our model was evaluated to measure the antigenic drifts and vaccine updates on 2,789 circulating strains
(from year 1983 to 2008) and to predict the antigenic variants on two data sets (i.e. 343 and 31,878 HI assays). These observations demonstrate that our model is able to reflect the biological meanings and can explain the WHO vaccine strain selection.
3.3.
Materials and Methods
Figure 3.1 presents the overview of our method for the antigenic drift of influenza A (H3N2)
viruses by quantifying changed epitopes. We first identified the critical amino acid positions based on both the antigenic variant and genetic diversity. We then measured a changed epitope by calculating the accumulated conformation change based on critical amino acid mutations on an epitope. Finally, we evaluated our model for predicting antigenic variants and selecting the WHO vaccines.
A
B
125 HA
sequences
343 HI
assays
Pairwise sequence
alignment
Classify
antigenic type
Training set
(343 HI assays)
Calculate information gain (IG)
and entropy of each amino
acid position
Identify changed epitopes
for predicting “antigenic variants”
Evaluate the changed epitopes on the
2789 sequences and independent set
with 31,878 HI measurements
155 137 156 158 159 131 189193 186 135 145 126 133 124 122 62 63 83 278 54 50 121 188 160 144Figure 3.1 Overview of our method for the antigenic drift. (A) The overview of our method. (B)
The structural locations of selected 64 critical amino acid positions on all the five epitopes (Epitope A in red; B in purple; C in orange; D in cyan; E in green). The sialic acid is in green. All
3.3.1. Changed
epitopes
The changed epitope is the core of our method. Here, we defined a changed epitope as follows: an antigenic site (epitope) on HA with accumulated amino acid mutations induces the conformation change to escape from the neutralizing antibody. The conformation change of a mutation depends on its position on HA structure and the mutation rate during 40 years. A changed epitope can be considered as a "key feature" for measuring antigenic variants of a pair of HA sequences. Here, a changed epitope can be used to predict antigenic variants and antigenic drifts for the selections of vaccine strains.
3.3.2. Data
sets
To describe and evaluate the ability of the changed epitopes for predicting antigenic variants, we collected HI assays, describing the antigenic variants and similar viruses of the current global influenza surveillance system. The HI assay describes whether one (e.g. circulating) strain will be recognized by an antibody against the vaccine strain. We collected 343 H3N2 virus HI assays with 125 HA sequences from Weekly Epidemiological Record (WER) [50] (Table 3.1), World Health Organization (WHO) collaborating center [51] and related publications [52-54]. Each pair includes an HI assay value (i.e. antigenic distance) and a pair of HA sequences (329 amino acids). In general, an influenza vaccine should be updated if an antigenic distance is more than 4.0 between the current vaccine strain and the circulating strain in next season [15] [55]. Among 343 pairs of HA sequences, 225 pairs with antigenic distance ≥ 4 are considered as "antigenic variants" and 118 pairs are considered as "similar viruses". For example, the antigenic distance of the pair of HA sequences, A/England/42/72 and A/PortChalmers/1/73, is 12 and this pair is considered as "antigenic variants". Conversely, the antigenic distance of the pair of HA sequences, A/Wuhan/359/95 and A/Nanchang/933/95, is 1 and this pair is considered as "similar viruses". In addition to the training set, we prepared another HI assay data set to independently evaluate our model for predicting antigenic variants proposed by Smith et al. [15]. We assume that a virus-pair in the same antigenic group is considered as a "similar viruses" pair and a virus-pair in different groups is considered as "antigenic variants" pair. Finally, we obtained 31,878 HI measurements from the supporting materials [15].
To study the antigenic drifts and WHO vaccine updates, we collected 2789 HA sequences with influenza season assignment from influenza virus resource [36] and influenza sequence
database [35].
Table 3.1 The number of HI assays, number of sequences in Smith's dataset and WER strains
from 1968 to 2007
Year HI assay data set Number of strains WER strains2
1968 0 4 A/Hong Kong/1/68 1969 0 3 A/Hong Kong/1/68 1970 11 [50] 2 A/Hong Kong/1/68 1971 2 [50] 4 A/Hong Kong/1/68 1972 2 [50] 5 A/Hong Kong/1/68 1973 2 [50] 4 A/England/42/72 1974 3 [50] 5 A/Port Chalmers/1/73 1975 6 [50] 3 A/Port Chalmers/1/73 1976 7 [50] 6 A/Victoria/3/75 1977 4 [50] 5 A/Victoria/3/75 1978 0 0 A/Texas/1/77 1979 0 0 A/Texas/1/77 1980 6 [50] 2 A/Bangkok/1/79 1981 0 1 A/Bangkok/1/79 1982 3 [50] 4 A/Bangkok/1/79 1983 5 [50], 23[53] 1 A/Phillipines/2/82 1984 0 1 A/Phillipines/2/82 1985 3 [50] 4 A/Phillipines/2/82 1986 9 [50] 2 A/Christchruch/4/85, A/Mississippi/1/853 1987 3 [50] 3 A/Leningrad/360/86 1988 17 [50] 4 A/Sichuan/2/87 1989 0 16 Si/87; Sh/873 1990 10 [50] 5 A/Shanghai/11/87 1991 5 [50] 17 A/Beijing/353/89 1992 5 [50] 45 A/Beijing/353/89 1993 21 [50] 43 A/Beijing/32/92 1994 6 [50] 10 A/Shangdong/9/93 1995 3 [50], 20 [52] 15 A/Johannesburg/33/94 1996 12 [50] 10 A/Johannesburg/33/94 1997 28 [56] 9 A/Wuhan/359/95 1998 3 [50] 4 Wu/95; Sy/973 1999 2 [50] 3 A/Sydney/5/97 2000 0 1 A/Moscow/10/994 2001 11 [54] 3 A/Moscow/10/99 2002 0 3 A/Moscow/10/99 2003 11[50], 20 [51] 6 A/Moscow/10/99 2004 4 [50], 17 [51] 0 A/Fujian/411/2002 2005 14 [50],1 [51] 0 A/Calfornia/7/2004 2006 11 [50], 9 [51] 0 A/Wisconsin/67/2005 A/Calfornia/7/2004; 2007 3 [50], 31 [57] 0 A/Wisconsin/67/2005; A/Brisbane/10/2007
Total 343 pairs 253 sequences
1 the number of HI assays collected in the document.
2 we followed Plotkin's definition [34], WER strains were the dominant recommended virus based on HI assays in
influenza season, as reported by the WHO in Weekly Epidemiological Record (WER).
3 for the purpose of detecting emerging variants, the later strain was selected to comparing with circulating strains. 4 the wildly used vaccine strain A/Panama/2007/99 was used instead in following years.

![Figure 2.5 Comparison of our method with other two methods (Wilson & Cox [9]; Lee and Chen](https://thumb-ap.123doks.com/thumbv2/9libinfo/7509641.117495/29.892.131.792.408.858/figure-comparison-method-methods-wilson-cox-lee-chen.webp)