Corporate governance, growth opportunities,
and the choices of cross-listings: The case of
Chinese ADRs
Lee-Hsien Pan
a, Chien-Ting Lin
b,⁎
, Pei-Chi Yang
caDepartment of Accounting and Information Technology, National Chung Cheng University, Chia Yi, Taiwan bSchool of Accounting, Economics, and Finance, Deakin University, Burwood, Victoria, Australia
c
Graduate Institute of Finance, National Chiao Tung University, Hsin Chu, Taiwan
a r t i c l e i n f o
a b s t r a c t
Article history:
Received 3 September 2012 Accepted 7 July 2013 Available online 17 July 2013
We examine the inter-relationships among internal governance,firm attributes, and the listing choices of American Depositary Receipts (ADRs) for Chinesefirms. We find that Chinese ADRs exhibit better performance, higher growth opportunities, and stronger internal governance than domesticfirms prior to and after ADR listings. Furthermore, we find that the listing choices are influenced by Chinesefirms' growth opportunities and internal governance. Those with lower growth opportunities tend to choose a Level 1 listing that restricts capital-raising but does not require U.S. regulatory compliance. In contrast, those with higher growth opportunities prefer a Level 3 listing that permits public offerings but requires full regulatory compliance. As a result, the improvement in the internal governance of Level 3 ADRs is more pronounced than that of Level 1 ADRs in the post-listing period. This suggests that the extent of improvement in governance is related to thefirm attributes and the motivations behind cross-listings.
© 2013 Elsevier B.V. All rights reserved. JEL classification: G34 M41 Keywords: Chinese ADRs Firm characteristics Corporate governance Cross-listings 1. Introduction
Firms generally benefit from overseas listings. They not only circumvent regulatory barriers and lower information asymmetry (Alexander et al., 1987) for overseas investors but also reduce agency conflicts (Lel and Miller, 2008), improve disclosure standards (Domowitz et al., 1997), and strengthen governance practices (Doidge et al., 2009b). As a result, cross-listingfirms tend to experience lower cost of capital or
⁎ Corresponding author. Tel.: +61 3 9244 6872; fax: +61 3 9244 6034. E-mail address:Edlin@deakin.edu.au(C.-T. Lin)
0927-538X/$– see front matter © 2013 Elsevier B.V. All rights reserved.
http://dx.doi.org/10.1016/j.pacfin.2013.07.002
Contents lists available atScienceDirect
Paci
fic-Basin Finance Journal
higherfirm valuation.Karolyi (2006)finds that among the 2300 internationally cross-listed stocks by the end of 2002, more than 2000 are cross-listed on U.S. exchanges. The preference for U.S. markets is not surprising given the size of its capital market, the quality of law enforcement, and the more stringent disclosure requirements.
Much of the literature that investigates cross-listings in the U.S., however, overlooks the type of listings available for afirm to choose. Under the American Depositary Receipt (ADR) program, there are four listing options—Level 1, Level 2, Level 3, and Rule 144A. They vary in terms of access to U.S. capital markets and governance and disclosure requirements. The benefits of cross-listings can therefore differ substantially depending on the option chosen. Consequently, choosing an ADR program is important when afirm decides to cross-list in the U.S. For example, afirm with high growth opportunities seeking a larger investor base may prefer the Level 3 program, which permits public offerings but requires full compliance with U.S. regulatory standards. However, a firm with low growth opportunities and weaker governance (i.e., incur high compliance costs) may choose the Level 1 program, which restricts equity raising but does not require U.S. regulatory compliance. Examining the listing choice may therefore provide further insights into different motivations behind cross-listings, which in turn are related to internal governance andfirm attributes.
Extending the current literature, this paper investigates the inter-relationships among Chinesefirms' internal governance,firm attributes, and the choice of ADR listings. More specifically, we seek to answer the following three related questions. First, are Chinese ADRs characterized by superiorfirm performance, higher growth potential, and stronger internal governance than their domestic counterparts prior to the ADR listing period? Second, do Chinese ADRs continue to improve their governance practices in the U.S. governance environment in the post-listing period? Third, how do the internal governance andfirm attributes of Chinese ADRs influence their listing choice, if any, to gain desirable benefits from cross-listings?
The answers to these questions should add to the literature on the benefits of cross-listings in the following ways. First, previous studies examining the relationship between firm performance and corporate governance are often plagued by the endogeneity problem. Since cross-listings in a stronger governance environment are an exogenous event that isolates the effect of governance from that offirm performance, our investigation into the relationship prior to and after the ADR listings should mitigate this problem. Our study could therefore shed more light on the changes in governance andfirm performance. Second, China has recently become the second largest economy in the world, and an increasing number of Chinesefirms have cross-listed in the U.S. Interestingly, the number of Chinese ADRs has more than doubled from previous years combined during the globalfinancial crisis (GFC) from 2007 to 2009.1It
appears that the GFC has had little impact on the benefits of cross-listings for Chinese firms asZhang and King (2010)suggest that they continue to be successful and exhibit higher growth and returns during the crisis period. It follows that as the Chinese economy continues to grow, morefirms will seek cross-listings. More importantly, China provides a unique institutional background where the majority of publicly listed firms are state-owned enterprises (SOEs). Since SOEs are less likely to experience external financing constraints and therefore seek external capital, examining how state ownership affects the choice of ADR listings would be an interesting investigation.
Third, although earlier studiesfind that firms bond themselves by cross-listing in a stronger governance regime, thus improving their governance practices, the studies could not examine the extent of the improvement in governance acrossfirms in the post-listing period. Linking the choice of ADR programs with different regulatory compliance tofirm attributes of cross-listed firms makes it possible to explain why Chinese ADRs might differ in their post-listing governance practices. Thefindings in this study should therefore enhance our understanding of the differential impacts of cross-listings onfirms' internal governance.
Consistent with earlier studies, wefind that Chinese ADRs are on average larger and less financially leveraged, and experience higher returns and growth rates than domestic firms before cross-listing. Chinesefirms also exhibit stronger governance structure in the form of smaller boards, a higher proportion of independent directors, insider ownership, and institutional ownership. Within cross-listed firms, although there is little difference in governance measures, Level 3 ADRs tend to exhibit a higher growth rate than Level 1 ADRs. This may explain why Chinesefirms with higher growth potential and thus greater externalfinancing needs tend to choose the Level 3 program.
1
Since 1993, almost all Chinesefirms have chosen either Level 1 listing or Level 3 listing when they first participate in the ADR programs. Among Chinese ADRs, 55% and 41% of thefirms choose Level 1 and Level 3, respectively. The former restricts capital-raising while the latter permits capital-raising with full U.S. regulatory compliance. Our results therefore differ from those ofBoubakri et al. (2010)who report that ADR firms from other countries prefer the 144A and Level 3 programs that offer access to U.S. capital markets. One potential explanation for the difference between ourfindings is that 39% of Chinese ADRs are SOEs. Since they have less need for externalfinancing, 59% of the SOEs choose Level 1 compared to 13% for Level 3.
Our results imply that unlike non-Chinese ADRs, the capacity to raise external capital is not necessarily the primary motive for Chinesefirms to cross-list in the U.S. One reason is that many large Chinese firms are controlled by the State and therefore do not need to seek external capital. To remain controlled by the State, SOEs are also less likely to raise new equity. In recent years, Chinesefirms have had alternative avenues in raising capital such as cross-listing as H-shares in Hong Kong. Therefore, alternative motives such as“bonding” in a more stringent legal regime, increased investor base, and market expansion appears to be just as important for Chinesefirms for cross-listings.
As expected, wefind that Chinese ADRs in a strong governance environment continue to outperform domesticfirms and exhibit stronger governance mechanisms in the post-listing period. The Chinese firms are characterized by a smaller board, a higher proportion of independent directors, and insider and institutional ownership. For Chinese ADRs in the post-listing period, Level 3 ADRs experience an increase in insider ownership but a decline in institutional ownership compared to Level 1 ADRs. The latter may arise as share ownership becomes more diffused after new external capital is issued. Our results suggest that the post-listing divergence of governance among Chinese ADRs is directly related to the different requirements for regulatory compliance between Level 1 and Level 3. The choice between these two ADR types, however, can in turn be traced tofirm attributes and, thus, the motivations behind the cross-listings.
The remainder of the paper is organized as follows.Section 2discusses motivations for cross-listing and hypotheses development.Section 3describes the sample and methodology. Empirical results are reported inSections 4, and 5concludes the paper.
2. Motives and choices of ADR listings and hypotheses development
Generally, there are two channels by which corporate governance affectsfirm value. First, firms with stronger governance are associated with betterfirm performance due to a higher return on assets (Core et al., 2006) and higher growth opportunities (Hutchison and Gul, 2004).Ho et al. (2004)show that high insider ownership positively influences corporate policies for growth firms by alleviating the intensity of monitoring mechanisms, which in turn lower agency costs. Second,firms with stronger governance are related to the lower cost of equity capital. Albuquerque and Wang (2008)and Chen et al. (2011) demonstrate that strong governance reduces the agency cost of free cashflows and therefore the cost of equity. Based on these standard finance theories, we develop three testable hypotheses of governance and firm attributes in relation to the listing choices. Meanwhile, wefirst briefly describe the listing choices available under the ADR programs.
For cross-listing as ADRs, foreignfirms can choose one of four listing types that vary in regulatory compliance and equity offerings. Listing in Rule 144a and Level 3 allows access to primary capital from qualified institutional investors and public offerings, respectively. In contrast, Levels 1 and 2 do not permit raising capital. In terms of regulatory compliance, ADRs in Levels 2 and 3 are subject to the same disclosure and governance requirements as for U.S.firms including those of the Sarbanes Oxley Act (SOX). However, Rule 144A and Level 1 ADRs are not required to meet the same regulatory compliance and may continue to use home country reporting and governance standards. Given the benefits and requirements of each ADR program, firms are likely to choose a particular ADR program that reflects their needs, governance practices, and firm attributes.
2.1. Information disclosure and signaling hypothesis
One advantage for a foreignfirm to cross-list in the U.S. is that doing so offers a more stringent legal and regulatory environment in which investors have access to higher-quality information disclosure and governance standards (Burns et al., 2007). It is therefore particularly appealing for Chinese firms to cross-list in the U.S. asAllen et al. (2005)point out that the legal and accounting systems in China lag its economic development. Another benefit highlighted byLang et al. (2003) and Karolyi (2006)is that
cross-listedfirms receive wide coverage by analysts and attract institutional investors that are likely to be more active by investing more resources in monitoring thosefirms.
Eachfirm that considers cross-listing under the ADR programs in a strong governance environment should weigh the benefits of cross-listing against the costs of regulatory compliance especially after the passage of SOX. Benos and Weisbach (2004) suggest that a cross-listed firm signals to investors its commitment to improve and/or maintain strong governance practices and transparency. Conversely, afirm with poor governance mechanisms mayfind little incentive to cross-list.Zhang and King (2010)highlight that cross-listedfirms are also subject to listing rules that require minimum market capitalization and profitability. Given that these requirements exceed those imposed by the stock exchanges in China, Chinese ADRs are likely to be characterized not only by stronger governance but also by more favorablefirm attributes than domesticfirms. We therefore develop the first hypothesis as follows:
H1. Chinese ADRs tend to be larger, more profitable, and practice stronger governance than the domestic matchedfirms prior to cross-listing.
2.2. Bonding hypothesis
La Porta et al. (1998, 2000, 2002)examine the importance of external governance around the world and document that countries with common laws provide better investor protection than those with civil laws. Theyfind that firms in common law regimes such as those in the U.S. enjoy a higher valuation of assets due to the legal regime and effective law enforcement. It follows that afirm from a weaker investor protection regime may choose to cross-list in a market with a more stringent legal regime. Known as the bonding hypothesis, managers bond themselves to reduce the private benefits of control, which in turn lowers principal–agency conflict and the cost of equity.
Consistent with the bonding hypothesis,Stulz (1999)finds that firms from weaker investor protection regimes voluntarily choose to cross-list in markets with stronger shareholder protection. In a similar vein, Reese and Weisbach (2002)show that better shareholder protection facilitates the access offirms from weaker legal environments to more external capital. After SOX was passed,Doidge et al. (2009a)report that cross-listingfirms in the U.S. experience a higher price premium than those in the UK. They interpret the result as investors recognizing additional governance benefits related to SOX. These discussions lead to the second hypothesis on whether Chinesefirms' governance practices and firm performance improve after ADR listing by bonding in the stronger external governance environment.
H2. Chinese ADRs' governance mechanisms andfirm performance improve during the post-listing period. 2.3. The choice of ADR programs
Another important issue arises regarding which type of ADR program afirm should choose when it decides to cross-list in the U.S. Thefirm must weigh the benefits of capital-raising and/or bonding against the costs of regulatory compliance for each ADR program such that the ADR choice is optimal.Boubakri et al. (2010)suggest that afirm's decision to choose which ADR program is influenced by the attributes and institutional background of thefirm's home country. Since the scope of our study includes only Chinese firms, we focus on whether the choice of ADR program is related to their internal governance and firm attributes.
Chinesefirms with high growth opportunities generally need external financing. Thus, the firms will choose either Rule 144A or Level 3 since both programs allow them to access external capital in the U.S. Coupled with good governance, thefirms are more likely to choose Level 3 rather than Rule 144A program as regulatory compliance costs may not be as high as those with poor governance mechanisms. Furthermore, Chinesefirms that may also be seeking a higher profile and a larger investor base may prefer Level 3 listing in which external capital is raised through public offerings rather than private placements under the Rule 144A program. Based on these discussions, thefirst part of the third hypothesis is as follows:
H3a. Chinesefirms with higher growth opportunities and stronger governance tend to choose Level 3 listing.
Conversely,firms with fewer growth opportunities or the need for external capital may not find it necessary to list in the Rule 144A or Level 3 program. This especially applies to state-owned enterprises (SOEs), which are less likely to experience externalfinancing constraints. SOEs are more likely to choose Level 1 or Level 2 listing that restricts raising capital. Between these two types of listing, Chinesefirms may prefer Level 1 over Level 2 because the latter is more costly to comply with regulatory standards. This leads to the second part of the third hypothesis:
H3b. Chinese firms with fewer growth opportunities and weaker governance tend to choose Level 1 listing.
3. Data and variable definition 3.1. Data
We obtain information on all Chinese ADRs listed on NYSE, AMEX, and NASDAQ from the four major ADR depositaries: The Bank of New York (BNY), Citibank (CB), Deutsche Bank (DB), and JPMorgan Chase (JPM) from 2003 to 2009.2We manually collect information about the corporate governance andfirm
characteristics of ADRs and their matched firms from the SEC filing (20-K), DataStream, Compustat, Taiwan Economic Journal (TEJ), China Center for Economic Research (CCER), and company websites. These multiple data sources allow us to cross check the accuracy of thefirm-level information.
We obtain a total of 201 Chinese ADRs for our initial sample as reported inTable 1. However, we remove 26 ADRs from thefinance and insurance sectors that are required to comply with additional financial regulations. We also exclude 14 ADRs due to missing information. Our final sample yields 161 ADRs and 567firm-year observations in which 88 ADRs (55%) are listed in Level 1 and 69 (43%) in Level 3. Thus, only three ADRs are listed in Rule 144A and one in Level 2, which suggests that Chinesefirms have little interest in these two types of listing.
Another interesting observation from the sample is that the majority of Chinese ADRs do not seek new external capital in the U.S. as more ADRs are listed in Level 1 than in Level 3. This is especially the case in 2008 and 2009 where there are 65 Level 1 listings compared to 11 Level 3 listings. It therefore challenges the conventional wisdom that raising external equity is the primary reason for cross-listings in the U.S. At least for Chinese ADRs, other motivations play an important role in cross-listing decisions.
Table 2presents the distribution of sample ADRs by listing type and industry. The table shows that various industries are represented by Chinese ADRs, ranging from energy and retail to software industries. The largest industrial groups for ADRs are raw materials, capital goods, and hardware and equipment. However, each industrial group represents about 13% of the total sample. The decisions to cross-list appear not to be skewed to one particular industry and are therefore not driven by industry effect.
To select matchedfirms for Chinese ADRs for our subsequent empirical analysis, we use firm size and industry type according toAllen and Phillips (2000)andAyyagari and Doidge (2010). For industry type, wefirst convert the four-digit standard industrial classification code (SIC) to the four-digit global industry classification standard code (GICS) since the latter is commonly used for classifying domestic Chinese firms. We then sort and assign each matched firm for each sample ADR by industry type and firm size. 3.2. Variable definitions
We usefive well-known governance variables to measure the governance practices of Chinese ADRs. The variables include board size (Yermack, 1996;Linck et al., 2008), the percentage of independent directors (Boon et al., 2007), CEO duality (Basu et al., 2007;Bhagat and Bolton, 2008), insider ownership (McConnell et al., 2008), and ownership concentration, a Herfindahl index based on the sum of the square of top 10 shareholder ownership (Kutsuna et al., 2002).
We use four common measures forfirm characteristics. They include return on assets (ROA) for firm performance, debt-to-equity ratio (debt/equity) forfinancial leverage, the change in assets from the
2
The corporate governance andfirm-specific information in our sample is based on year-end data. The effective listing dates of all samplefirms in 2009 are before December 31. Therefore, we examine firms listed in 2009.
previous year's assets for afirm's growth opportunities, and the natural log of assets for firm size. Each firm characteristic and governance variable is defined inTable 3.
4. Empirical results
4.1. Summary statistics of Chinese ADRs
Table 4shows the descriptive statistics of the governance measures andfirm characteristics of Chinese ADRs. For the number of board directors, the average number is 8.49, which falls within the preferred board size of eight or nine recommended byLipton and Lorsch (1992).3However, the number varies
widely between four and 15 with a standard deviation of 2.74.Coles et al. (2008)suggest that complex firms that tend to be larger and rely more on debt may need more board advising. These variations thus reflect the large difference in size and complexity among Chinese ADRs that range from 4.21 to 19.17 in Ln(assets) and from 0% to 56.78% in debt/equity.
The average proportion of independent directors is 46%, which is higher than the one-third rule for independent directors required by the corporate regulations of the China Securities Regulatory Commission
Table 1
Sample selection and screening process for Chinese ADRs from 2003 to 2009.
Rule144A Level 1 Level 2 Level 3 Total
Initial number offirms 6 110 3 82 201
Number offirms in financial and insurance industries 1 19 2 4 26
Number offirms with missing data 2 3 0 9 14
Final number offirms in the sample 3 88 1 69 161
Final number offirm-year observations 17 246 5 299 567
Table 2
Sample Chinese ADRs by industry and ADR classification. This table presents the distribution of the industries of the sample Chinese ADRs and their listing type.
Industry type GICS code ADR type Total Percent
Rule 144A Level 1 Level 2 Level 3
Energy 1010 6 3 9 5.59
Raw material 1510 2 15 5 22 13.66
Capital goods 2010 1 19 2 22 13.66
Business and service 2020 4 10 14 8.70
Transportation 2030 6 3 9 5.59
Auto and parts 2510 2 2 1.24
Consumer durables and clothes 2520 1 3 4 2.48
Consumer service 2530 3 2 5 3.11
Media 2540 1 1 0.62
Retails 2550 13 13 8.07
Food and major retail items 3010 4 4 2.48
Food, beverage, and tobacco 3020 2 2 1.24
Medicare equip and service 3510 4 9 13 8.07
Software & service 4510 2 11 13 8.07
Hardware & equip 4520 4 1 16 21 13.04
Telecommunications 5010 3 4 7 4.35
Total 3 88 1 69 161 100.00
3
Thefinancial crisis during 2007–2009 has lesser impacts on Chinese firms choosing to cross-list in the U.S. since these firms (listed either before or during thefinancial crisis) are quite successful and continue to exhibit higher growth and returns during 2007–2009 (Zhang and King, 2010).
(CSRC) since 2003. However, the proportion falls below the average proportion of 65% (Cheng, 2008) and 62% (Boon et al., 2007) of IPOfirms in the U.S. This suggests that Chinese firms that successfully cross-list in the U.S. have room to improve in this particular aspect of governance.
Interestingly, more than half of the CEOs in Chinese ADRs also serve as chairman of the board. A further investigation reveals that the Chinese State Economic and Trade Commission (CSETC) has banned the CEO duality role for SOEs since 2000. Based on the ruling,Bai et al. (2004)report that the percentage of Chinese firms characterized by CEO duality has steadily declined from approximately 60% in the early 1990s, to 30% in the late 1990s, and eventually to 10% in the early 2000s. Given that 61% of the sample ADRs are non-SOEs and are not subject to the rule of separation of CEO and chairman, it is not surprising that the proportion of Chinese ADRs with CEO duality remains high. However, share ownership appears to be highly concentrated. Managers and top 10 institutional investors, which include state institutions, own 21% and 61% of the total shares outstanding, respectively. The large managerial ownership is consistent with the fact that the majority of Chinese ADRs are non-SOEs.
Finally,Table 4shows that Chinese ADRs, on average, experience high return on assets (ROA = 7%), low leverage (D/E = 0.77), and high growth rates (asset growth of 41%). The results reinforce the views thatfirms that successfully meet the U.S. cross-listing requirements are more likely to be growth oriented with good fundamentals. They are also consistent with some of the motivations behind cross-listings—bonding, externalfinancing, and market expansion.
Table 3
Variable definitions. This table defines each of the governance and firm characteristics for the sample ADRs.
Variable Abbreviation Definition
Governance variables
Board size Board size The number of directors on the board Percent of independent
directors on board
Percentage of independent Number of independent directors/total number of directors
CEO duality CEO duality Dummy variable equals one when CEO is also the chairman of the board and zero otherwise Insider ownership Insider ownership Shares owned by the management/total shares
outstanding
Top 10 institutional investors Top10 investors Shares owned by Top 10 institutional investors/total shares outstanding
Firm characteristics
Return on assets ROA Net income/book value of assets
Asset growth Asset growth (Assets this year− assets previous year)/assets previous year
Debt to equity ratio Debt/equity Debt value/book value of equity Asset size Ln (Assets) Natural log of book value of assets
Table 4
Summary statistics of Chinese ADRs from 2003 to 2009. This table presents the summary statistics of the corporate governance and firm characteristics of Chinese ADRs from 2003 to 2009.
Variable Mean Standard deviation Minimum Maximum N
Corporate governance Board size 8.49 2.74 4.00 15.00 549 Independent 0.46 0.16 0.00 1.00 549 CEO duality 0.56 0.57 0.00 1.00 537 Insider ownership 0.21 0.23 0.00 0.82 445 Top 10 investors 0.61 0.25 0.03 1.00 535 Firm characteristics ROA 0.07 0.12 −0.92 0.73 525 Debt/equity 0.77 3.14 0.00 56.84 498 Asset growth 0.41 1.18 −0.52 12.83 480 Ln(Asset) 13.12 2.46 4.21 19.17 524
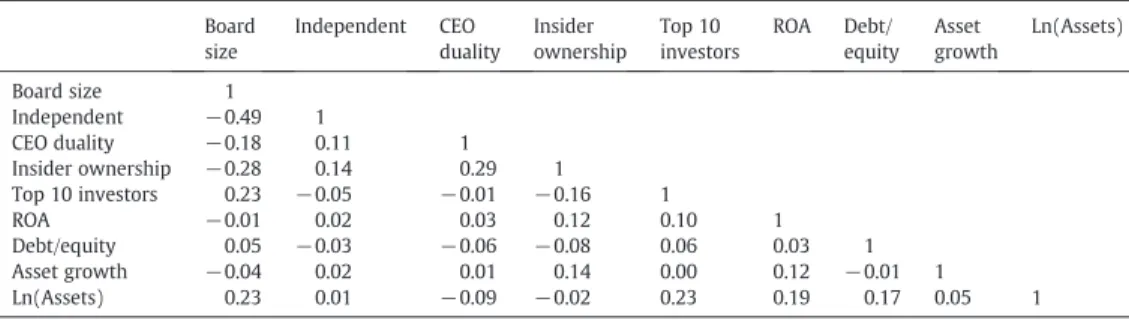
To check for multicollinearity among explanatory factors, we estimate the correlations between them. Table 5shows that the correlations are generally low between each pair of variables and therefore do not pose potential multicollinearity problems. One notable correlation, however, is between board size and the proportion of independent directors where the correlation is−0.49. The higher correlation indicates that Chinese ADRs with larger boards tend to associate with relatively fewer independent directors. One could therefore use either of the two measures for the degree of board monitoring of managers. Between firm characteristics and governance measures, correlations appear to be low. They vary from −0.09 between Ln(assets) and CEO duality to 0.23 between Ln(assets) and ownership concentration. Overall, the correlation results seem to suggest that these proxies adequately capture various dimensions of governance practices andfirm characteristics of the sample ADRs.
4.2. Comparisons of Chinese ADRs and matchedfirms prior to and after cross-listing
We begin by comparing the governance mechanisms andfirm characteristics of Chinese ADRs and matchedfirms prior to and after cross-listing with the following logistic regression estimates,
ADR¼ f governance variables; firm characteristics; and control variablesð Þ ð1Þ where the dependent variable ADR is a binary variable that equals one for ADRs and zero for matchedfirms. The governance variables are board size, percentage of independent directors, CEO duality, insider ownership, and top 10 institutional ownership. Thefirm-specific characteristics variables are ROA, leverage, asset growth rate, andfirm size. We also include year and industry dummy variables as control variables.
Table 6shows that Chinese ADRs exhibit strong governance mechanisms in the form of a smaller board, a higher percentage of independent directors, and higher insider ownership 1 year prior to cross-listing. However, it is more common for the CEO to serve as the board chairman in a Chinese ADR than in a matchedfirm. As discussed earlier, this result is likely to be driven by the unique regulatory requirement for SOEs that restrict the CEO duality. Given that there are more SOEs in the matchedfirms, the proportion of CEO duality is higher in the Chinese ADRs than in the matchedfirms.
As expected, the Chinese ADRs are also larger than their matchedfirms. This difference may in part be due to the minimum market capitalization and net income requirement set by U.S. exchanges. The Chinese ADRs also experience higher ROA, asset growth, and lowerfinancial leverage prior to cross-listing. These results are consistent with the prevalentfinance theories that cross-listing firms are more likely to seek external capital, expansion, and a stronger external governance environment.
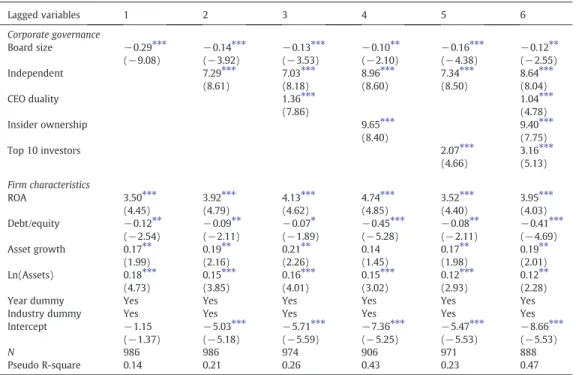
In the post-listing period,Table 7shows that the Chinese ADRs continue to exhibit stronger governance behavior than the matchedfirms. The Chinese ADRs tend to be associated with smaller boards (board size) and a higher proportion of independent board directors (independent), measures that indicate stronger board governance and more transparency. Furthermore, the managers (insider ownership) of the Chinese ADRs continue to have a higher proportion of shares and ownership concentration (top 10 investors).
Table 5
Correlations betweenfirm characteristics and corporate governance variables. This table presents the correlation coefficients between each pair of governance andfirm characteristics measures.
Board size Independent CEO duality Insider ownership Top 10 investors ROA Debt/ equity Asset growth Ln(Assets) Board size 1 Independent −0.49 1 CEO duality −0.18 0.11 1 Insider ownership −0.28 0.14 0.29 1 Top 10 investors 0.23 −0.05 −0.01 −0.16 1 ROA −0.01 0.02 0.03 0.12 0.10 1 Debt/equity 0.05 −0.03 −0.06 −0.08 0.06 0.03 1 Asset growth −0.04 0.02 0.01 0.14 0.00 0.12 −0.01 1 Ln(Assets) 0.23 0.01 −0.09 −0.02 0.23 0.19 0.17 0.05 1
Consistent with prior to cross-listings, the Chinese ADRs are on average larger, with higher ROA and asset growth but a lower debt ratio. Our results, which are robust to a number of logit regression estimates, therefore support thefirst hypothesis that Chinese ADRs tend to be larger, more profitable, and more growth oriented than domesticfirms.
4.3. Post-listing changes within Chinese ADRs and matchedfirms
Following thefindings that Chinese ADRs exhibit stronger governance and favorable firm attributes than matchedfirms prior to and after cross-listing, we next examine if there are changes in governance andfirm attributes from the pre-listing to posting-listing periods. Panel A inTable 8shows that Chinese ADRs on average improvefirm profitability (ROA) after cross-listing in the U.S. They also have lower CEO duality and higher institutional ownership. Therefore,“bonding” becomes more apparent with an increase in institutional ownership and in the separation of CEO and chairman. These results are consistent with the view that Chinese ADRs with more growth opportunities benefit from a stronger governance environment in the post-listing period. Accordingly, the improvement in internal governance mechanisms should lead to a reduction in agency costs that in turn positively affectsfirm performance.
In contrast, Panel B shows that there is little evidence of post-listing changes infirm performance (ROA) and governance mechanisms for the domestic matchedfirms. This finding implies that without a strong governance regime,firms have less incentive and are less likely to strengthen their governance
Table 6
Logit regressions of ADRs and non-ADRs on governance measures andfirm characteristics before cross-listing. This table presents the results of the logit regressions of the ADR listing on the governance measures andfirm characteristics before ADR listing between 2003 and 2009. The dependent variable takes a value of one for ADR listing and zero for non-ADR listing.
Lagged variables 1 2 3 4 5 6 Corporate governance Board size −0.36⁎⁎⁎ (−4.70) −0.22⁎⁎ (−2.44) −0.15⁎ (−1.61) −0.29⁎⁎ (−2.51) −0.20⁎⁎ (−2.21) −0.22⁎ (−1.77) Independent 9.08⁎⁎⁎ (3.92) 9.53⁎⁎⁎ (3.74) 13.15⁎⁎⁎ (3.99) 8.85⁎⁎⁎ (3.65) 12.37⁎⁎⁎ (3.25) CEO duality 1.41⁎⁎⁎ (3.49) 1.61⁎⁎⁎ (2.86) Insider ownership 16.71⁎⁎⁎ (3.84) 17.62⁎⁎⁎ (3.42) Top 10 investors 3.28⁎⁎⁎ (2.74) 2.32 (1.38) Firm characteristics ROA 12.86⁎⁎⁎ (5.10) 12.94⁎⁎⁎ (5.07) 14.63⁎⁎⁎ (5.29) 9.22⁎⁎⁎ (3.80) 11.36⁎⁎⁎ (4.41) 10.76⁎⁎⁎ (4.20) Debt/equity −0.42⁎⁎⁎ (−4.46) −0.35 ⁎⁎⁎ (−3.42) −0.36 ⁎⁎⁎ (−3.41) −0.37 ⁎⁎⁎ (−3.35) −0.35 ⁎⁎⁎ (−3.46) −0.41 ⁎⁎⁎ (−3.38) Asset growth 0.35⁎⁎ (2.54) 0.41⁎⁎⁎ (3.00) 0.43⁎⁎⁎ (3.15) 0.45⁎⁎⁎ (2.63) 0.41⁎⁎⁎ (2.97) 0.49⁎⁎⁎ (2.64) Ln(Assets) 0.65⁎⁎⁎ (5.33) 0.57⁎⁎⁎ (4.42) 0.65⁎⁎⁎ (4.63) 0.71⁎⁎⁎ (4.01) 0.57⁎⁎⁎ (4.18) 0.83⁎⁎⁎ (4.21)
Year dummy Yes Yes Yes Yes Yes Yes
Industry dummy Yes Yes Yes Yes Yes Yes
Intercept −23.47 (−0.01) −25.92 (−0.02) −28.94 (−0.02) −32.25 (−0.02) −27.00 (−0.02) −37.75 (−0.02) N 388 388 385 369 375 365 Pseudo R-square 0.35 0.40 0.43 0.57 0.43 0.60
⁎ Denotes statistical significance at the 10% level. ⁎⁎ Denotes statistical significance at the 5% level. ⁎⁎⁎ Denotes statistical significance at the 1% level.
practices. In sum, our findings support the bonding hypothesis the way in which the governance mechanisms andfirm performance of Chinese ADRs improve with ADR listing.
4.4. Inter-relationship amongfirm attributes, governance, and listing choices
Our results thus far suggest that Chinese ADRs outperform the matchedfirms, exhibit stronger governance, and improve governance mechanisms after cross-listing. We now turn our attention to whether the choice between Level 1 and Level 3 listings by Chinese ADRs is influenced by their governance practices and firm attributes.4
Table 9shows that there is little discernible difference in governance mechanisms between Level 1 and Level 3 ADRs prior to listings. One marginal difference is in board monitoring where Level 3 ADRs are related to a higher proportion of independent directors. It seems to suggest that Chinesefirms with more board monitoring and transparency tend to choose Level 3 over Level 1 listings. Another difference, infirm attributes, is that Chinesefirms with higher asset growth also prefer Level 3 listings. Taken together, firms with more growth opportunities and greater externalfinancing needs have stronger governance in the form of more effective board monitoring. Thesefindings are consistent with the third hypothesis that stronger (weaker) governedfirms with higher (lower) opportunities prefer Level 3 (Level 1) listings.
Table 10reports the differences in governance mechanisms andfirm attributes between Level 1 and Level 3 ADRs in the post-listing period. Among the governance measures, insider ownership appears to be
4
We exclude three 144A ADRs and one Level 2 ADR for the empirical analysis because the choice of listings between Level 1 and Level 3 makes up 98% of observations in the sample.
Table 7
Logit regressions of cross-listings on governance measures andfirm characteristics in the post-listing period. This table presents the results of the logit regressions of the ADR listing on the governance measures andfirm characteristics in the post-listing period from 2003 to 2009. The dependent variable takes a value of one for ADR listing and zero for non-ADR listing.
Lagged variables 1 2 3 4 5 6 Corporate governance Board size −0.29⁎⁎⁎ (−9.08) −0.14⁎⁎⁎ (−3.92) −0.13⁎⁎⁎ (−3.53) −0.10⁎⁎ (−2.10) −0.16⁎⁎⁎ (−4.38) −0.12⁎⁎ (−2.55) Independent 7.29⁎⁎⁎ (8.61) 7.03⁎⁎⁎ (8.18) 8.96⁎⁎⁎ (8.60) 7.34⁎⁎⁎ (8.50) 8.64⁎⁎⁎ (8.04) CEO duality 1.36⁎⁎⁎ (7.86) 1.04⁎⁎⁎ (4.78) Insider ownership 9.65⁎⁎⁎ (8.40) 9.40⁎⁎⁎ (7.75) Top 10 investors 2.07⁎⁎⁎ (4.66) 3.16⁎⁎⁎ (5.13) Firm characteristics ROA 3.50⁎⁎⁎ (4.45) 3.92⁎⁎⁎ (4.79) 4.13⁎⁎⁎ (4.62) 4.74⁎⁎⁎ (4.85) 3.52⁎⁎⁎ (4.40) 3.95⁎⁎⁎ (4.03) Debt/equity −0.12⁎⁎ (−2.54) −0.09⁎⁎ (−2.11) −0.07⁎ (−1.89) −0.45⁎⁎⁎ (−5.28) −0.08⁎⁎ (−2.11) −0.41⁎⁎⁎ (−4.69) Asset growth 0.17⁎⁎ (1.99) 0.19⁎⁎ (2.16) 0.21⁎⁎ (2.26) 0.14 (1.45) 0.17⁎⁎ (1.98) 0.19⁎⁎ (2.01) Ln(Assets) 0.18⁎⁎⁎ (4.73) 0.15⁎⁎⁎ (3.85) 0.16⁎⁎⁎ (4.01) 0.15⁎⁎⁎ (3.02) 0.12⁎⁎⁎ (2.93) 0.12⁎⁎ (2.28)
Year dummy Yes Yes Yes Yes Yes Yes
Industry dummy Yes Yes Yes Yes Yes Yes
Intercept −1.15 (−1.37) −5.03 ⁎⁎⁎ (−5.18) −5.71 ⁎⁎⁎ (−5.59) −7.36 ⁎⁎⁎ (−5.25) −5.47 ⁎⁎⁎ (−5.53) −8.66⁎⁎⁎ (−5.53) N 986 986 974 906 971 888 Pseudo R-square 0.14 0.21 0.26 0.43 0.23 0.47
⁎ Denotes statistical significance at the 10% level. ⁎⁎ Denotes statistical significance at the 5% level. ⁎⁎⁎ Denotes statistical significance at the 1% level.
Post-listing changes in corporate governance andfirm characteristics of Chinese ADRs and matched firms. This table shows the post-listing changes in the corporate governance and firm characteristics for Chinese ADRs and non-ADRs. The sample includes 157 Chinese ADRs and 157 matchedfirms. The post-listing changes in the corporate governance and firm characteristics for the Chinese ADRs and matchedfirms are presented in Panels A and B, respectively. Various periods around the listing year, which is set to year 0, are used for comparison. Ntrepresents the number of
sample at period t for the respective sample group. t-Test is used to examine the significance of the means.
Period of comparison (−2, −1) (−2, 0) (−1, 0) (−1, 1) (−1, 2) (−1, 3)
Diff (N−2, N−1) Diff (N−2, N0) Diff (N−1, N0) Diff (N−1, N1) Diff (N−2, N2) Diff (N−2, N3)
Panel A: ADRs Corporate governance Board size 0.07 (46, 77) 0.67⁎ (46, 125) 0.60⁎⁎ (77, 125) 0.71⁎⁎ (77, 100) 1.00⁎⁎⁎ (77, 62) 0.64 (77, 42) Independent 0.00 (46, 77) −0.01 (46, 125) −0.01 (77, 126) −0.05⁎⁎ (77, 100) −0.06⁎⁎⁎ (77, 62) −0.07⁎⁎ (77, 42) CEO duality 0.03 (50, 79) −0.07 (50, 124) −0.10⁎ (79, 124) −0.15⁎⁎ (79, 96) −0.20⁎⁎ (79, 59) −0.11 (79, 41) Insider ownership 0.02 (40, 70) −0.02 (40, 113) −0.04 (70, 113) 0.02 (70, 92) 0.01 (70, 57) 0.07⁎ (70, 36) Top 10 investors −0.01 (43, 76) 0.07⁎⁎ (43, 123) 0.08⁎⁎⁎ (76, 123) 0.11⁎⁎⁎ (76, 97) 0.19⁎⁎⁎ (76, 60) 0.11⁎⁎ (76, 39) Firm characteristics ROA −0.04 (89, 106) −0.02 (89, 120) 0.02⁎ (106, 120) 0.05⁎⁎⁎ (106, 98) 0.07⁎⁎⁎ (106, 61) 0.06⁎⁎⁎ (106, 35) D/E −0.14 (82, 97) 0.14⁎ (82, 110) 0.28⁎⁎⁎ (97, 110) 0.19⁎⁎ (97, 91) 0.21⁎⁎ (97, 60) 0.14 (97, 33) Asset growth 0.17 (75, 91) −0.13 (75, 104) −0.30 (91, 104) 0.46⁎⁎⁎ (91, 88) 0.58⁎⁎⁎ (91, 60) 0.52⁎⁎⁎ (91, 33) Ln(Assets) −0.33 (89, 106) −0.44⁎ (89, 119) −0.12 (106, 119) −0.58⁎⁎ (106, 98) −0.30 (106, 61) −0.54⁎ (106, 35) Panel B: Non-ADRs Corporate governance Board size 0.10 (76, 81) −0.36 (76, 147) −0.46⁎ (81, 147) −0.47⁎ (81, 118) −0.53⁎ (81, 81) −0.76⁎⁎ (81, 71) Independent −0.01 (76, 81) −0.01 (76, 147) 0.00 (81, 147) 0.00 (81, 118) 0.00 (81, 81) 0.00 (81, 71) CEO duality −0.01 (76, 81) 0.03 (76, 147) 0.04 (81, 147) 0.04 (81, 118) 0.04 (81, 81) 0.01 (81, 71) Insider ownership 0.00 (76, 81) 0.00 (76, 145) 0.00 (81, 145) 0.00 (81, 116) −0.01 (81, 80) −0.02⁎ (81, 70) Top 10 investors 0.00 (76, 81) 0.00 (76, 146) −0.01 (81, 146) 0.00 (81, 117) 0.00 (81, 80) −0.02 (81, 70) Firm characteristics ROA −0.10 (74, 80) −0.04 (76, 145) 0.06 (80, 145) 0.01 (81, 114) 0.03 (80, 80) −0.01 (80, 70) D/E −0.95 (76, 80) 0.39 (76, 145) 1.33⁎⁎ (80, 145) 1.22⁎ (80, 118) 1.35⁎ (80, 81) 1.33⁎ (80, 70) Asset growth −0.06 (76, 81) 0.25⁎⁎ (76, 144) 0.32⁎⁎⁎ (81, 144) 0.28⁎⁎⁎ (81, 118) 0.35⁎⁎ (81, 80) 0.16 (81, 69) Ln(Assets) −0.23 (76, 81) −0.04 (76, 147) 0.19 (81, 147) 0.20 (81, 118) 0.44⁎ (81, 81) 0.22 (81, 71) ⁎ Denotes statistical significance at the 10% level.
⁎⁎ Denotes statistical significance at the 5% level. ⁎⁎⁎ Denotes statistical significance at the 1% level.
231 L.-H. Pan et al. / Paci fi c-Basin Finance Journ al 24 (2013) 221 – 234
significantly higher for Level 3 ADRs. The result is perhaps not surprising as 87% of Level 3 ADRs are non-SOEs, and managers in Level 3 ADRs have the opportunities to obtain higher proportion of share ownership. In contrast, 59% of Level 1 ADRs are owned and controlled by the state. Managers are not likely to take up a significant stake of share ownership.
The preference for choosing Level 1 listings by SOEs is consistent with the fact that there is little need for SOEs to acquire externalfinancing but maintain high ownership by the State. For example, China Railway Construction Company (CWYCY) is one of the largest SOEs that undertake government-backed projects overseas. The motives for listing in Level 1 are more likely to enhancefirm reputation and increase investor base and avoid the high costs of regulatory compliance. In contrast, Baidu (BIDU), the largest search engine provider in China, is a high-growthfirm with external financing needs. It therefore chooses Level 3 listing. The large proportion of SOEs in Level 1 may help explain why they have higher ownership concentration (top 10 investors) compared to Level 3 ADRs. Although share ownership remains in the hands of the State for many Level 1 ADRs, ownership becomes more diffused through equity offerings in Level 3 ADRs.
Table 10also confirms that Level 3 ADRs have higher annual asset growth than Level 1 ADRs after cross-listing. Coupled with a higherfinancial leverage, Level 3 ADRs seems to require greater external financing to meet their growth opportunities and reduce the debt ratio. Conversely, Level 1 ADRs with lower growth and debt ratio will have less need for external capital. Overall, our results suggest that the institutional background of the home country such as state ownership of afirm is particularly important in influencing the choice of listings, which consequently affects governance mechanisms.
Table 9
Logit regressions of Level 1 and Level 3 ADRs on governance measures andfirm characteristics before cross-listings. This table presents the results of the logit regressions of Level 1 and Level 3 ADRs on the governance measures andfirm characteristics before their cross-listings. The dependent variable takes a value of one for Level 3 listing and zero for Level 1 listing.
Lagged variables 1 2 3 4 5 6 7 Corporate governance Board Size −0.11 (−0.58) 0.03 (0.14) −0.03 (−0.12) 0.09 (0.37) 0.05 (0.19) 0.06 (0.24) −0.16 (−0.78) Independent 8.58⁎ (1.78) 8.64⁎ (1.78) 9.93⁎ (1.84) 8.29⁎ (1.71) 9.53⁎ (1.75) CEO duality 0.67 (0.72) 0.36 (0.36) 0.74 (0.79) Insider ownership 3.25 (1.38) 3.01 (1.19) 2.36 (1.07) Top 10 investors 0.89 (0.38) 1.19 (0.56) 1.07 (0.53)
Independent × asset growth 9.73⁎
(1.76) Firm characteristics ROA −6.47 (−0.91) −5.78 (−0.75) −4.13 (−0.51) −4.61 (−0.63) −5.71 (−0.73) −3.36 (−0.42) −3.98 (−0.53) D/E 0.00 (0.00) −0.11 (−0.10) −0.32(−0.30) −0.24(−0.22) −0.13(−0.12) −0.37(−0.33) −0.34(−0.33) Asset growth 1.26⁎ (1.87) 1.73⁎⁎ (2.22) 1.63⁎⁎ (2.07) 1.45⁎ (1.76) 1.68⁎⁎ (2.19) 1.37⁎ (1.70) −2.83 (−1.27) Ln(Assets) −0.07 (−0.33) −0.19 (−0.81) −0.18 (−0.76) −0.09 (−0.35) −0.21 (−0.87) −0.10 (−0.38) −0.01 (−0.04)
Year dummy Yes Yes Yes Yes Yes Yes Yes
Industry dummy Yes Yes Yes Yes Yes Yes Yes
Intercept −4.12 (−1.03) −8.28⁎ (−1.68) −7.93 (−1.61) −11.56⁎ (−1.94) −8.48⁎ (−1.71) −11.63⁎ (−1.90) −5.79 (−1.23) N 151 151 147 132 144 128 128 Pseudo R-square 0.56 0.59 0.59 0.58 0.59 0.58 0.55
⁎ Denotes statistical significance at the 10% level. ⁎⁎ Denotes statistical significance at the 5% level.
5. Conclusion
This paper examines the inter-relationships among corporate governance,firm attributes, and the listing choices of Chinese ADRs. Consistent with the information disclosure and signaling hypotheses, Chinese firms with better firm performance, high growth potential, high proportion of independent directors, and insider and institutional ownership are more likely to cross-list under the ADR programs. Furthermore, thefirms' strong governance mechanisms and favorable firm attributes improved over the post-listing period. Our results therefore also support the legal bonding hypothesis.
Our results go a step further to show that the motivations to cross-list as reflected in the listing choices are closely related to thefinancial needs of Chinese ADRs. Prior to ADR listings, there is little discernible difference in governance mechanisms between Level 1 and Level 3 ADRs. The choice between these two types of ADRs seems to be related to the tradeoff between the costs of regulatory compliance versus the benefits of raising external capital. Wefind that Chinese firms that choose Level 1 listing are largely SOEs listed on the Hong Kong Stock Exchange. With low funding needs, thesefirms prefer Level 1 listings that do not require the firms to meet U.S. regulatory and disclosure standards. In contrast, non-SOEs with higher externalfinancial needs tend to choose Level 3 listings at the expense of fully adopting U.S. governance and disclosure standards.
Overall, wefind that improvement in governance or the extent of “bonding” with a more stringent legal regime varies across Chinese ADRs. Due to the regulatory and disclosure requirements and the capacity to raise external capital, Level 3 ADRs exhibit higher insider ownership than Level 1 ADRs in the post-listing era. This difference in insider ownership represents a significant divergence in governance mechanisms that can be explained by different regulatory compliance between the two listing choices, which in turn are related to their growth opportunities and externalfinancing needs.
Table 10
Logit regressions of Level 1 and Level 3 ADRs on governance measures andfirm characteristics in the post-listing period from 2003 to 2009. This table presents the results of the logit regressions of Level 1 and Level 3 listings on the governance measures andfirm characteristics between 2003 and 2009. The dependent variable takes a value of one for Level 3 ADR and zero for Level 1 ADR listing.
Lagged variables 1 2 3 4 5 6 Corporate governance Board size 0.18⁎⁎⁎ (2.98) 0.10 (1.37) 0.10 (1.47) 0.13 (1.33) 0.14⁎⁎ (1.98) 0.17⁎ (1.70) Independent −2.57⁎⁎ (−2.19) −2.35⁎⁎ (−2.00) −0.27 (−0.20) −1.98⁎ (−1.67) 0.10 (0.07) CEO duality 0.19 (0.74) 0.18 (0.55) Insider ownership 4.13⁎⁎⁎ (4.49) 3.76⁎⁎⁎ (3.90) Top 10 investors −3.62⁎⁎⁎ (−4.41) −3.45⁎⁎⁎ (−3.59) Firm characteristics ROA −2.08⁎ (−1.74) −2.51⁎⁎ (−2.07) −2.25⁎ (−1.84) −3.20⁎⁎ (−2.33) −2.30⁎ (−1.89) −2.54⁎ (−1.80) D/E 0.50⁎⁎ (2.28) 0.47⁎⁎ (2.17) 0.45⁎⁎ (2.11) 1.02⁎⁎⁎ (2.79) 0.43⁎ (1.95) 0.98⁎⁎⁎ (2.67) Asset growth 0.66⁎⁎ (2.51) 0.65⁎⁎ (2.35) 0.66⁎⁎ (2.35) 0.47⁎ (1.77) 0.63⁎⁎ (2.09) 0.37 (1.25) Ln(Assets) 0.03 (0.40) 0.06 (0.83) 0.06 (0.94) −0.12 (−1.45) 0.09 (1.34) −0.07 (−0.81)
Year dummy Yes Yes Yes Yes Yes Yes
Industry dummy Yes Yes Yes Yes Yes Yes
Intercept 11.97 (0.01) 13.20 (0.02) 12.98 (0.02) 12.64 (0.02) 14.31 (0.01) 13.17 (0.02) N 423 423 411 332 411 314 Pseudo R-square 0.42 0.43 0.42 0.53 0.47 0.54
⁎ Denotes statistical significance at the 10% level. ⁎⁎ Denotes statistical significance at the 5% level. ⁎⁎⁎ Denotes statistical significance at the 1% level.
References
Albuquerque, R., Wang, N., 2008.Agency conflicts, investment, and asset pricing. Journal of Finance 63, 1–40.
Alexander, G., Eun, C., Janakiramanan, S., 1987.Asset pricing and dual listing on foreign capital markets: a note. Journal of Finance 42, 151–158.
Allen, J.W., Phillips, G.M., 2000.Corporate equity ownership, strategic alliances, and product market relationships. Journal of Finance 55, 2791–2815.
Allen, F., Qian, J., Qian, M., 2005.Law,finance, and economic growth in China. Journal of Financial Economics 77, 57–116.
Ayyagari, M., Doidge, C., 2010.Does cross-listing facilitate changes in corporate ownership and control? Journal of Banking & Finance 34, 208–223.
Bai, C., Liu, Q., Lu, J., Song, F.M., Zhang, J., 2004.Corporate governance and Market valuation in China. Journal of Comparative Economics 32, 599–616.
Basu, S., Hwang, L.S., Mitsudome, T., Weintrop, J., 2007.Corporate governance, top executive compensation andfirm performance in Japan. Pacific-Basin Finance Journal 15, 56–79.
Benos, E., Weisbach, M.S., 2004.Private benefits and cross-listings in the United States. Emerging Markets Review 5, 217–240.
Bhagat, S., Bolton, B., 2008.Corporate governance andfirm performance. Journal of Corporate Finance 14, 257–273.
Boon, A., Field, L.C., Karpoff, J.M., Raheja, C.G., 2007.The determinants of corporate board size and composition: an empirical analysis. Journal of Financial Economics 85, 66–101.
Boubakri, N., Cosset, J.-C., Samet, A., 2010.The choice of ADRs. Journal of Banking and Finance 34, 2077–2095.
Burns, N., Francis, B.B., Hasan, I., 2007.Cross-listing and legal bonding: evidence from mergers and acquisitions. Journal of Banking and Finance 31, 1003–1031.
Chen, K., Chen, C.H., Wei, K.C., 2011.Agency costs of free cashflows and the effect of shareholders' rights on the implied cost of equity capital. Journal of Financial and Quantitative Analysis 46, 171–207.
Cheng, S., 2008.Board size and the variability of corporate performance. Journal of Financial Economics 87, 157–176.
Coles, J., Daniel, N., Naveen, L., 2008.Boards: does one sizefit all? Journal of Financial Economics 87, 329–356.
Core, J.E., Guay, W.R., Rusticus, T.O., 2006.Does weak governance cause weak stock returns? An examination offirm operating performance and investors' expectations. Journal of Finance 61, 655–687.
Doidge, C., Karolyi, G.A., Lins, K.V., Miller, D.P., Stulz, R.M., 2009a.Private benefits of control, ownership, and the cross listing decision. Journal of Finance 64, 425–466.
Doidge, C.A., Karolyi, G.A., Stulz, R.M., 2009b.Has New York become less competitive than London in global markets? Evaluating foreign listing choices over time. Journal of Financial Economics 91, 253–277.
Domowitz, I., Glen, J., Madhavan, A., 1997.Market segmentation and stock prices: evidence from an emerging market. Journal of Finance 52, 1059–1085.
Ho, S., Lam, K., Sami, H., 2004.The investment opportunity set, director ownership, and corporate policies: evidence from an emerging market. Journal of Corporate Finance 10, 383–408.
Hutchison, M., Gul, F.A., 2004.Investment opportunity set, corporate governance practices, andfirm value. Journal of Corporate Finance 10, 595–614.
Karolyi, G.A., 2006.The world of cross-listings and cross-listings of the world: challenging conventional wisdom. Review of Finance 10, 1–54.
Kutsuna, K., Okamura, H., Cowling, M., 2002.Ownership structure pre- and post-IPO and the operating performance of JASDAQ companies. Pacific Basin Finance Journal 10, 163–181.
La Porta, R., Lopez-de-Silanes, F., Shleifer, A., Vishny, R.W., 1998.Law andfinance. Journal of Political Economy 106, 1113–1155.
La Porta, R., Lopez-de-Silanes, F., Shleifer, A., Vishny, R.W., 2000.Investor protection and corporate governance. Journal of Financial Economics 58, 3–27.
La Porta, R., Lopez-de-Silanes, F., Shleifer, A., Vishny, R.W., 2002.Investor protection and corporate valuation. Journal of Finance 57, 1147–1170.
Lang, M.H., Lins, K.V., Miller, D.P., 2003.ADRs, analysts, and accuracy: does cross-listing in the United States improve afirm's information environment and increase market value? Journal of Accounting Research 41, 317–345.
Lel, U., Miller, D.P., 2008.International cross-listing,firm performance, and top management turnover: a test of the bonding hypothesis. Journal of Finance 63, 1897–1937.
Linck, J.S., Netter, J.M., Yang, T., 2008.The determinants of board structure. Journal of Financial Economics 87, 308–328.
Lipton, M., Lorsch, J.W., 1992.A modest proposal for improved corporate governance. Business Lawyer 48, 59.
McConnell, J.J., Servaes, H., Lins, K., 2008.Changes in insider ownership and changes in the market value of thefirm. Journal of Corporate Finance 14, 92–106.
Reese, W.A., Weisbach, M.S., 2002.Protection of minority shareholder interests, cross-listings in the United States, and subsequent equity offerings. Journal of Financial Economics 66, 65–104.
Stulz, R.M., 1999.Globalization, corporatefinance and the cost of capital. Journal of Applied Corporate Finance 12, 8–25.
Yermack, D., 1996.Higher market valuation of companies with a small board of directors. Journal of Financial Economics 40, 185–211.
Zhang, C.X., King, T.H.D., 2010.The decision to list abroad: the case of ADRs and foreign IPOs by Chinese companies. Journal of Multinational Financial Management 20, 71–92.