Evolutionary Bioinformatics 2012:8 389–415
doi: 10.4137/EBO.S9743
This article is available from http://www.la-press.com.
© the author(s), publisher and licensee Libertas Academica Ltd.
This is an open access article. Unrestricted non-commercial use is permitted provided the original work is properly cited.
Open Access
Full open access to this and thousands of other papers at
http://www.la-press.com. O r i g i n A L r E S E A r c h
Determinants of exon-Level evolutionary Rates in Arabidopsis
species
gideon c.-T. Wu1,2 and Feng-chi chen1–4
1graduate institute of Life Sciences, national Defense Medical center, 114 Taiwan. 2Division of Biostatistics and
Bioinformatics, institute of Population health Sciences, national health research institutes, 305 Taiwan. 3Department of
Life Sciences, national chiao-Tung University, hsinchu, 300 Taiwan. 4Department of Dentistry, china Medical University,
Taichung, 404 Taiwan. corresponding author email: [email protected]
Abstract: What causes the variations in evolutionary rates is fundamental to molecular evolution. However, in plants, the causes of
within-gene evolutionary rate variations remain underexplored. Here we use the principal component regression to examine the con-tributions of eleven exon features to the within-gene variations in nonsynonymous substitution rate (dN), synonymous substitution rate
(dS), and the dN/dS ratio in Arabidopsis species. We demonstrate that exon features related to protein structural-functional constraints
and mRNA splicing account for the largest proportions of within-gene variations in dN/dS and dN. Meanwhile, for dS, a combination of
expression level, exon length, and structural-functional features explains the largest proportion of within-gene variances. Our results suggest that the determinants of within-gene variations differ from those of between-gene variations in evolutionary rates. Furthermore, the relative importance of different exon features also differs between plants and animals. Our study thus may shed a new light on the evolution of plant genes.
Keywords: exonic evolutionary rates, nonsynonymous substitution rate, synonymous substitution rate, principal component regression,
Introduction
Evolutionary rates are known to vary significantly between different genes.1,2 The genomic
determi-nants of evolutionary rates have been extensively studied.2 Gene expression level is presently
consid-ered as a major determinant of evolution rate—highly expressed genes tend to have a lower nonsynonymous substitution rate (dN) and a lower nonsynonymous-to-synonymous rate (dN/dS) ratio than lowly expressed genes.3,4 Meanwhile, other biological features are also
reported to be important for determining evolutionary rates, including tissue specificity of gene expression,5,6
gene compactness,7 protein extracellularity,8
pres-ence of paralogous genes,9,10 and G+C content.11,12
Notably, evolutionary rates also vary within genes. For example, the determinants of evolutionary rates, such as the number of solvent-accessible amino acid residues,13,14 proportion of intrinsically disordered
regions (IDRs),15–17 and proportion of functional
domains,18–20 may differ significantly between exons,
leading to significant variations in evolutionary rates even for different exons of the same genes.
Recently, it has been shown that alternative splicing (AS), an important mechanism to increase proteome diversity,21,22 has significant effects on within-gene
variations in evolutionary rates in mammals.17,23,24
Particularly, the protein regions encoded by alter-natively spliced exons (ASEs) evolve more rapidly than those encoded by constitutively spliced exons (CSEs).23,24 Notably, however, the contribution of AS
to the diversity of transcriptome and proteome actually differs between animals and plants, with the former having more alternatively spliced transcript isoforms than the latter.22,25–27 Furthermore, the patterns of AS
also differ between the two lineages. Genome-wide studies showed that the major AS type in plants is intron retention,28,29 which is the rarest event in animals.22,26,27
Therefore, whether AS also plays an important role in plant exon evolution remains unknown.
Another difference between plants and animals is the higher rates of gene duplication in plant genomes. Particularly, whole-genome duplications (WGDs) occur more frequently in plants than in animals.30,31
The genome of Arabidopsis thaliana, for example, has experienced at least four WGD events.32 In addition,
tandem gene duplicates also occur more frequently in plants than in animals.33 Accordingly, gene
dupli-cation may have profound impacts on the functions
and evolution of plant genes. Since both of AS and gene duplication can increase proteome diversity, the higher level of gene duplication may have compen-sated for the lower level of AS in plants, thus decreas-ing the importance of AS. In this vein, it is likely that the influences of AS on exon evolution are less sig-nificant in plants than in animals. This hypothesis, nevertheless, has not been examined.
In this study, we systematically examined the con-tributions of eleven exon features to the evolution-ary rates of plant exons: (1) exonic expression level; (2) the ASE/CSE exon types; (3) weighted exon fre-quency (WEF, which is an mRNA splicing-related feature; see Materials and Methods); (4) proportion of solvent-accessible amino acid residues (PSA); (5) proportion of Pfam domain (PD); (6) proportion of intrinsically disordered regions (PIDR); (7) exon length; (8) 5’ intron length; (9) 3’ intron length; (10) exon duplicability; and (11) G+C content. Note that some of these features are correlated with each other. One obvious example is PSA, PD, and PIDR, all of which are structural-functional features. Intrin-sically disordered regions tend to lack functionally structured domains and be solvent-accessible.34–36 In
addition, 5’ and 3’ intron length are both related to the “compactness” of the interested exons, and thus are collectively termed “compactness features”. Other correlations are less obvious. For example, G+C con-tent was suggested to be positively correlated with the level of gene duplication.10 Gene compactness was
also reported to be positively correlated with G+C content and gene expression level, but negatively cor-related with protein evolutionary rate.9 Furthermore,
gene compactness correlates with gene expression level in contradictory directions between mammals and plants.37,38 In lieu of the correlations between
the analyzed exon features, an appropriate analysis able to control for the confounding effects of inter-correlated variables is required for the purpose of this study. Here we use principal component regression (PCR) analysis to delineate the relative contributions of the eleven exon features to the variations in exonic evolutionary rates in Arabidopsis species (Arabidop-sis thaliana and A. lyrata). PCR has been shown to be appropriate for analyzing interacting variables on noisy data.39,40
Our results suggest that for Arabidopsis, structural- functional features constitute a single dominant
component in affecting the variances in exonic dN/dS and dN. For dS, however, a combination of multiple fea-tures, including exonic expression level, exon length, and structural-functional features, consist of the most important component in determining the variance in dS. Our results suggest that the determinants of exon-level evolutionary rates are fairly different from those of the gene-level evolutionary rates. Furthermore, the deter-minants of exonic evolutionary rates also differ between animals and plants. Our analysis thus has provided new insights into plant exon evolution.
Materials and Methods
Data sources and sequence alignments
The genomic sequences, transcript sequences, gene annotations, transcript structures, and gene orthology between A. thaliana and A. lyrata were retrieved from the EnsemblPlants website (http://plants.ensembl.org/ index.html) (Release 11, TAIR10) via the BioMart interface.41,42 To ensure data quality, only knowntranscripts with known protein products were ana-lyzed. Since AS is one of the focus of this study, we retained the genes that have at least 2 transcripts and obtained 52,840 orthologous exon pairs from 4,926 one-to-one orthologous gene pairs, which correspond to 11,723 A. thaliana transcripts. We defined the CSE/ ASE exon type according to the transcripts of A. thal-iana because it is better annotated and has a larger number of alternatively spliced transcripts than A. lyrata. Exons lacking information of any of the ana-lyzed features were filtered out. In the end, we gener-ated an integrgener-ated dataset of 28,173 within-gene exon pairs based on the 9,412 exons of 2,102 transcripts.
For each orthologous gene pair, the peptide sequences of all transcript isoforms were aligned by using the MUSCLE program.43 We then chose the longest
align-able pair of orthologous peptide sequences for each gene pair. These sequences were then back- translated to nucleotide sequences, and divided into exons with reference to A. thaliana annotations for calculation of evolutionary rates and measurements of exon features. For simplicity, the codons that span an exon-exon boundary were excluded from our analysis.
Measurements of exonic expression
level
The RNA-seq data were retrieved from the Sequence Read Archive (SRA)44 website (http://trace.ncbi.nlm.
nih.gov/Traces/sra/). We retrieved a series of raw data submitted by Filichkin et al (SRP000935)29 and
Schimidt’s lab (SRP007763). These RNA-seq data cover several experimental conditions, including abi-otic stresses (cold, drought, heat, highlight, and salt), aging stress, and response to different iron concen-trations, in addition to normal growth conditions. To measure exonic expression level, we first identified the unique sequences in the analyzed exons using in-house PERL scripts, and then calculated the number of RNA-seq short reads that can be mapped to these unique regions. The RNA-seq raw data were processed to output the fastq files by using sratoolkit 2.1.6 (avail-able at: http://trace.ncbi.nlm.nih.gov/Traces/sra/sra. cgi?view=software). The fastq files were further pro-cessed and filtered by the Bowtie-TopHat-Cufflinks-SAMtools toolset45–48 (available at: http://bowtie-bio.
sourceforge.net/index.shtml; http://tophat.cbcb.umd. edu/; http://cufflinks.cbcb.umd.edu/; http://samtools. sourceforge.net/) to generate the FPKM (fragments per kilobase of exon per million fragments mapped) value for each exon of interest. The expression level of an exon (expL) is the average FPKM value.
Estimations of exonic evolutionary rates
We calculated dN, dS, and dN/dS of all orthologous exon pairs by using the YN00 program of the PAML 4 package.49,50 To avoid biases in evolutionary rateesti-mations, we excluded exons whose lengths are shorter than 81 bp.17,51
computation of splicing features
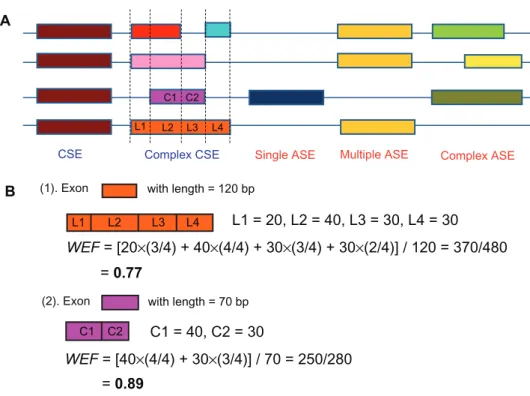
The analyzed exons were divided into five different classes: complex ASE, multiple ASE, single ASE, simple CSE, and complex CSE (see Supplementary Fig. S1A for more details). Briefly, ASEs are the exons that are occasionally skipped in the transcript, whereas CSEs are those that are always present in the transcript. This classification, however, is apparently oversimplified because exons from different transcript isoforms usually partially overlap with each other (Supplementary Fig. S1A). We thus divided ASEs into three different types. A single ASE is one that occurs only once in all of the transcript isoforms. By contrast, a multiple ASE occurs multiple times, and the boundary of this ASE remains unchanged in dif-ferent transcript isoforms. If a multiple ASE changes its boundary in different transcripts, it is termed a
complex ASE. Meanwhile, a simple CSE is one that does not change its boundaries in transcript isoforms. In the case where the boundaries of a CSE do change, or the CSE becomes discontinuous in another tran-script isoform, the CSE is termed a complex CSE (Supplementary Fig. S1A). To incorporate this exon classification into our PCR analysis, we assigned an integer value to each of the five types of exons: “1” for complex ASE, “2” for multiple ASE, “3” for single ASE, “4” for complex CSE, and “5” for simple CSE.
We also calculated the weighted exon frequency (WEF) as a quantitative measurement of the relative importance of exons in AS events. The “frequency” of an exon is the proportion of transcript isoforms that include this specific exon. For example, if a gene contains four AS isoforms, and a certain exon is included in three of the four isoforms, the frequency of this exon is 3/4. However, since exons from dif-ferent isoforms can partially overlap with each other, it is sometimes difficult to clearly define the “fre-quency” of an exon. Therefore, we use WEF instead, which is the length-weighted frequency of an exon. Supplementary Figure S1B gives examples of WEF calculation. Briefly, an exon was divided into several sub-regions according to how it overlaps with exons from other transcript isoforms. The frequency of each sub-region can be calculated and then weighted by the length of each sub-region to yield WEF.
Measurements of structural-functional
features
The structural-functional features analyzed in this study include the proportion of solvent-accessible amino acid residues (PSA), proportion of Pfam domain sites (PD), and proportion of intrinsically dis-ordered regions (PIDR).
Solvent-accessible residues were predicted by using the SSpro/ACCpro 4.1 program52 with a 30%
exposure threshold. Intrinsically disordered regions were predicted by using DISOPRED V253 with
default parameters. The Pfam domain information54
was retrieved from the EnsmblPlant databases.
Measurements of compactness features
and other features
The exon length, 5’/3’ intron length, and G+C con-tent were calculated using an in-house PERL script with reference to the annotations of EnsemblPlants.
Note that the first and the last coding exons, which do not have 5’ or 3’ intron, respectively, were excluded. Exon duplicability (ED) was defined as the “copy number” of an exon in the A. thaliana transcriptome. We BLASTN-aligned55 the exon of interest against
the A. thaliana exome using default parameters. A BLAST hit was considered as a potential duplicate of the exon of interest if it satisfies the following cri-teria: (1) the alignable length is 90% of the query exon length; (2) the alignable region has a 90% similarity with the query exon.
Statistical analysis
The PCR analyses were conducted by using the pro-gram provided by Drummond et al39 under the R
environments.56 In this study, we calculated the
differ-ences in evolutionary rates (dN, dS, and dN/dS) and the eleven exon features for pairs of exons from the same transcripts (the total number of within-gene exon pairs analyzed here is 28,173). These differences were then analyzed using PCR to delineate the contributions of the exon features to the variances in evolutionary rates.
We also compared exons from different genes by randomly generating 500 datasets, with each dataset containing 28,173 between-gene exon pairs, which is the number of exon pairs in the within-gene analysis. We first randomly selected one exon from the ana-lyzed transcripts, and then selected a second exon that belongs to a gene other than where the first exon is from. By doing so we could be sure that the two exons are from different genes. This process was iterated 28,173 times to derive 28,173 between-gene exon pairs for each of the 500 random datasets. A PCR analysis was then conducted for each of these 500 random datasets. The results of the 500 random sampling experiments were then averaged to repre-sent the effects of between-gene differences in exon features on variances in evolutionary rates.
Results and Discussions
The correlations between exon features
and exonic evolutionary rates
To confirm whether the eleven analyzed exon fea-tures are correlated with exonic evolutionary rates in Arabidopsis, we pooled all of the exons together and conducted simple Pearson’s correlations separately for dN, dS and dN/dS ratio against each individual exon feature. As shown in Table 1, exonic dN/dS is
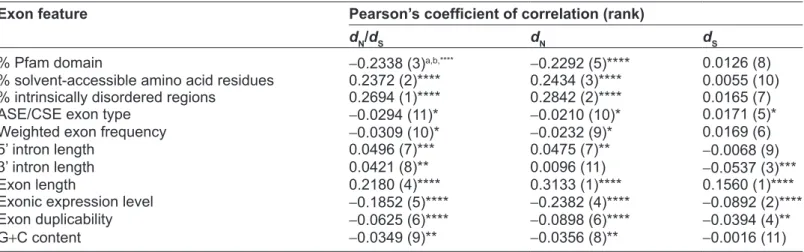
Table 1. The Pearson’s coefficient of correlation between each of the eleven exon features and dn/dS, dn, and dS.
exon feature Pearson’s coefficient of correlation (rank)
dn/ds dn ds
% Pfam domain -0.2338 (3)a,b,**** -0.2292 (5)**** 0.0126 (8)
% solvent-accessible amino acid residues 0.2372 (2)**** 0.2434 (3)**** 0.0055 (10)
% intrinsically disordered regions 0.2694 (1)**** 0.2842 (2)**** 0.0165 (7)
ASE/cSE exon type -0.0294 (11)* -0.0210 (10)* 0.0171 (5)*
Weighted exon frequency -0.0309 (10)* -0.0232 (9)* 0.0169 (6)
5’ intron length 0.0496 (7)*** 0.0475 (7)** -0.0068 (9)
3’ intron length 0.0421 (8)** 0.0096 (11) -0.0537 (3)***
Exon length 0.2180 (4)**** 0.3133 (1)**** 0.1560 (1)****
Exonic expression level -0.1852 (5)**** -0.2382 (4)**** -0.0892 (2)****
Exon duplicability -0.0625 (6)**** -0.0898 (6)**** -0.0394 (4)**
g+c content -0.0349 (9)** -0.0356 (8)** -0.0016 (11)
notes: aThe number in the parenthesis indicates the “rank” of the specific exon feature according to the absolute value of the coefficient of correlation;
bstatistical significance. *P , 0.05; **P , 10–3; ***P , 10–6; ****P , 10–9. significantly correlated with each of the eleven exon features. Similar results are also observed for dN, except that the correlation between 3’ intron length and dN is statistically insignificant. By contrast, only five of the eleven features (exon length, expression level, exon duplicability, 3’ intron length, and ASE/ CSE exon type) are significantly correlated with dS. Notably, exon features related to structural-functional constraints (PD, PSA, and PIDR) have the highest correlations with exonic dN/dS. For dN and dS, unex-pectedly, exon length seems to be the most important determinants. Another unexpected observation is that expression level ranks only the fifth and the fourth, respectively, in terms of coefficient of correlation with dN/dS and dN, although it ranks the second in the case of dS. These results, however, are oversimplified because the interactions between different features are not controlled. Accordingly, we conducted PCR analyses to control for the confounding effects of inter-correlations between the analyzed features.
The exon features are grouped
into biologically sensible components
Considering that some of the differences in exon features may result largely from the gene-level dif-ferences (e.g., expression level), we calculated the within-gene differences in the eleven exon features (i.e, differences between exons from the same tran-script) and exonic evolutionary rates (∆dN, ∆dS, and ∆dN/dS ratio). We then conducted PCR separately for ∆dN, ∆dS, and ∆dN/dS ratio against the with-in-gene differences in the eleven exon features.To probe the effect of between-gene differences in exon features on the variances in evolutionary rates, we also performed the same PCR analysis by analyzing exons from different genes on 500 ran-dom datasets and averaged the results for compari-son with the within-gene analysis (see Materials and Methods).
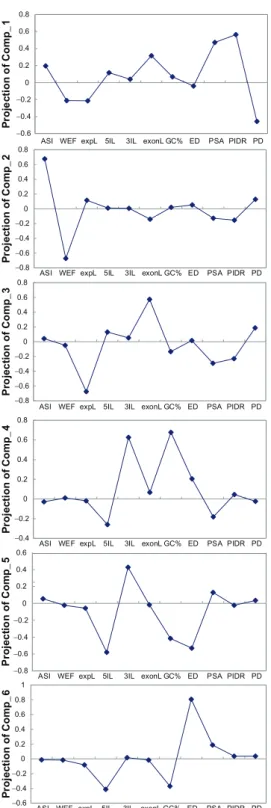
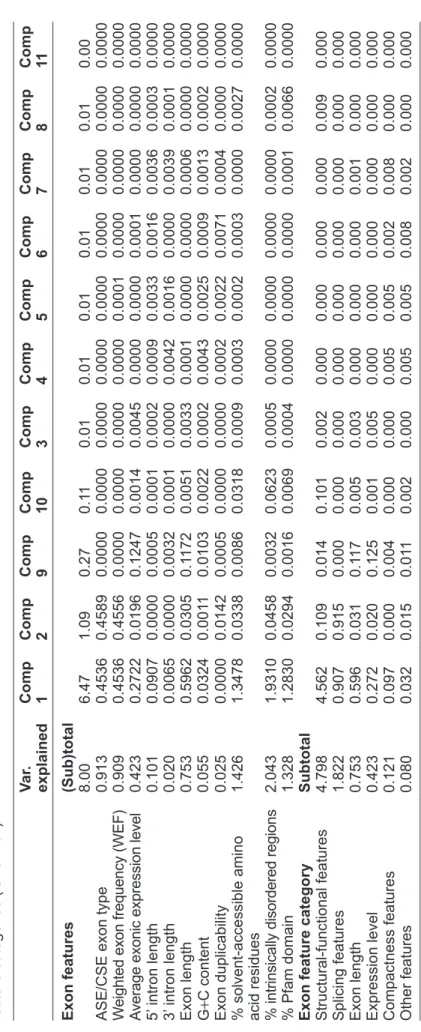
The principal components derived from the within-gene analysis (Table 2) and the between-gene analysis (Table 3) give similar, biologically meaningful groupings for the eleven exon features: (1) structural-functional features: PSA, PIDR, and PD; (2) mRNA splicing features: weighted exon frequency (WEF) and ASE/CSE exon type; (3) compactness features: 3’ and 5’ intron lengths; (4) exonic expression level; (5) exon length; and (6) other features: exon dupli-cability and G+C content. These results reflect the strength of PCR in identifying biologically relevant variables. Furthermore, the similar results between within-gene (Table 2) and between-gene (Table 3) analyses indicate the consistency and reliability of the PCR approach. Notably, exon length and exonic expression level usually occur in the same compo-nents (compocompo-nents 3 and 9 in both Tables 2 and 3). It was previously reported that gene expression level is negatively correlated with gene size57,58 or transcript
size58,59 in plants. However, whether such correlations
apply to exon length and exonic expression level remains unclear. Therefore, we present exon length and exonic expression level as different features in our results, although these two features tend to occur in the same components. The projection patterns of the
Table 3.
The percent contributions of individual features to the principal components in the between-gene analysis.
exon features c omp 1 c omp 2 c omp 3 c omp 4 c omp 5 c omp 6 c omp 7 c omp 8 c omp 9 c omp 10 c omp 11 ASE/ c SE exon type 0.003 0.485 0.000 0.005 0.001 0.003 0.000 0.000 0.000 0.000 0.500 W
eighted exon frequency (WEF)
0.003 0.483 0.001 0.006 0.000 0.003 0.000 0.000 0.000 0.000 0.500
Average exonic expression level
0.094 0.001 0.409 0.004 0.003 0.003 0.003 0.001 0.481 0.002 0.000 5’ intron length 0.018 0.009 0.002 0.301 0.080 0.058 0.525 0.001 0.000 0.000 0.000 3’ intron length 0.008 0.004 0.003 0.385 0.097 0.035 0.458 0.005 0.008 0.000 0.000 Exon length 0.137 0.006 0.259 0.008 0.071 0.026 0.001 0.050 0.422 0.025 0.000 g +c content 0.000 0.000 0.094 0.207 0.267 0.355 0.004 0.014 0.061 0.014 0.000 Exon duplicability 0.010 0.004 0.006 0.014 0.462 0.480 0.005 0.000 0.000 0.000 0.000
% solvent accessible amino acid residues
0.187 a 0.003 0.127 0.062 0.013 0.035 0.001 0.300 0.025 0.248 0.000
% intrinsically disordered regions
0.302 0.003 0.076 0.008 0.005 0.000 0.000 0.006 0.002 0.600 0.000 % Pfam domain 0.237 0.002 0.024 0.000 0.002 0.000 0.002 0.622 0.001 0.109 0.000 n otes:
aThe numbers larger than 0.2 are color-shaded.
The color code in
the table is the same as that used in Figure
1.
Table 2.
The percent contributions of individual features to the principal components in the within-gene analysis.
exon features c om p 1 c om p 2 c om p 3 c om p 4 c om p 5 c om p 6 c om p 7 c om p 8 c om p 9 c om p 10 c omp 11 ASE/ c SE exon type 0.070 0.421 0.002 0.001 0.003 0.000 0.001 0.000 0.000 0.000 0.501 W
eighted exon frequency (WEF)
0.070 0.418 0.002 0.001 0.007 0.002 0.001 0.000 0.000 0.000 0.498
Average exonic expression level
0.042 0.018 0.454 0.000 0.004 0.006 0.000 0.000 0.462 0.013 0.000 5’ intron length 0.014 0.000 0.017 0.088 0.330 0.161 0.362 0.025 0.002 0.001 0.000 3’ intron length 0.001 0.000 0.003 0.422 0.161 0.001 0.389 0.010 0.012 0.001 0.000 Exon length 0.092 0.028 0.330 0.005 0.001 0.000 0.063 0.002 0.434 0.046 0.000 g +c content 0.005 0.001 0.017 0.428 0.252 0.089 0.133 0.017 0.038 0.020 0.000 Exon duplicability 0.000 0.013 0.001 0.022 0.216 0.708 0.035 0.000 0.002 0.000 0.001
% solvent-accessible amino acid residues
0.208 a 0.031 0.087 0.030 0.024 0.029 0.000 0.270 0.032 0.289 0.000
% intrinsically disordered regions
0.298 0.042 0.053 0.002 0.001 0.002 0.002 0.022 0.012 0.566 0.000 % Pfam domain 0.198 0.027 0.035 0.000 0.001 0.001 0.013 0.655 0.006 0.063 0.000 n otes:
aThe numbers larger than 0.2 are color-shaded.
The color code in
the table is the same as that used in Figure
eleven principal components in the within-gene anal-ysis are given in Supplementary Figure S2.
Structural-functional features
are the single dominant feature
category in explaining the variances
in exonic d
n/d
Sand d
nin Arabidopsis
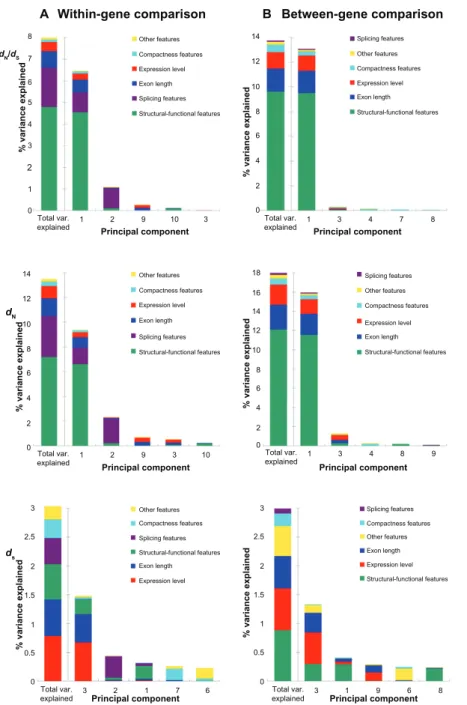
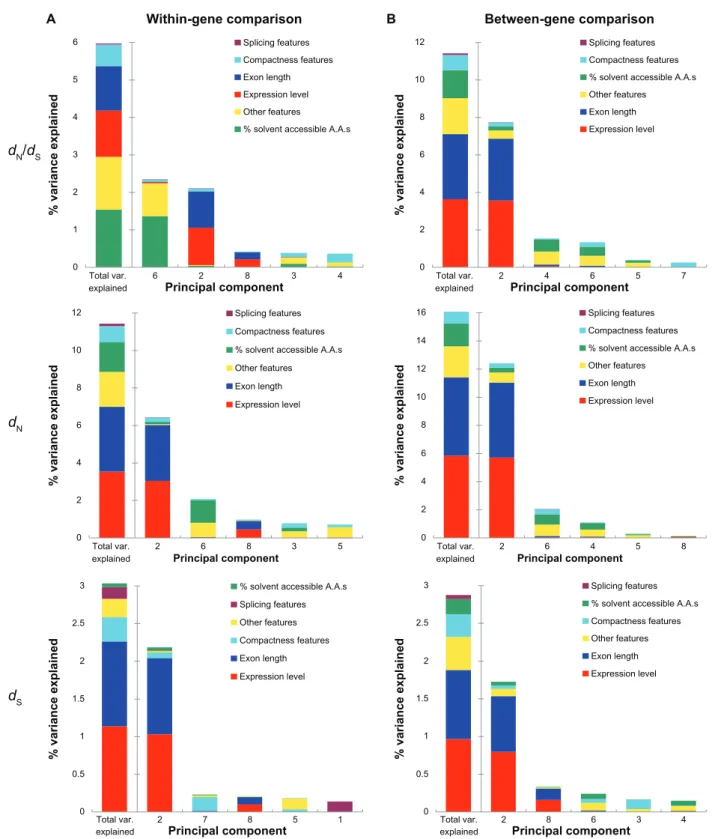
The variances in evolutionary rates that can be accounted for by the six aforementioned featurecategories are shown in Figure 1 (note that only the five most important components are demon-strated). For the dN/dS ratio in the within-gene anal-ysis (Fig. 1A, upper panel), structural-functional features dominate the most influential component (Component 1), which explains 6.47% of the vari-ance in exonic dN/dS. Interestingly, the second most important component (Component 2) is dominated by splicing features, which explain only 1.09% of exonic dN/dS variance. None of the rest of the
com-Within-gene comparison B A Between-gene comparison Other features Compactness features Expression level Exon length Splicing features Structural-functional features Splicing features Other features Compactness features Expression level Exon length Structural-functional features Other features Compactness features Expression level Exon length Splicing features Structural-functional features Splicing features Other features Compactness features Expression level Exon length Structural-functional features Other features Compactness features Expression level
Principal component Principal component Principal component ds dN dN/dS Principal component Principal component % variance explained % variance explained % variance explaine d % variance explained % variance explaine d % variance explained Principal component Exon length Splicing features Structural-functional features Splicing features Other features Compactness features Expression level Exon length Structural-functional features 8 7 6 5 4 3 2 1 1 2 9 10 3 Total var.
explained Total var.explained 1 3 4 7 8
1 0 0 2 4 6 8 10 12 14 0 2 4 6 8 10 12 14 0 0.5 1 1.5 2 2.5 3 0 0.5 1 1.5 2 2.5 3 2 4 6 8 10 12 14 16 18 3 4 8 9 Total var. explained 3 1 9 6 8 Total var. explained 3 2 1 7 6 Total var. explained 1 2 9 3 10 Total var. explained 0
Figure 1. The percent of variances in dn/dS (upper panel), dn (middle panel), and dS (lower panel) explained by the principal components for (A) the
within-gene comparison; and (B) the between-gene comparison.
notes: Only the five most important components are shown here. The leftmost bar in each panel indicates the total variances explained by all of the eleven
ponents explains more than 0.3% of the exonic dN/dS variance (Supplementary Table S1). In other words, structural-functional features appear to be the single dominant feature category in explaining exonic dN/dS in Arabidopsis. The total variance in dN/dS explained by all of the eleven exon features is 8.00%, among which structural- functional features account for 60% (4.80/8.00) (Fig. 1A, upper panel and Supplemen-tary Table S1). Similar results are also observed in the PCR analysis of dN, where structural-functional features account for 53% (7.20/13.49) of the total variance explained (Fig. 1A, middle panel and Sup-plementary Table S2). Meanwhile, splicing features, which dominate the second most important com-ponent (Comcom-ponent 2) in the within-gene analysis, account for 22.8% (1.82/8.00) and 24.4% (3.29/13.49) of total variances in dN/dS and dN explained, respectively (upper and middle panel of Fig. 1A; Supplementary Tables S1 and S2). Exon length is the third most important determinant, accounting for 9.4% (0.75/8.00) and 10.6% (1.43/13.49) of the total within-gene variances in dN/dS and dN explained, respectively (upper and middle panel of Fig. 1A; Supplementary Tables S1 and S2). Notably, expres-sion level ranks only the fourth in this within-gene analysis, accounting for a fairly small percentage of total variances in dN/dS (5.3% = 0.42/8.00) and dN (7.4% = 1.00/13.49) explained. In addition, the con-tributions of compactness features are even smaller than those of expression level. This feature category explains only 1.5% and 2.6% in the variance in dN/dS and dN, respectively (Supplementary Tables S1 and S2).
To examine the influences of gene-level feature differences on exonic evolutionary rates, we also conducted between-gene PCR analyses by compar-ing exons from different genes (see Materials and Methods for more details). Unexpectedly, structural-functional features remain the most important fac-tor in affecting the variances in exonic dN/dS and dN, although the importance of splicing features has significantly decreased in this between-gene analysis (upper and middle panel of Figure 1B and Supplementary Tables S4 and S5). In fact, functional features account for 70% (9.63/13.68) and 67% (12.11/17.97) of the total variance explained in exonic dN/dS or dN, respectively (upper and mid-dle panel of Fig. 1B; Supplementary Tables S4
and S5). Interestingly, exon length is the second most important determinant for between-gene variances in dN/dS and dN, accounting for 13.6% (1.86/13.68) and 14.4% (2.58/17.97) of the total variance explained, respectively. By contrast, expression level, the major determinant of gene-level dN/dS, ranks only the third, and accounting for 9.7% (1.33/13.68) and 11.6% (2.08/17.97) of the total variance explained in exonic dN/dS and dN, respectively (upper and middle panel of Fig. 1B; Supplementary Tables S4 and S5). Compactness features again have only minor con-tributions in this between-gene analysis, account-ing for 4.3% (0.59/13.68) and 3.5% (0.62/17.97), respectively, of the total variance in dN/dS and dN explained.
One notable observation in Figure 1 is that the total variances in dN/dS and dN explained by the eleven analyzed exon features are larger in the between-gene analysis than in the within-gene anal-ysis. This is probably because the between-gene dif-ferences are larger than within-gene difdif-ferences in evolutionary rates and the analyzed exon features. The larger variations may have led to a better reso-lution of the PCR analyses. Furthermore, the total variances explainable by the exon features are larger for dN than for dN/dS in both of the within-gene and between-gene analyses. One possible explanation is that the exon features that have major effects on dN also significantly affect dS. In other words, the explainable variances in dN may be partly cancelled out by the variances in dS, leading to decreased explainable variances in dN/dS. Also note that the variances in exonic dN/dS explained by the major component (6.47% and 13.09%, Supplementary Tables S1 and S4) in this study are smaller than that reported for yeast39 (∼40%) but larger than that
reported for mammals7 (∼5%). Note that both of the
latter two studies measured the dN/dS ratio for genes as a whole, whereas in this study we measured the dN/dS for individual exons. The differences in meth-odology and target of study (gene or exon) may be one of the reasons that cause the differences in explainable dN/dS variance. Another possible reason for the differences among the three studies is that the three examined lineages (unicellular eukaryotes, plants and mammals) may have very different effec-tive population size (Ne). The efficiency of natural selection is known to be positively correlated with
Ne.60,61 For the three lineages being compared here,
yeast has the largest,62 and mammals may have the
smallest Ne.60,63 Therefore, the order of explainable
variance in dN/dS may have reflected the order of efficiency of selection. This speculation, however, requires further supporting evidence because the Ne of Arabidopsis thaliana remains to be determined.
One unexpected result in this study is that expres-sion level accounts for a relatively small variance in dN/dS. Expression level was reported to be the most dominant dN/dS determinant at the gene level.2,6,64,65
There are several possible explanations for the reduced importance of expression level in affecting dN/dS in this study. First, the RNA-seq data used in this study were derived from several stress condi-tions (see Materials and Methods). It is likely that overall gene (and exon) expression levels are sup-pressed in these conditions, leading to lack of resolu-tion in expression level even between different genes. Second, the sequencing depth in the analyzed RNA-seq dataset may be insufficient to yield reliable exonic expression level. Third, our PCR analysis indicates that exonic expression level and exon length usually occur in the same components (Tables 2 and 3). The reason for this correlation remains unclear. However, if we merge exon length and exonic expression level into one feature category, this category would be the second most influential feature category for explain-ing the variances in dN/dS and dN in the between-gene analysis but not in the within-gene analysis, where splicing features would remain the second most important feature category (Supplementary Tables S1, S2, S4, and S5).
An interesting observation in Figure 1 is that splicing features play a relatively important role in determining within-gene variances in dN/dS and dN, but not in the case of between-gene analysis. Note that splicing features are specific to individual exons (rather than transcripts or genes as a whole). Unlike expression level, splicing features may differ signifi-cantly within the same gene (e.g., WEF = 1.0 versus WEF = 0.5) but be similar for exons from different genes (e.g., two exons from different genes are both simple CSEs; both WEF = 1.0). This is especially true considering that the majority (97.5%) of the analyzed exons are CSEs. Therefore, within-gene variations in splicing features may better explain within-gene variances in dN/dS and dN than between-gene
variations. Notably, however, the contributions of splicing features to within-gene variances in exonic dN/dS and dN are only a fraction of those made by structural-functional features (Fig. 1 and Supplemen-tary Tables S1 and S2). This observation appears to support our hypothesis that alternative splicing plays a relatively minor role in affecting exon evolution in plants. In fact, our recent study indicates that in mam-mals, alternative splicing and structural-functional features have similar contributions to within-gene variances in dN/dS and dN.66
The variances in exonic d
Scan be explained by a combination
of different exon features
For the PCR analysis of within-gene variance in dS, however, we obtained quite different results from what was observed for dN/dS and dN: the major component (Component 3) is composed of multiple exon features (exonic expression level, exon length, and structural-functional features), and none of the features accounts for more than half of the component (Fig. 1A, lower panel and Table 2). Interestingly, the second most important component remains Component 2 (as in the case of dN/dS and dN), which is composed mainly of splicing features. These observations suggest that the variance in within-gene dS is determined by a combi-nation of different biological factors. By contrast, in the case of within-gene variances in dN/dS and dN, one feature category (structural-functional features) seems to be the single dominant factor (upper and middle panel of Fig. 1A). When the contributions of each fea-ture category are summed up, exonic expression level accounts for the largest percent (25.1% = 0.78/3.12) of variance in within-gene dS explained, followed by exon length (20.3% = 0.63/3.12), structural-functional features (19.8% = 0.62/3.12), splicing features (14.5% = 0.45/3.12), compactness features (10.3% = 0.32/3.12), and finally by other features (10.1% = 0.32/3.12) (Supplementary Table S3).
The between-gene analysis of variance in dS again yields fairly different results from what were observed for dN/dS and dN. Particularly, none of the analyzed exon features (or feature categories) comprises a sin-gle dominant factor. As shown in Figure 1B (lower panel), the constituents of the major component (Component 3) in this analysis are similar to those in the within-gene dS analysis (Fig. 1A, lower panel)
but with somewhat different weightings. In this anal-ysis, Component 3 is composed mainly of functional features, expression level, exon length, and other features, with the last feature category account-ing for a larger proportion of dS variance (22.8%) than in the within-gene analysis (17.5%). The total variance in between-gene dS explained by each cat-egory is, in a descending order, structural-functional features (29.6% = 0.88/2.99), expression level (24.3% = 0.73/2.99), exon length (18.7% = 0.56/2.99), other features (17.4% = 0.52/2.99), compactness features (7.4% = 0.22/2.99), and splicing features (2.7% = 0.08/2.99) (Supplementary Table S6).
A noticeable observation here is that exonic expres-sion level and exon length, if considered together as one biological factor, could account for the largest pro-portion of the total variance in exonic dS explained in both of the within-gene analysis (Fig. 1A, lower panel) and the between-gene analysis (Fig. 1B, lower panel). Recall that these two exon features usually occur in the same components (Tables 2 and 3), even though we do not know the biological connection between them. In fact, these two exon features have a signifi-cantly negative correlation with each other (Pearson’s r = -0.5278, P ∼ 0). If we consider these two exon features as expression level-related features, the high proportions of variance in dS accounted for by these features may be explained as the requirement for translational efficiency—highly expressed genes are known to have more biased codon usages,67–69 which
may lead to increased dS. This speculation, however, remains to be validated. The Pearson’s correlation coefficient between each principal component and the target variables (dN/dS, dN and dS) in the within-gene analysis are given in Supplementary Table S7.
The relative importance of exonic
expression level and structural-functional
features in affecting between-gene d
n/d
Svariance
Somewhat surprising in Figure 1B is the observation that structural-functional features constitute the single most important feature category in affecting between-gene variances in dN/dS and dN. It is unexpected because exonic expression level is expected to diverge more significantly between genes than between exons of the same genes. However, this comment does not
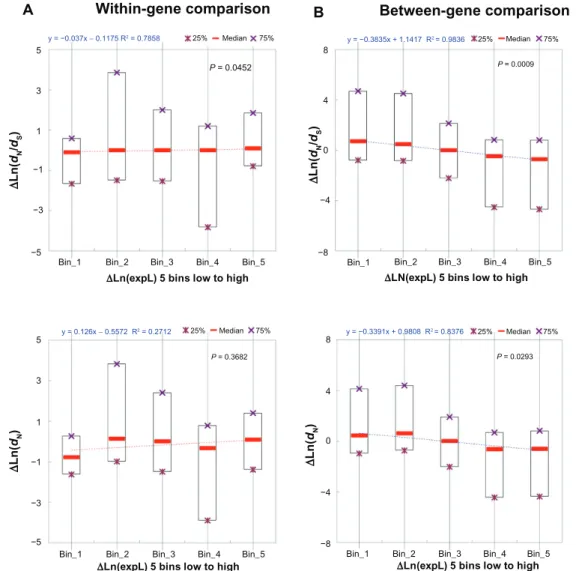
apply to structural-functional features. To examine whether our analyses contain certain technical errors, we re-examined our data by dividing the within-gene and between-gene exon pairs, separately, into five groups according to two different criteria: (1) the dif-ference in exonic expression level (∆expL); and (2) the difference in PSA (∆PSA, a representative struc-tural-functional feature). We then conducted simple regressions between ∆dN/dS (and ∆dN) and the two exon features separately.
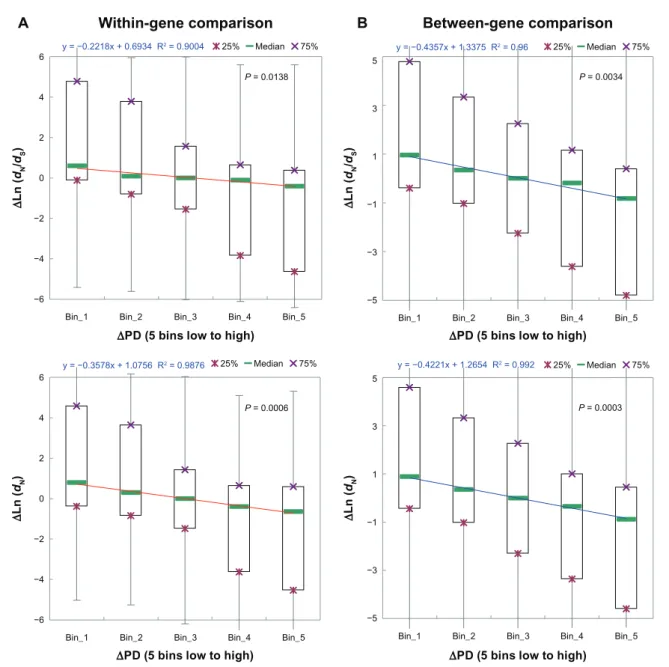
We first examined the correlations between ∆expL and ∆dN/dS (and ∆dN). As shown in Figure 2A, the correlations are marginally significant or statisti-cally insignificant (P = 0.0452 for ∆dN/dS; P = 0.3682 for ∆dN) in the case of within-gene exon pairs. By contrast, the correlations are statistically significant (P = 0.0009 for ∆dN/dS; P = 0.0293 for ∆dN), and the regression coefficients are negative in the case of between-gene exon pairs (Fig. 2B). Therefore, the general concept that highly expressed genes (and thus the exons within) tend to evolve slower is supported in our between-gene dataset (Fig. 2B). This (∆expL-∆dN/dS) negative correlation, however, is not observed in the within-gene dataset (Fig. 2A). These observa-tions appear to support our hypothesis that expres-sion level differ by a greater extent between genes than between exons from the same genes. Therefore, exonic expression level may not have major contribu-tions to within-gene variacontribu-tions in dN/dS. Nevertheless, this cannot explain why structural-functional features are more influential than exonic expression level in the between-gene analysis (Fig. 1B). We then exam-ined the correlations between ∆PSA and ∆dN/dS (and ∆dN).
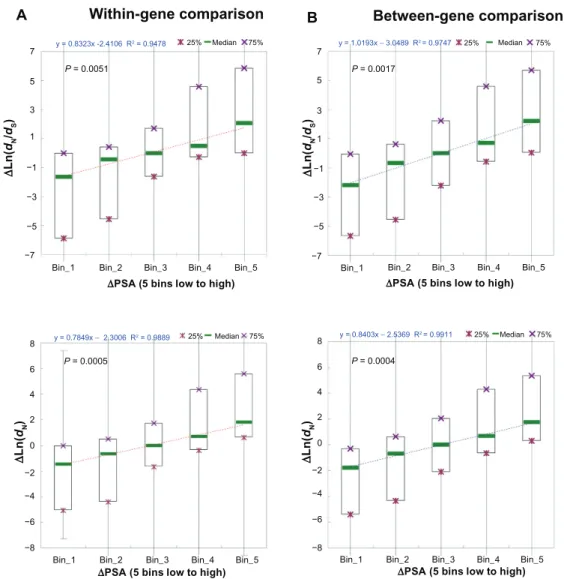
Interestingly, as shown in Figure 3, for both with-in-gene dataset (Fig. 3A) and between-gene dataset (Fig. 3B), ∆PSA is significantly positively corre-lated with ∆dN/dS and ∆dN (P = 0.0051 and 0.0017 for within-gene and between-gene ∆dN/dS, respec-tively; P = 0.0005 and 0.0004 for within-gene and between-gene ∆dN, respectively). Notably, the regres-sion coefficients are larger for between-gene data-set than for the within-gene datadata-set. In other words, between-gene divergences in PSA may better explain differences in exonic dN/dS (and dN) than within-gene divergences. Similar trends are also observed for the other two structural-functional features (PD and PIDR, Supplementary Figs. S3 and S4). Although
it is unexpected, this observation is likely to be true because genes may diverge significantly in the den-sities of structural-functional domains, which can be reflected also at the exon level. Therefore, our pre-vious result in Figure 1 appears to be correct that structural- functional features account for a larger pro-portion of total variances in dN/dS and dN explained in the between-gene analysis than in the within-gene analysis.
Notably, the absolute values of regression coeffi-cients are larger for all of the three structural-func-tional features (Fig. 3B and Supplementary Figs. S3B and S4B) than for exonic expression level (Fig. 2B). This is probably the reason why we observe larger contributions by structural-functional features to between-gene variances in dN/dS and dN than by exonic expression level. However, as we will discuss in the
next section, the relative importance of exonic expres-sion level and structural-functional features in affect-ing exonic dN/dS needs further investigations. In fact, in mammals, exonic expression level plays a more important role than structural-functional features in affecting between-gene variations in exonic dN/dS.66
gene level versus exon level—
the differences in evolutionary
rate determinants
Recently, Yang and Gaut also used PCR to systemati-cally examine the determinants of gene-level dN (Ka) and dS (Ks) in Arabidopsis species.6 The authors
reported that all of the analyzed features could explain 21.4% and 11.1% of the variance in dN and dS, respec-tively. By contrast, in this study, all of the exon features can explain 13.5% and 3.12% of within-gene variance
Within-gene comparison
Bin_1 Bin_2 Bin_3 Bin_4 Bin_5
25% Median 75% y = 0.126x − 0.5572 R2 = 0.2712 y = −0.3391x + 0.9808 R2 = 0.8376 y = −0.037x − 0.1175 R2 = 0.7858 y = −0.3835x + 1.1417 R2 = 0.9836 −5 −3 −1 1 3 5 −5 −3 −1 1 3 5
Bin_1 Bin_2 Bin_3 Bin_4 Bin_5
25% Median 75%
Between-gene comparison
Bin_1 Bin_2 Bin_3 Bin_4 Bin_5
25% Median 75% −8 −4 0 4 8 −8 −4 0 4 8
Bin_1 Bin_2 Bin_3 Bin_4 Bin_5
25% Median 75%
P = 0.0452 P = 0.0009
P = 0.3682 P = 0.0293
∆Ln(expL) 5 bins low to high ∆LN(expL) 5 bins low to high
∆Ln(expL) 5 bins low to high ∆Ln(expL) 5 bins low to high
∆ Ln( dN /dS ) ∆ Ln( dN /dS ) ∆ Ln( dN ) ∆ Ln( dN ) A B
Figure 2. The linear correlation between difference in exonic expression level (∆Ln(expL)) and difference in dn/dS (∆Ln(dn/dS), upper panel) or difference
in dN and dS, respectively. For the between-gene analysis, the percentages are 18.0% and 3.0%, respectively. Obviously, the total explainable vari-ances in our study are smaller than those observed in Yang and Gaut’s study. Notably, in the current study, the measurements of exon features and evolutionary rates may be somewhat noisy because of the rela-tively short length of exons (as compared with genes or transcripts as a whole). Although we excluded short exons (see Materials and Methods), the varia-tions in the exon features are unavoidably larger than the biological feature measurements obtained for complete genes.66 This is perhaps one of the
rea-sons why the explainable variances in this study are smaller than in the gene-level analysis.
Meanwhile, the major determinants of vari-ances in dN and dS also differ significantly between
the two studies. In Yang and Gaut’s study,6 the most
important factor in affecting dN appears to be gene expression-related features (gene expression level and expression breadth), whereas in this study, the most important determinant is related to the structural-functional constraints (PIDR, PSA, and PD). Note that we did not include expression breadth in our analy-sis because the RNA-seq data cover only an inade-quate number of tissues. In the case of dS, the most important gene-level determinants are gene length and intron number. But at the exon level, the most impor-tant determinants are expression level, exon length, and structural-functional features. There are several possible reasons for this difference. Firstly, in Yang and Gaut’s study, gene expression level was measured by using microarray, whereas in this study RNA-seq data were used to derive exonic expression level.
Within-gene comparison
Bin_1 Bin_2 Bin_3 Bin_4 Bin_5
25% Median 75% y = 0.7849x − 2.3006 R2 = 0.9889 y = 0.8403x − 2.5369 R2 = 0.9911 y = 0.8323x -2.4106 R2 = 0.9478 y = 1.0193x − 3.0489 R2 = 0.9747 −8 −6 −4 −2 2 0 4 6 8 −8 −6 −4 −2 2 0 4 6 8 −7 −3 −5 −1 1 3 5 7
Bin_1 Bin_2 Bin_3 Bin_4 Bin_5
25% Median 75%
Between-gene comparison
Bin_1 Bin_2 Bin_3 Bin_4 Bin_5
25% Median 75% −7 −3 −5 −1 1 3 5 7
Bin_1 Bin_2 Bin_3 Bin_4 Bin_5
25% Median 75%
P = 0.0051 P = 0.0017
P = 0.0005 P = 0.0004
∆PSA (5 bins low to high) ∆PSA (5 bins low to high)
∆PSA (5 bins low to high) ∆PSA (5 bins low to high)
A B ∆ Ln( dN /dS ) ∆ Ln( dN /dS ) ∆ Ln( dN ) ∆ Ln( dN )
Figure 3. The linear correlation between difference in percent of solvent-accessible amino acid residues (∆PSA) and difference in dn/dS (∆Ln(dn/dS), upper
The microarray approach has some potential cave-ats (e.g., cross-hybridization and differential probe affinity). Nevertheless, the RNA-seq data used in this study also suffer some potential problems (e.g., insuf-ficient sequencing depth and stress condition-based RNA expression data). The differences in data source and the limitations of the data may have led to dif-ference in major determinants of evolutionary rates between the two studies. Secondly, the two studies actually explore similar topics (i.e., determinants of evolutionary rates) at two different levels (gene and exon level). Therefore, the analyzed biological fea-tures differ because of the nature of the studies. For example, splicing features, which are unique to this study, cannot be incorporated into the gene-level study. Another example is the lengths of untranslated regions, which are analyzed in Yang and Gaut’s study but seem to be less relevant (and thus not included) in this study. The differences in nature and the analyzed biological features may be part of the reasons why the two studies yielded different results.
In addition, one noticeable feature of PCR is that the percent of variance explained by each variable may change when different numbers of variables are included. For example, in our analysis the three structural-functional features (PSA, PIDR, and PD) are correlated with each other. If we remove PIDR and PD from our analysis, the results become some-what different (Supplementary Fig. S5)—the relative importance of expression level increases while that of structural-functional features (PSA) decreases in both of the within-gene and between-gene analyses. However, the total variance explained by all of the components also decrease by ∼2% for dN and dN/dS. This result implies that although the three structural-functional features are correlated with each other, they might still have some independent effects on exonic dN and dN/dS. Furthermore, given adequate RNA-seq-based expression data, we might be able to include other expression-related features (such as expression breadth and tissue specificity of expression) in the future. The relative importance between expression features and structural-functional features in affect-ing plant exon evolution can then be re-evaluated.
Potential caveats
A potential caveat in this study is that we classify exons into different types (CSEs or ASEs) according
to the transcript structures of A. thaliana. It is likely that the classification of exons may be different for A. lyrata. However, as the majority of A. lyrata genes encode only one annotated transcript, we do not have sufficient information for exon classifications for this species. That said, we speculate that we may obtain similar results even if we have sufficient informa-tion for A. lyrata. This is because a previous study indicated that exon classifications according to anno-tations of different mammalian species (i.e., human or mouse) yielded similar results in the analyses of exonic evolutionary rates.24
Still another limitation of this study is that we do not know all of the determinants of evolutionary rates in plants. Particularly, complex biological interactions are common in multicellular organisms. The “interaction terms” and the spatio-temporal regulations of biologi-cal functions are obviously omitted in this study due to lack of information. This lack of knowledge may lead to input of insufficient determinants, and thus a reduc-tion in the variance explained in the PCR analyses.
concluding remarks
To our knowledge, this is the first study to systematically examine the determinants of within-gene variations in evolutionary rates in plants. We not only confirmed the findings in a similar study in animals (that the determi-nants of exon-level and gene-level evolutionary rates differ from each other), but also demonstrated impor-tant differences in the relative importance of biological features in affecting exonic evolutionary rates between animal and plants. Particularly, the importance of alter-native splicing in plants seems to be less significant in plants than in animals. Notably, alternative splicing is an important regulatory mechanism in multicellu-lar organisms, and more so in animals than in plants. Our study shows the importance of alternative splic-ing from another angle. That is, alternative splicsplic-ing has major but differential effects on exon evolution in animals and plants. Many important questions remain unanswered, however. For example, some important regulatory mechanisms, such as DNA methylation and nucleosome occupancy, are not included in this study. In addition, it will be interesting to conduct simi-lar analyses for more species from major taxa for com-parison (e.g., gymnosperms vs. angiosperms; monocots vs. dicots; algae vs. fungi vs. seed plants… etc.) when adequate information is available.
Author contributions
Conceived and designed the experiments: FCC. Analyzed the data: GCTW. Wrote the first draft of the manuscript: GCTW. Contributed to the writing of the manuscript: FCC. Agree with manuscript results and conclusions: GCTW and FCC. Jointly developed the structure and arguments for the paper: GCTW and FCC. Made critical revisions and approved final version: FCC. All authors reviewed and approved of the final manuscript.
Funding
Feng-Chi Chen was supported by the intramural funding of National Health Research Institutes and the National Science Council under contract NSC98-2311-B-400-002-MY3.
competing Interests
The authors declare that they have no conflicts of interests.
Disclosures and ethics
As a requirement of publication author(s) have pro-vided to the publisher signed confirmation of compli-ance with legal and ethical obligations including but not limited to the following: authorship and contribu-torship, conflicts of interest, privacy and confidential-ity and (where applicable) protection of human and animal research subjects. The authors have read and confirmed their agreement with the ICMJE author-ship and conflict of interest criteria. The authors have also confirmed that this article is unique and not under consideration or published in any other publication, and that they have permission from rights holders to reproduce any copyrighted material. Any disclo-sures are made in this section. The external blind peer reviewers report no conflicts of interest.
References
1. Li W-H. Molecular Evolution. Sunderland, MA: Sinauer Associates, Inc.; 1997.
2. Pal C, Papp B, Lercher MJ. An integrated view of protein evolution. Nature Reviews Genetics. 2006;7:337–48.
3. Drummond DA, Bloom JD, Adami C, Wilke CO, Arnold FH. Why highly expressed proteins evolve slowly. Proceedings of the National Academy of Sciences of the United States of America. 2005;102:14338–43.
4. Popescu CE, Borza T, Bielawski JP, Lee RW. Evolutionary rates and expression level in Chlamydomonas. Genetics. 2006;172:1567–76. 5. Park SG, Choi SS. Expression breadth and expression abundance behave
dif-ferently in correlations with evolutionary rates. BMC Evolutionary Biology. 2010;10:241.
6. Yang L, Gaut BS. Factors that contribute to variation in evolutionary rate among Arabidopsis genes. Molecular Biology and Evolution. 2011;28: 2359–69.
7. Liao B-Y, Scott NM, Zhang J. Impacts of gene essentiality, expression pattern, and gene compactness on the evolutionary rate of mammalian proteins. Molecular Biology and Evolution. 2006;23:2072–80.
8. Liao B-Y, Weng M-P, Zhang J. Impact of extracellularity on the evolution-ary rate of mammalian proteins. Genome Biology and Evolution. 2010;2: 39–43.
9. Tang CSM, Epstein RJ. A structural split in the human genome. PLoS One. 2007;2:e603.
10. Zhang L, Lu HHS, Chung W-y, Yang J, Li W-H. Patterns of segmen-tal duplication in the human genome. Molecular Biology and Evolution. 2005;22:135–41.
11. Duret L, Galtier N. Biased gene conversion and the evolution of mamma-lian genomic landscapes. Annual Review of Genomics and Human Genetics. 2009;10:285–311.
12. Galtier N, Duret L, Glemin S, Ranwez V. GC-biased gene conversion pro-motes the fixation of deleterious amino acid changes in primates. Trends in Genetics. 2009;25:1–5.
13. Lin YS, Hsu WL, Hwang JK, Li WH. Proportion of solvent-exposed amino acids in a protein and rate of protein evolution. Molecular Biology and Evolution. 2007;24:1005–11.
14. Ramsey DC, Scherrer MP, Zhou T, Wilke CO. The relationship between relative solvent accessibility and evolutionary rate in protein evolution. Genetics. 2011;188:479–88.
15. Brown CJ, Johnson AK, Daughdrill GW. Comparing models of evolution for ordered and disordered proteins. Molecular Biology and Evolution. 2010;27:609–21.
16. Brown CJ, Takayama S, Campen AM, et al. Evolutionary rate heterogeneity in proteins with long disordered regions. Journal of Molecular Evolution. 2002;55:104–10.
17. Chen FC, Pan CL, Lin HY. Independent effects of alternative splicing and structural constraint on the evolution of mammalian coding exons. Molecular Biology and Evolution. 2011;29:187–93.
18. Wolf YI, Gopich IV, Lipman DJ, Koonin EV. Relative contributions of intrin-sic structural-functional constraints and translation rate to the evolution of protein-coding genes. Genome Biology and Evolution. 2010;2:190–99. 19. Kazi JU, Kabir NN, Soh J-W. Bioinformatic prediction and analysis of
eukaryotic protein kinases in the rat genome. Gene. 2008;410:147–53. 20. Hanks S, Quinn A, Hunter T. The protein kinase family: conserved
fea-tures and deduced phylogeny of the catalytic domains. Science. 1988;241: 42–52.
21. Hallegger M, Llorian M, Smith CWJ. Alternative splicing: global insights. FEBS Journal. 2010;277:856–66.
22. Keren H, Lev-Maor G, Ast G. Alternative splicing and evolution: diversi-fication, exon definition and function. Nature Reviews Genetics. 2010;11: 345–55.
23. Chen FC, Chaw SM, Tzeng YH, Wang SS, Chuang TJ. Opposite evolu-tionary effects between different alternative splicing patterns. Molecular Biology and Evolution. 2007;24:1443–6.
24. Chen FC, Wang SS, Chen CJ, Li WH, Chuang TJ. Alternatively and consti-tutively spliced exons are subject to different evolutionary forces. Molecular Biology and Evolution. 2006;23:675–82.
25. Barbazuk WB, Fu Y, McGinnis KM. Genome-wide analyses of alterna-tive splicing in plants: opportunities and challenges. Genome Research. 2008;18:1381–92.
26. Kim E, Goren A, Ast G. Alternative splicing: current perspectives. BioEssays. 2008;30:38–47.
27. Kim E, Magen A, Ast G. Different levels of alternative splicing among eukaryotes. Nucleic Acids Research. 2007;35:125–31.
28. Wang BB, Brendel V. Genomewide comparative analysis of alternative splicing in plants. Proceedings of the National Academy of Sciences of the United States of America. 2006;103:7175–80.
29. Filichkin SA, Priest HD, Givan SA, et al. Genome-wide mapping of a lternative splicing in Arabidopsis thaliana. Genome Research. 2010;20: 45–58.
30. Soltis PS, Soltis DE. The role of hybridization in plant speciation. Annual Review of Plant Biology. 2009;60:561–88.
31. Mable BK. ‘Why polyploidy is rarer in animals than in plants’: myths and mechanisms. Biological Journal of the Linnean Society. 2004;82:453–66. 32. Vision TJ, Brown DG, Tanksley SD. The origins of genomic duplications in
Arabidopsis. Science. 2000;290:2114–7.
33. Lockton S, Gaut BS. Plant conserved non-coding sequences and paralogue evolution. Trends in Genetics. 2005;21:60–5.
34. Dyson HJ, Wright PE. Intrinsically unstructured proteins and their functions. Nature Reviews Molecular Cell Biology. 2005;6:197–208.
35. Uversky VN. Intrinsically disordered proteins from A to Z. The International Journal of Biochemistry and Cell Biology. 2011;43:1090–103.
36. Uversky VN, Dunker AK. Understanding protein non-folding. Biochimica et Biophysica Acta (BBA)—Proteins and Proteomics. 2010;1804:1231–64. 37. Carmel L, Koonin EV. A universal nonmonotonic relationship between gene
compactness and expression levels in multicellular eukaryotes. Genome Biology and Evolution. 2009;1:382–90.
38. Ren X-Y, Vorst O, Fiers MWEJ, Stiekema WJ, Nap J-P. In plants, highly expressed genes are the least compact. Trends in Genetics. 2006;22: 528–32.
39. Drummond DA, Raval A, Wilke CO. A single determinant dominates the rate of yeast protein evolution. Molecular Biology and Evolution. 2006;23: 327–37.
40. Plotkin JB, Fraser HB. Assessing the determinants of evolutionary rates in the presence of noise. Molecular Biology and Evolution. 2007;24:1113–21. 41. Kersey PJ, Staines DM, Lawson D, et al. Ensembl Genomes: an integrative
resource for genome-scale data from non-vertebrate species. Nucleic Acids Research. 2012;40:D91–7.
42. Youens-Clark K, Buckler E, Casstevens T, et al. Gramene database in 2010: updates and extensions. Nucleic Acids Research. 2011;39:D1085–94. 43. Edgar RC. MUSCLE: multiple sequence alignment with high accuracy and
high throughput. Nucleic Acids Research. 2004;32:1792–7.
44. Leinonen R, Sugawara H, Shumway M. The Sequence Read Archive. Nucleic Acids Research. 2011;39:D19–21.
45. Roberts A, Pimentel H, Trapnell C, Pachter L. Identification of novel transcripts in annotated genomes using RNA-Seq. Bioinformatics. 2011;27: 2325–9.
46. Langmead B, Trapnell C, Pop M, Salzberg S. Ultrafast and memory- efficient alignment of short DNA sequences to the human genome. Genome Biology. 2009;10:R25.
47. Trapnell C, Pachter L, Salzberg SL. TopHat: discovering splice junctions with RNA-Seq. Bioinformatics. 2009;25:1105–11.
48. Li H, Handsaker B, Wysoker A, et al. The sequence alignment/map format and SAM tools. Bioinformatics. 2009;25:2078–9.
49. Yang Z. PAML 4: a program package for phylogenetic analysis by maximum likelihood. Molecular Biology and Evolution. 2007;24:1586–91.
50. Yang Z, Nielsen R. Estimating synonymous and nonsynonymous substitution rates under realistic evolutionary models. Molecular Biology and Evolution. 2000;17:32–43.
51. Nekrutenko A, Makova KD, Li W-H. The KA/KS ratio test for assessing the
protein-coding potential of genomic regions: an empirical and simulation study. Genome Research. 2002;12:198–202.
52. Cheng J, Randall AZ, Sweredoski MJ, Baldi P. SCRATCH: a protein structure and structural feature prediction server. Nucleic Acids Research. 2005;33:W72–6.
53. Ward JJ, McGuffin LJ, Bryson K, Buxton BF, Jones DT. The DISOPRED server for the prediction of protein disorder. Bioinformatics. 2004;20: 2138–9.
54. Finn RD, Mistry J, Tate J, et al. The Pfam protein families database. Nucleic Acids Research. 2010;38:D211–22.
55. Camacho C, Coulouris G, Avagyan V, et al. BLAST+: architecture and applications. BMC Bioinformatics. 2009;10:421.
56. R Development Core Team. R: A Language and Environment for Statistical Computing. Vienna, Austria: R Foundation for Statistical Computing, 2011. Available at: http://www.R-project.org.
57. Yang H. In plants, expression breadth and expression level distinctly and non-linearly correlate with gene structure. Biology Direct. 2009;4:45; discussion 45.
58. Camiolo S, Rau D, Porceddu A. Mutational biases and selective forces shaping the structure of Arabidopsis genes. PLoS One. 2009;4:e6356. 59. Woody JL, Severin AJ, Bolon Y-T, et al. Gene expression patterns are
correlated with genomic and genic structure in soybean. Genome. 2011;54: 10–8.
60. Charlesworth B. Fundamental concepts in genetics: Effective population size and patterns of molecular evolution and variation. Nature Reviews Genetics. 2009;10:195–205.
61. Templeton AR. Population genetics and microevolutionary theory. Hoboken, NJ: John Wiley & Sons, Inc.; 2006.
62. Tsai IJ, Bensasson D, Burt A, Koufopanou V. Population genomics of the wild yeast Saccharomyces paradoxus: Quantifying the life cycle. Proceedings of the National Academy of Sciences of the United States of America. 2008;105:4957–62.
63. Lundemo S, Falahati-Anbaran M, StenØIen HK. Seed banks cause elevated generation times and effective population sizes of Arabidopsis thaliana in northern Europe. Molecular Ecology. 2009;18:2798–811.
64. Drummond DA, Wilke CO. Mistranslation-induced protein misfolding as a dominant constraint on coding-sequence evolution. Cell. 2008;134: 341–52.
65. Slotte T, Bataillon T, Hansen TT, St. Onge K, Wright SI, Schierup MH. Genomic determinants of protein evolution and polymorphism in Arabidopsis. Genome Biology and Evolution. 2011;3:1210–9.
66. Chen FC, Liao BY, Pan CL, Lin HY, Chang AYF. Assessing determinants of exonic evolutionary rates in mammals. Molecular Biology and Evolution. 2012; Accepted.
67. Lavner Y, Kotlar D. Codon bias as a factor in regulating expression via translation rate in the human genome. Gene. 2005;345:127–138.
68. Hiraoka Y, Kawamata K, Haraguchi T, Chikashige Y. Codon usage bias is correlated with gene expression levels in the fission yeast Schizosaccharomyces pombe. Genes to Cells. 2009;14:499–509.
69. Duret L, Mouchiroud D. Expression pattern and, surprisingly, gene length shape codon usage in Caenorhabditis, Drosophila, and Arabidopsis. Proceedings of the National Academy of Sciences of the United States of America. 1999;96:4482–7.
supplementary Data
A
B
CSE (1). Exon
Single ASE Multiple ASE Complex ASE Complex CSE
with length = 120 bp
(2). Exon with length = 70 bp
WEF = [20×(3/4) + 40×(4/4) + 30×(3/4) + 30×(2/4)] / 120 = 370/480 L1 L1 = 20, L2 = 40, L3 = 30, L4 = 30 L1 L2 C1 C2 C1 = 40, C2 = 30 L3 L4 = 0.77 WEF = [40×(4/4) + 30×(3/4)] / 70 = 250/280 = 0.89 L2 C2 C1 L3 L4