Industrial & Engineering Chemistry Research is published by the American Chemical Society. 1155 Sixteenth Street N.W., Washington, DC 20036
Article
Influence of Feed Impurity on the Design and Operation
of an Industrial Acetic Acid Dehydration Column
I-Lung ChienHsiao-Ping Huang, Tang-Kai Gau, and Chun-Hui Wang
Ind. Eng. Chem. Res., 2005, 44 (10), 3510-3521 • DOI: 10.1021/ie0501125Downloaded from http://pubs.acs.org on November 18, 2008
More About This Article
Additional resources and features associated with this article are available within the HTML version: • Supporting Information
• Links to the 5 articles that cite this article, as of the time of this article download • Access to high resolution figures
• Links to articles and content related to this article
Influence of Feed Impurity on the Design and Operation of an
Industrial Acetic Acid Dehydration Column
I-Lung Chien*
Department of Chemical Engineering, National Taiwan University of Science and Technology, Taipei 106, Taiwan
Hsiao-Ping Huang, Tang-Kai Gau, and Chun-Hui Wang
Department of Chemical Engineering, National Taiwan University, Taipei 106, Taiwan
In this work, the design and operation of an industrial column for acetic acid dehydration via heterogeneous azeotropic distillation is investigated. Multiple column feed streams from various parts of the upstream process are fed into this column. The feed components besides acetic acid and water also contain small amounts of methyl acetate and another component. For proprietary reasons, this component will not be specified in this paper. This component during normal operation will not leave the column system through either a top decanter aqueous outlet stream or a column bottom stream. The accumulation of this component inside the column system is illustrated via rigorous dynamic simulation. A side stream is proposed to solve the accumulation problem of this component. The appropriate side-stream location and its flow rate are determined in this paper by total annual cost analysis. There is a great influence of this small feed impurity on the design and operation of the column. With the same purity specifications on both the top and bottom products, the column system with feed impurity requires much larger total annual cost and operating cost in comparison with the design of the no feed impurity case. A very simple overall control strategy is proposed for the column system with feed impurity and continuous side-stream draw-off. Because the optimal flow rate of the side stream is quite small, an alternative operating strategy in industry is to periodically purge out this impurity through the side stream. A practical automatic purging strategy is thus proposed in the paper. This automatic purging strategy does not rely on any online composition measurement but just needs information on some tray temperature measurements. Closed-loop dynamic simulation demonstrates that the proposed purging strategy can successfully keep the column under normal operation with both the top and bottom product purities at their specifications.
1. Introduction
Acetic acid (HAc) dehydration is an important opera-tion in the producopera-tion of aromatic acid, such as tere-phthalic acid, or in the manufacture of cellulose acetate. Although HAc and water (H2O) do not form an
azeo-trope, using simple distillation to separate these two components would require many equilibrium stages and thus is impractical. The reason is because the system has a tangent pinch on the pure H2O end; thus, it is
more customary to use an entrainer via a heterogeneous azeotropic distillation column system for the separation. The design of an HAc dehydration system using an entrainer has been studied in several publications. In a review paper, Othmer1described an azeotropic
distil-lation system containing a dehydrating column, a decanter, and a H2O column for the separation of HAc
and H2O. The entrainer used before 1932 was ethylene
dichloride, and later normal propyl acetate and normal butyl acetate were used to reduce the organic reflux and heat duty used in the dehydrating column. In a paper by Pham and Doherty,2examples of using ethyl
acetate (cf. Tanaka and Yamada3), n-propyl acetate (cf.
Othmer4), or n-butyl acetate (cf. Tanaka and Yamada3
and Othmer4) as the entrainer were listed in a table
of examples of heterogeneous azeotropic separations. Siirola5uses HAc dehydration as an example to
dem-onstrate a systematic process synthesis technique to the conceptual design of a process flowsheet. Ethyl acetate was used as the entrainer in that paper to design a complete HAc dehydration process with multiple-effect azeotropic distillation and heat integration. More re-cently, Wasylkiewicz et al.6proposed using a geometric
method for the optimum process design of an HAc dehydration column with n-butyl acetate as the en-trainer.
All of the above papers on the HAc dehydration sys-tem are on the subject of process synthesis and design; very little discussion about the control strategy of this system has been found in the literature. Luyben and Tyreus7 offered a realistic vinyl acetate monomer
ex-ample for academic researchers pursuing simulation, design, and control studies. In that example, an azeo-tropic distillation column with a decanter is presented. Although the flowsheet of that column system is similar to the one in this study with components of HAc and H2O, but because vinyl acetate is a product of the overall
process, an extra organic phase product that is different from that of the system to be studied in this paper is drawn off from the decanter. Kurooka et al.8 proposed
a nonlinear control system for the HAc dehydration column with n-butyl acetate as the entrainer. In their * To whom correspondence should be addressed. Tel.:
+886-2-27376652. Fax: +886-2-27376644. E-mail: chien@ ch.ntust.edu.tw.
10.1021/ie0501125 CCC: $30.25 © 2005 American Chemical Society Published on Web 04/19/2005
study, a complicated exact input-output linearization controller was used, with values of some unmeasured state variables needed for the calculations. The resulting control performances under feed rate and composition changes are not desirable because of large fluctuations in the manipulated variables. Gaubert et al.9 studied
the operation of an unnamed organic acid dehydration in the industry using an immiscible entrainer. Multiple steady states are confirmed for the heterogeneous column by simulation and experimental data for the industrial unit. However, dynamics and control of the system are not studied in their paper. In our earlier paper (Chien et al.10), the design and control of the HAc
dehydration system via heterogeneous azeotropic distil-lation has been studied. A suitable entrainer of isobutyl acetate (IBA) is selected from three candidate acetates by total annual cost (TAC) analysis. A simple overall control strategy with just one temperature loop inside the column is proposed to hold both the top and bottom product specifications despite feed disturbances. In that study, only three components are included.
In this paper, the design and operation of an indus-trial column for HAc dehydration via heterogeneous azeotropic distillation is investigated. The entrainer used for this industrial column to aid the HAc and H2O
separation is also IBA. This entrainer is circulating inside the column through an organic reflux stream from a decanter. Multiple column feed streams from various parts of the upstream process are fed into this column. The feed components besides HAc and H2O also
contain small amounts of methyl acetate (MA) and another component. For proprietary reasons, this com-ponent will not be specified in this paper. This compo-nent during normal operation will not leave the column system through either the top decanter aqueous outlet stream or the column bottom stream. Therefore, proper design and operation of this system needs to be inves-tigated to prevent accumulation of this component inside the system. Ulrich and Morari11 examine the
influence of a fourth component impurity on the opera-tion and control of a heterogeneous azeotropic distilla-tion column for dewatering a heavy-boiling organic using methyl tert-butyl ether as a light entrainer. However, their emphasis is on choosing appropriate different control schemes with/without various impuri-ties. The encountered problem due to impurity is not the same as that described in this paper.
The organization of this paper is as follows. Section 2 will describe the steady-state and dynamic simulations of the studied industrial column. The accumulation of this component inside the column system is illustrated via rigorous dynamic simulation. Section 3 proposes adding a side stream to solve the impurity accumulation problem. The side-draw location and its flow rate are determined to minimize the TAC of this system. Closed-loop dynamic simulations are performed to test this configuration. Section 4 studies an alternative operating Figure 1. Process flowsheet of an industrial unit.
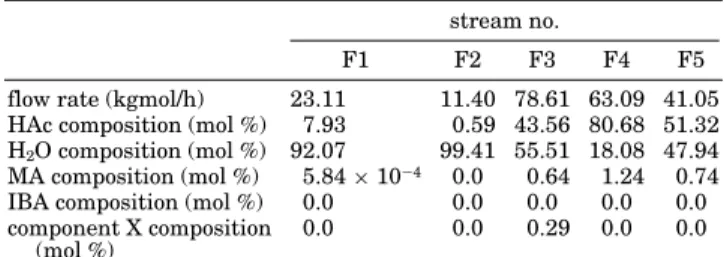
Table 1. Feed Stream Information of an Industrial Column
stream no.
F1 F2 F3 F4 F5
flow rate (kgmol/h) 23.11 11.40 78.61 63.09 41.05 HAc composition (mol %) 7.93 0.59 43.56 80.68 51.32 H2O composition (mol %) 92.07 99.41 55.51 18.08 47.94
MA composition (mol %) 5.84× 10⁻⁴ 0.0 0.64 1.24 0.74
IBA composition (mol %) 0.0 0.0 0.0 0.0 0.0 component X composition
(mol %) 0.0 0.0 0.29 0.0 0.0 Table 2. Base-Case Condition of the No Feed Impurity Case
total no. of stages for the azeotropic column
21 (including reboiler) feed stages F1 at 5th stage (counting from
the top stage) F2 at 5th stage F3 at 10th stage F4 at 13th stage F5 at 14th stage feed flow rate and feed
composition
same as that in Table 1 entrainer makeup flow
rate (kgmol/h)
0.1231 (14.3 kg/h) reboiler duty (kW) 2855
organic reflux flow rate (kgmol/h)
128.9 aqueous reflux flow
rate (kgmol/h)
11.79 bottom flow rate (kgmol/h) 109.9
bottom composition HAc: 98.39 mol % (99.5 wt %) H2O: 1.61 mol %
MA: 2.27× 10⁻⁵mol % IBA: 6.49× 10⁻³mol % X: 0.0 mol %
aqueous outlet flow rate (kgmol/h)
107.3
top composition HAc: 3.16× 10⁻²mol % (0.1 wt %) H2O: 98.38 mol %
MA: 1.48 mol % IBA: 1.08× 10⁻¹mol % X: 0.0 mol %
Figure 2. Closed-loop sensitivity plot for a system without X impurity.
strategy when continuous side draw of a small flow rate is not practical in industry. An automatic purging strategy will be proposed in this section. This automatic purging strategy does not rely on any online composition measurement but just needs information on some tray temperature measurements. Closed-loop dynamic simu-lation will be shown in this section to test this automatic purging strategy. Some concluding remarks will be given in section 5.
2. The Studied Industrial Column and Its Computer Simulation
2.1. Column Simulation. The layout of the studied
industrial column can be seen in Figure 1. There are
five feed streams into a heterogeneous azeotropic distil-lation column. These five feed streams are all coming from the upstream process. The feed flow rates and their compositions are listed in Table 1. From Table 1, one can observe that there are four components in the feed streams including HAc, H2O, and small amounts of MA
and another component (abbreviated as X). The top vapor of the heterogeneous distillation column, after condensation to a temperature of 42.5 °C, enters a decanter to separate into two liquid phases. The organic phase containing mostly the entrainer IBA is recycled back to the column. The aqueous phase partly is recycled back to the column acting as a reflux stream and partly is withdrawn from the system as an aqueous outlet stream. A small amount of IBA makeup is also entered into the decanter to balance the small loss of IBA through the aqueous outlet stream and column bottom stream. A possible side stream is also included in Figure 1 to balance this component (X) in the overall system. The proper design of the side-stream location and its flow rate will be investigated in the next section. In this section, accumulation of this X component without this side stream will be demonstrated via rigorous dynamic simulation of this industrial column. Aspen Plus and Aspen Dynamics will be used for the rigorous simulation. Several preliminary runs were made to fit the plant data from the column outlet streams. In the simulation, the side stream is left out first so that accumulation of the X component can be demonstrated. A steady-state flowsheet is obtained first with the same feed conditions as those in Table 1 but without the small X component fed into the column through feed stream F3. The two specifications of this flowsheet are set as a bottom HAc purity of 99.5 wt % and a top HAc loss through the aqueous outlet stream with a purity of 0.1 wt %. The IBA makeup flow rate is set the same as that in the plant (0.123 kgmol/h or 14.3 kg/h).
Figure 3. Recommended overall control strategy for a system without X impurity.
In the simulation, the nonrandom two-liquid (NRTL) activity coefficient model was used for the vapor-liquid-liquid equilibrium (VLLE) of this system. The Hayden-O’Connell12second virial coefficient model with
association parameters was used to account for the dimerization of HAc in the vapor phase. The set of NRTL parameters for HAc, H2O, and IBA is obtained
from Chien et al.10Other NRTL parameters are mostly
obtained from the Aspen Plus data bank. Four pairs of NRTL parameters are estimated using the UNIFAC (Dortmund modified13) group contribution method
be-cause no experimental data can be found in the open literature or from the Aspen Plus data bank. They are IBA-MA, IBA-X, HAc-X, and MA-X. All other physi-cal properties such as vapor pressure, enthalpies, and densities of liquid and vapor, etc., are all obtained from the Aspen Plus data bank. The steady-state simulation result of each stream is listed in Table 2.
2.2. Control Strategy Used in the Dynamic Simu-lation. To dynamically show the influence of adding a
small flow rate of the X component into feed stream F3 on the overall column performance, the Aspen Plus simulation will be converted to dynamic simulation using Aspen Dynamics. The tray sizing option in Aspen Plus is utilized to calculate the column diameter as 1.58 m with a tray spacing of 0.6096 m is assumed. Other equipment sizing recommended by Luyben14 is used
here. The volume of the reboiler is sized to give 10 min of holdup with a 50% liquid level. The decanter is sized to be bigger to allow for two liquid phases to separate. A holdup time of 20 min is used in the dynamic simulation. Pressure-driven simulation in Aspen Dy-namics is used with the top pressure of the azeotropic column controlled at 1.1 atm to allow for some pressure drop in the condenser and decanter to give the decanter at atmospheric pressure. The pressure drop inside the column is automatically calculated in Aspen Dynamics. The overall control strategy is adapted from our previous study (Chien et al.10) when there were only
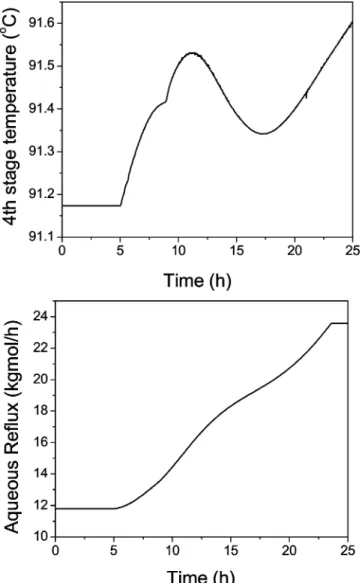
three main components in the system. No online com-position analyzer is needed in this recommended control strategy. This overall control strategy is very simple, requiring only one tray temperature control loop to hold the product specifications by manipulating the aqueous Figure 5. Dynamic response of the temperature profile with
impurity added at t ) 5 h.
Figure 6. Closed-loop response of the controlled temperature loop.
Figure 7. Column composition profile at t ) 25 h.
Figure 8. Dynamic accumulation of impurity X at the seventh stage.
reflux flow rate. The inventory control loops include the following: using organic reflux flow to control the organic phase level in the decanter; using top aqueous product flow to control the aqueous phase level in the decanter; using bottom HAc product flow to control the column bottom level. The column top pressure is con-trolled at 1.1 atm by manipulating the top vapor flow, and the decanter temperature is controlled at 42.5 °C by manipulating the condenser duty.
The determination of the temperature control point inside the column is from closed-loop sensitivity analy-sis. For the closed-loop sensitivity analysis, closed-loop simulation runs by fixing both the top and bottom product purities at their specifications during feed composition changes are made. This is to mimic the ideal (although not practical) situation with two online composition measurements and two composition control loops to set aqueous reflux flow and reboiler duty. The tray temperature with the smallest amount of variations under feed composition changes will be selected as the temperature control point. The specific feed composition changes are feed F3, H2O molar composition (10%
changes while keeping the total molar flow rate of F3 the same by adjusting the HAc molar composition. Figure 2 shows the deviation of temperature under this ideal control situation. The temperature at the fourth stage will be selected as the control point because of its smallest deviations from the base-case condition. There-fore, by holding the temperature at this control point, both the bottom and top product purities should be near their specifications. The other two “free” manipulated variables (reboiler heat duty and IBA makeup flow) are fixed and only adjusted according to the total molar feed flow rate using the ratio scheme.
Notice that using closed-loop sensitivity analysis to determine the control point is suitable for this study because the feed streams are essentially binary, with HAc and H2O as the two dominant components (see
Table 1). If there were significant amounts of nonkey components whose compositions in the feed can vary, this method of determining the control point may not be effective because the location of the “invariant stage temperature” will change for different feed compositions. The overall control strategy adapted from Chien et al.10is shown in Figure 3. This simple overall control
strategy was demonstrated by Chien et al.10to perform
very well despite feed flow rate and feed composition changes. A dynamic simulation will be shown next to illustrate the accumulation of the X component inside the column with the overall control strategy in opera-tion. In the dynamic simulation, all three level loops are assumed to be controlled by a P-only controller in order to smooth out their manipulated variables in the system. A controller gain of 2.0, as suggested by Luy-ben,14 is used in the aqueous level and bottom level
loops. A higher controller gain of 10.0 is used in the organic level loop because a faster dynamic response of adjusting the organic reflux flow into the system is desirable. The proportional-integral-derivative (PID) tuning constants for the stage temperature control loops are tuned using the Internal Model Control (IMC) tuning guideline by Chien and Fruehauf,15
with the initial dynamic open-loop response modeled as an integrating system plus dead time. The same tuning guidelines will be used in all of the closed-loop simulation runs for a fair comparison.
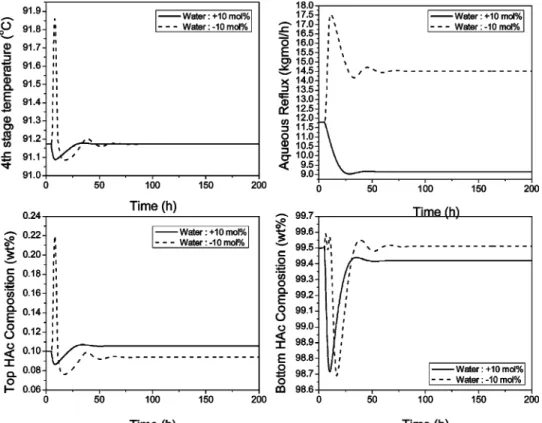
2.3. Dynamic Simulation Results. Before the run
with impurity accumulation inside the column is shown, the normal feed composition load disturbance changes are shown first. The feed F3, H2O molar composition
(10% changes are made at time ) 5 h. When the feed F3, H2O molar composition (10% change is made, the
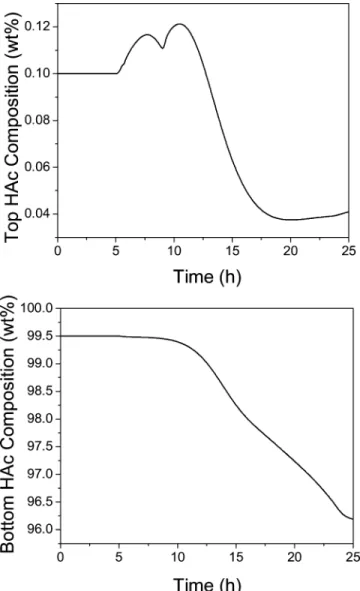
HAc molar composition is adjusted with the same amounts so that the total molar feed rate of F3 is maintained as constant. Figure 4 shows the closed-loop dynamic simulation with these feed composition load Figure 9. Dynamic response of the top and bottom product
compositions.
Figure 10. TAC plot to determine the side-stream location and its flow rate.
disturbances. From the figure, the fourth-stage temper-ature is controlled back to setpoint during load changes with smooth manipulation of the aqueous reflux flow rate. More importantly, the two product purities (in the bottom half of this figure) are maintained quite closely to their high-purity specifications of 99.5 wt % HAc in the column bottom and 0.1 wt % HAc in the aqueous outlet stream.
With this proper control strategy in operation, the next dynamic simulation run will put a small amount of 24.29 kg/h (0.23 kgmol/h) flow rate of the X compo-nent into feed stream F3 at time ) 5 h. Figure 5 shows the shifting in the column temperature profile at 10, 15, 20, and 25 h of closed-loop operation. The controlled and manipulated variables of the fourth-stage temper-ature control loop are shown in Figure 6. Notice that the aqueous reflux flow rate continuously goes up until the control valve is fully opened at time ) 23 h. The fourth-stage temperature was not able to be maintained at the setpoint value but with some deviation. The column composition profile of all components at time ) 25 h is shown in Figure 7. From the figure, the greatest accumulation of the X component occurs at the seventh stage. The dynamic accumulation of the X component at the seventh stage is shown in Figure 8. The top and bottom product specifications cannot be met with this small addition of this component into the column from feed F3. The dynamic responses of the top and bottom HAc compositions can be seen in Figure 9. Notice that the top HAc composition is purer than the specification of 0.1 wt % HAc loss. However, the main bottom HAc composition continuously drops from the specification of 99.5 wt %. At time ) 25 h, the bottom product HAc composition is dropped to an unacceptable value of 96.3 wt %. Because the X component will be accumulated inside the column, a side stream is necessary to take out this feed impurity.
3. Column with Continuous Side-Stream Draw-Off
3.1. Optimum Side-Stream Location and Its Flow Rate. The optimal side-stream location and its
flow rate will be investigated in this subsection. Aspen Plus steady-state simulation will be used in this study. The simulated flowsheet is similar to that in Figure 3 but with two differences. The first one is that the feed Figure 11. Closed-loop sensitivity plot for a system with
continu-ous side-steam draw-off.
stream F3 will have a 24.29 kg/h X component as in the dynamic simulation previously shown. The second difference is that a side stream will be added to the flowsheet of Figure 3. The two product specifications are still the same as those in the last section. They are a bottom HAc purity of 99.5 wt % and a top HAc loss through an aqueous outlet stream with a purity of 0.1 wt %. The IBA makeup flow rate is again set the same
as that in the plant (14.3 kg/h). Exhausted simulation runs are made to satisfy the above two product speci-fications (by manipulating the reboiler duty and aque-ous reflux) with varying side-stream location and flow rate. TAC is used as the objective function to be minimized. The calculation procedure of Douglas16 is
followed, with an annual capital charge factor of1/ 3. The
utility cost is calculated the same way as in work by Figure 13. Closed-loop test for the side-draw system with (20% changes of the impurity flow rate (the side-draw flow rate is set at 50 kg/h).
Figure 14. Closed-loop test for the side-draw system with (20% changes of the impurity flow rate (the side-draw flow rate is set at 60 kg/h).
Chiang et al.17The operating costs in the TAC
calcula-tion include the utility cost, the IBA makeup stream cost, and also an additional term for the cost of side-draw HAc loss.
Figure 10 shows the summary of many simulation runs with varying side-stream location and flow rate. The two product specifications cannot be met when the
side-draw flow rate is below 30 kg/h because most of the impurity X has to come out from this side stream. The minimum TAC is at the side-stream location of the 10th stage, counting from the top stage, and the flow rate is set at 50 kg/h. Notice that the optimum side-stream location is right at the feed F3 location, where this impurity X enters the column. When the side-stream location is fixed at the 10th stage, a smaller purge rate will result in more reboiler duty and aqueous reflux to hold the product specifications. Consequently, the energy cost will be higher. Furthermore, with higher vapor rate inside the column, the column diameter needs to be larger, causing the capital cost to be higher also. However, because the purge rate is smaller, the HAc loss through the side draw is lower. This optimum side-stream purge rate of 50 kg/h is a tradeoff of all of the above-mentioned costs.
3.2. Closed-Loop Dynamic Simulations with Load Disturbances. In this subsection, two load
distur-bances are introduced to test the proposed column configuration. The overall control strategy in Figure 3 Figure 15. Base-case column composition profiles for a system
without impurity and for a system with impurity and side stream.
Table 3. Comparison of Base-Case Operating Conditions in Sections 2 and 3 base case in section 2
base case in section 3 (side draw with 50 kg/h)
base case in section 3 (side draw with 60 kg/h)
column diameter (m) 1.58 2.31 2.31
entrainer makeup flow rate (kgmol/h)
0.1231 0.1231 0.1231
reboiler duty (kW) 2855 5914 5885
organic reflux flow rate (kgmol/h))
128.9 248.5 247.8
aqueous reflux flow rate (kgmol/h)
11.79 144.4 143.2
side-draw flow rate (kgmol/h)
0.0 1.09 (50 kg/h) 1.41 (60 kg/h)
side-draw composition HAc: 20.08 mol % HAc: 22.04 mol % H2O: 58.11 mol % H2O: 60.96 mol % MA: 0.06 mol % MA: 0.05 mol % IBA: 1.13 mol % IBA: 0.98 mol % X: 20.62 mol % X: 15.97 mol % bottom flow rate
(kgmol/h)
109.9 109.6 109.5
bottom composition HAc: 98.39 mol % (99.5 wt %) HAc: 98.39 mol % (99.5 wt %) HAc: 98.39 mol % (99.5 wt %) H2O: 1.61 mol % H2O: 1.61 mol % H2O: 1.61 mol %
MA: 2.27× 10⁻⁵mol % MA: 3.38× 10⁻⁶mol % MA: 3.38× 10⁻⁶mol % IBA: 6.49× 10⁻³mol % IBA: 5.24× 10⁻³mol % IBA: 3.98× 10⁻³mol % X: 0.0 mol % X: 2.81× 10⁻³mol % X: 1.85× 10⁻³mol % aqueous outlet flow
rate (kgmol/h)
107.3 106.7 106.4
top composition HAc: 3.16× 10⁻²mol % (0.1 wt %) HAc: 3.16× 10⁻²mol % (0.1 wt %) HAc: 3.16× 10⁻²mol % (0.1 wt %) H2O: 98.38 mol % H2O: 98.38 mol % H2O: 98.38 mol %
MA: 1.48 mol % MA: 1.49 mol % MA: 1.49 mol % IBA: 1.08× 10⁻¹mol % IBA: 9.84× 10⁻²mol % IBA: 9.85× 10⁻²mol % X: 0.0 mol % X: 5.05× 10⁻⁴mol % X: 4.97× 10⁻⁴mol %
Figure 16. Dynamic response of the temperature at each stage when the side-stream valve is closed at t ) 5 h.
is also implemented here. The only difference is with the design change of an additional side stream at the 10th stage with the flow rate controlled at 50 kg/h. The two load disturbances considered are feed F3, H2O
molar composition (10% changes and feed F3, X component flow rate (20% changes.
The closed-loop sensitivity analysis is again made in order to choose the proper tray temperature as the control point. Similar runs are made to hold two product purities under the two above-mentioned load distur-bances. Similar to Figure 2, Figure 11 shows the deviation of each tray temperature under the ideal control situation by holding two product purities. The temperature at the ninth stage is selected as the control point because of its smallest deviations from the base-case condition.
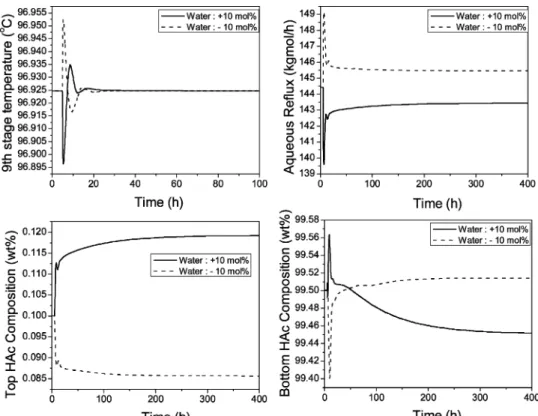
Figure 12 shows the closed-loop simulation runs with (10% changes in the feed F3, H2O molar composition.
Similar to the result in Figure 4, this overall control strategy is able to maintain the main bottom product purity specification very close to 99.5 wt % HAc. The HAc loss through the top aqueous product is a little more when under a +10% H2O composition load change.
The HAc composition in the top aqueous product goes
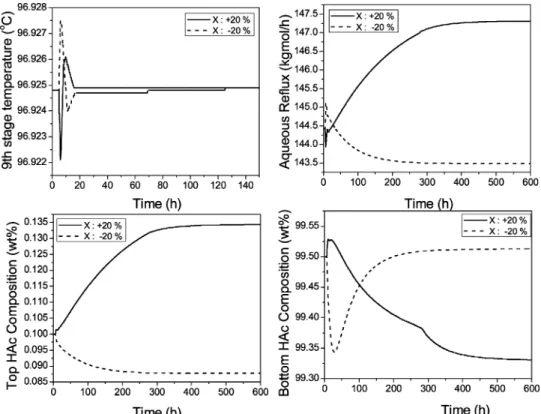
up to 0.118 wt % at this load change. Figure 13 shows the closed-loop simulation with (20% changes in the feed F3, impurity (X) component flow rate. The closed-loop response is not as good as that in Figure 12 with the load disturbance when the feed H2O composition
changes. This small impurity is coming from an up-stream extraction process. (20% variations of the feed F3, impurity (X) component flow rate, although unlikely, are still possible. With these small F3 impurity changes, the product purities of both the top and bottom products are further away from their specifications in comparison with the feed H2O disturbances. For example, with
small +20% changes in feed F3, impurity component flow rate (from 24.29 to 29.15 kg/h), the main bottom purity goes down to 99.33 wt % HAc and the top aqueous purity goes up to 0.134 wt % HAc. Because there are two other potential manipulated variables (reboiler heat duty and side-draw flow rate) for product quality con-trol, more complicated two-point or even three-point temperature control strategies can be considered. How-ever, in this paper, more practical and simpler control strategies that can easily be used in industry are considered. Thus, in the next subsection, a more con-servative base case with a higher side-draw flow rate Figure 17. Automatic purging at the side-stream location with a base-case impurity flow rate.
is selected to demonstrate its capability in better handling of feed impurity variations.
3.3. Higher Side-Stream Flow Rate Case. Because
in the last subsection the base-case operating condition that optimizes TAC is not able to handle properly the impurity disturbance changes in the (20% range, the side-stream flow rate is set higher than that of the optimum case of 50 kg/h in order to better handle these disturbances in the feed F3. A side-stream flow rate of 60 kg/h is used here for illustration purposes. Notice that, with side-stream flow rate increases from 50 to 60 kg/h, the TAC is only increased by 0.66% (see Figure 10).
Figure 14 shows the closed-loop simulation with (20% changes in the feed F3, impurity (X) component flow rate at this new base-case condition. Notice that, for the +20% case, the bottom product purity is back to the product specification of 99.5 wt % HAc and the top aqueous product purity is also much better than the one in Figure 13 (0.113 wt % in this figure vs 0.134 wt % in Figure 13). With the alternative selection of the base-case operating condition a little off than the optimum TAC case, the capability of handling the feed impurity variations is improved.
3.4. Comparison of the Base Cases in Section 2 and in This Section. The base-case condition in section
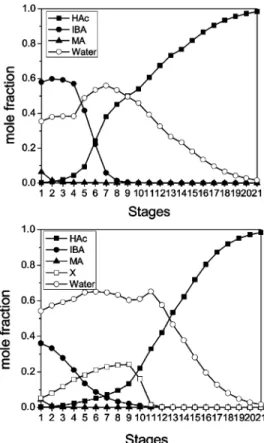
2 with no side draw and no feed impurity is compared with the ones in this section. Figure 15 displays the column composition profiles for the base case in section 2 and the optimum TAC case in this section with a side-draw flow rate of 50 kg/h. With the same specifications of 99.5 wt % HAc in the bottom product and 0.1 wt % HAC in the top aqueous product, the HAc and H2O
composition profiles of the two base cases are similar. The major difference is the IBA composition profiles inside the column. The IBA composition inside the top parts of the column is lower than the case with no side draw and no feed impurity. Also, even with a very small amount of impurity in the feed, the impurity composi-tion inside the column is quite high.
Table 3 compares the operating conditions of the three base cases studied in this paper. Notice that, with the addition of such a tiny amount of impurity in the feed, the operating condition is drastically changed. The reboiler heat duty is more than doubled for the two base cases with side draw in comparison with the one without side draw and feed impurity. The organic reflux flow rate and the aqueous reflux flow rate are also increased Figure 18. Automatic purging at the side-stream location with +20% of the impurity flow rate.
considerably. Because of the difference of the vapor traffic inside the column, the column diameters will be quite different too.
From the above information, one can calculate the TAC and operating cost savings if somehow this impu-rity can be designed to not come into this column from the upstream extraction process. With no feed impurity, the TAC and operating cost savings are calculated to be 28% and 24%, respectively, from the optimum TAC case with feed impurity and side stream. This shows that a large incentive can be realized if some innovative ways can be implemented in the upstream process to get rid of this impurity by methods such as permeation, adsorption, reaction, etc. Because the alternative method to not letting this impurity enter this column is beyond the scope of this paper, we will not discuss this method any further. If this impurity is inevitably present in the feed stream, the side stream is then needed with higher reboiler heat duty and higher organic and aqueous reflux flow rates.
4. Side Draw with a Practical Automatic Purging Strategy
Because the side-draw flow rate of 50 or 60 kg/h is a small flow rate for a large industrial column, the
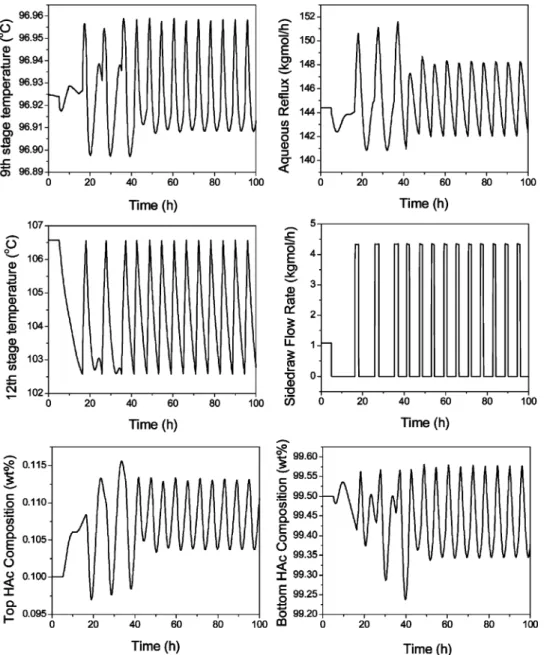
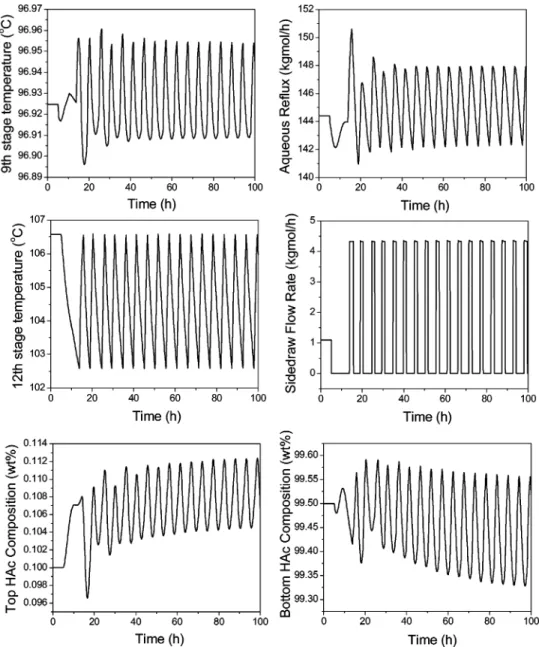
pipe-line of the side stream may be too small to be practical. Problems for a small pipeline in industry may include the following: difficult to throttle the flow rate, frequent plugging of the line, etc. For comparison purposes, the other two outlet streams (bottom and aqueous outlet) are with flow rates of 6510 and 2022 kg/h, respectively. A more practical operating method of the side stream is to use an automatic purging strategy for a larger side-stream line. A side-side-stream line of 200 kg/h when the valve is fully opened is used as an example in this section. The side stream will be scheduled to fully open periodically to purge out the troublesome feed impurity. To select a tray temperature as an indication for such an action, the following simulation run is made to start from the base case with continuous side-draw flow rate of 50 kg/h in previous section 3.2. In Figure 16, the side-stream valve is fully closed at time ) 5 h with the ninth-stage temperature control loop in the automatic control mode. From the figure, one observes that the temper-ature at the 12th stage is the stage with the largest deviation from its steady-state value. Therefore, the temperature of this stage is selected to trigger the opening mode of the side-stream valve. A very simple purging strategy is used here for demonstration pur-poses of the feasibility of such an operation. The opening Figure 19. Automatic purging at the side-stream location with -20% of the impurity flow rate.
of the side-stream valve is activated when there is a 4 °C drop in the 12th-stage temperature from its original steady-state value. This valve is returned to fully closed mode when the temperature at the 12th stage is back to its original steady-state value.
Figure 17 shows the dynamic run with such an automatic purging strategy. Starting from the base case in section 3.2, at time ) 5 h the side-stream valve is fully closed and the automatic purging strategy is activated. From the figure, one observes that the side-stream valve is switching back and forth from fully opened to fully closed modes to periodically purge out the impurity. The ninth-stage temperature control loop is still in automatic control mode to handle other feed disturbances. The top and bottom product compositions are cycling around their product specifications. The “averaged” bottom HAc composition is at 99.45 wt %, and the “averaged” top HAc composition is at 0.1076 wt %. Both are very close to their high-purity specifica-tions.
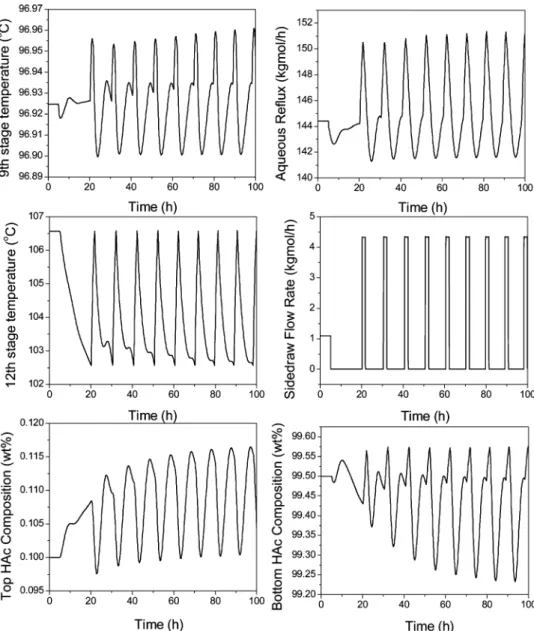
The following two figures show the dynamic runs with changes in the feed impurity component flow rate at time ) 5 h. Figures 18 and 19 show the +20% and -20% changes in this feed impurity flow rate, respectively. Notice that, from Figure 18, because the feed impurity component flow rate is higher, the opening of the side-stream valve is automatically more frequent with this purging strategy. Similarly, in Figure 19, because the feed impurity component flow rate is lower, the opening of the side-stream valve is less frequent. The “averaged” bottom and top HAc compositions are at 99.43 and 0.1075 wt %, respectively, for a +20% feed impurity component flow rate. The “averaged” bottom and top HAc compositions are at 99.43 and 0.1088 wt %, respectively, for a -20% feed impurity component flow rate. All three simulation runs result in quite acceptable bottom and top product purities with this simple purg-ing strategy.
5. Conclusion
The design and operation of an industrial column for HAc dehydration with feed impurity is investigated. This feed impurity component during normal operation will not leave the column system through either the top decanter aqueous outlet stream or the column bottom stream. The accumulation of this component inside the column system is illustrated via rigorous dynamic simulation. A side stream is proposed in this paper to solve the accumulation problem of this component. The appropriate side-stream location and its flow rate are determined by TAC analysis.
There is a great influence of this small feed impurity on the design and operation of the column. With the same purity specifications on both the top and bottom products, the column system with feed impurity requires a much larger TAC and operating cost in comparison with the design of the no feed impurity case. A very simple overall control strategy is proposed for the column system with feed impurity and continuous side-stream draw-off. To handle wider ranges of the feed impurity variations, the flow rate of the side stream should be set a little higher than the optimum case.
Because the flow rate of the side stream is quite small, an alternative way to periodically purge out this
impu-rity is also proposed in this paper. This automatic purging strategy does not rely on any online composition measurement but just needs information on the 12th-stage temperature measurements. Closed-loop dynamic simulation demonstrates that the proposed purging strategy can successfully keep the column under normal operation with both product purities at their specifica-tions despite feed impurity variaspecifica-tions.
Acknowledgment
This work is supported by the National Science Council of the R.O.C. under Grant NSC 90-2214-E-011-013
Literature Cited
(1) Othmer, D. F. Azeotropic Separation. Chem. Eng. Prog.
1963, 59 (6), 67-78.
(2) Pham, H. N.; Doherty, M. F. Design and Synthesis of Heterogeneous Azeotropic DistillationssIII. Column Sequences. Chem. Eng. Sci. 1990, 45 (7), 1845-1854.
(3) Tanake, S.; Yamada, J. Graphical Calculation Method for Minimum Reflux Ratio in Azeotropic Distillation. J. Chem. Eng. Jpn. 1972, 5, 20-26.
(4) Othmer, D. F. Azeotropic Distillation for Dehydrating Acetic Acid. Chem. Metall. Eng. 1941, 40, 91-95.
(5) Siirola, J. J. In An Industrial Perspective on Process Synthesis; Biegler, L. T., Doherty, M. F., Eds.; AIChE Symposium Series 304; CACHE: Austin, TX, 1995; Vol. 91, pp 222-233.
(6) Wasylkiewicz, S. K.; Kobylka, L. C.; Castillo, F. J. L. Optimal Design of Complex Azeotropic Distillation Columns. Chem. Eng. J. 2000, 79, 219-227.
(7) Luyben, M. L.; Tyreus, B. D. An Industrial Design/Control Study for the Vinyl Acetate Monomer Process. Comput. Chem. Eng. 1998, 22 (7 and 8), 867-877.
(8) Kurooka, T.; Yamashita, Y.; Nishitani, H.; Hashimoto, Y.; Yoshida, M.; Numata, M. Dynamic Simulation and Nonlinear Control System Design of a Heterogeneous Azeotropic Distillation Column. Comput. Chem. Eng. 2000, 24 (2-7), 887-892.
(9) Gaubert, M. A.; Gerbaud, V.; Joulia, X.; Peyrigain, P. S.; Pons, M. Analysis and Multiple Steady States of an Industrial Heterogeneous Azeotropic Distillation. Ind. Eng. Chem. Res. 2001, 40 (13), 2914-2924.
(10) Chien, I. L.; Zeng, K. L.; Chao, H. Y.; Liu, J. H. Design and Control of Acetic Acid Dehydration System via Heterogeneous Azeotropic Distillation. Chem. Eng. Sci. 2004, 59 (21), 4547-4567. (11) Ulrich, J.; Morari, M. Influence of Impurities on the Control of Heterogeneous Azeotropic Distillation Columns. Ind. Eng. Chem. Res. 2002, 41 (2), 230-250.
(12) Hayden, J. G.; O’Connell, J. P. A Generalized Method for Predicting Second Virial Coefficients. Ind. Eng. Chem. Process Des. Dev. 1975, 14 (3), 209-216.
(13) Weidlich, U.; Gmehling, J. A Modified UNIFAC Model. 1. Prediction of VLE, hE, and γ∞. Ind. Eng. Chem. Res. 1987, 26 (7),
1372-1381.
(14) Luyben, W. L. Plantwide Dynamic Simulators in Chemical Processing and Control; Marcel Dekker: New York, 2002.
(15) Chien, I. L.; Fruehauf, P. S. Consider IMC Tuning to Improve Controller Performance. Chem. Eng. Prog. 1990, 86 (10), 33-41.
(16) Douglas, J. M. Conceptual Process Design; McGraw-Hill: New York, 1988.
(17) Chiang, S. F.; Kuo, C. L.; Yu, C. C.; Wong, D. S. H. Design Alternative for the Amyl Acetate Process: Coupled Reactor/ Column and Reactive Distillation. Ind. Eng. Chem. Res. 2002, 41 (13), 3233-3246.
Received for review January 27, 2005 Revised manuscript received March 22, 2005 Accepted March 24, 2005