Peritoneal Dialysis
Jainn-Shiun Chiu
1,3, Wei-Tung Lin
2, Yu-Chuan Li
3, Yuh-Feng Wang
1 1Department of Nuclear Medicine, Buddhist Dalin Tzu Chi General Hospital, Dalin, Chiayi, Taiwan
2Division of Nephrology, Department of Internal Medicine, Buddhist Dalin Tzu Chi General Hospital,
Dalin, Chiayi, Taiwan
3
Graduate Institute of Medical Informatics, Taipei Medical University, Taipei, Taiwan
Received 10/26/2004; revised 12/16/2004; accepted 12/29/2004.
For correspondence or reprints contact: Yuh-Fang Wang, M.D., Department of Nuclear Medicine, Buddhist Dalin Tzu Chi General Hospital, 2 Minsheng Road., Dalin, Chiayi 622, Taiwan. Tel: (886)5-2648000 ext. 5700, Fax: (886)5-2648508, E-mail: [email protected]
Results: The generalized regression neural network (SDR = 0.74) was the final best ANN model. The rela-tionship between RIA-iPTH and ANN-iPTH is described by Passing and Bablok regression ANN-iPTH = 90.52 + 0.55 Ű RIA-iPTH, with 95% confidence interval for intercept 23.08 to 122.83 and for slope 0.30 to 1.16, indicating that both methods are interchangeable with-out statistically significant deviation (P > 0.10).
Conclusion: ANN can accurately predict plasma iPTH concentration in uremic patients on CAPD. It is useful and beneficial to assess renal osteodystrophy frequent-ly and led to proper treatment.
Key words: neural network, intact parathyroid hor-mone, continuous ambulatory peritoneal dialysis Ann Nucl Med Sci 2005;18:135-141
Renal osteodystrophy includes several skeletal disor-ders that primarily occur in patients with renal failure. In gen-eral, these include high turnover bone disease (osteitis fibrosa and mixed lesions) due to persistently high levels of parathy-roid hormone (PTH) and low turnover bone disease (osteo-malacia and adynamic lesions) associated with relatively low levels of PTH. Obviously, PTH plays an important role in the pathogenesis of renal osteodystrophy. According to the K/DOQI Clinical Practice Guidelines for Bone Metabolism and Disease in Chronic Kidney Disease published by National Kidney Foundation [1], the guideline suggests that
Background: Measuring plasma intact parathyroid hor-mone (iPTH) concentration is essential to evaluate renal osteodystrophy. Although frequent measurement is needed to avoid inadequate prescription of phos-phate binder and vitamin D preparations, it is not cost-effective in some clinics. For this purpose, we devel-oped an artificial neural network (ANN) to predict plas-ma iPTH concentration in uremic patients on continu-ous ambulatory peritoneal dialysis (CAPD).
Methods: The study population consisted of 23 stable patients (11 male and 12 female, aged 48.8 ± 15.3 years) on CAPD for more than 3 months. Among ANN models, the predictors included plasma calcium, phos-phate, alkaline phosphatase concentrations, and calci-um-phosphate product. The dependent variable was plasma iPTH concentration measured by radioim-munoassay (RIA-iPTH). Leave-one-out cross-validation was adopted to iron out generalization problems caused by finite population. The least ratio of standard deviation (SDR) was used to choose the best ANN model. For comparing the performance between predic-tive plasma iPTH concentration by ANN (ANN-iPTH) and RIA-iPTH, the correlation coefficient (r), mean error, and Passing and Bablok regression were evaluat-ed.
the frequency of measuring PTH should be monitored every three months in dialytic patients. Physicians and nephrolo-gists will adjust the adequate prescription of phosphate binders and/or vitamin D preparations under the value of plasma PTH concentration to avoid further exacerbation in renal osteodystrophy.
An artificial neural network (ANN) consists of a set of processing elements which simulates the human neurons. These processing elements are interconnected via a set of “weights” analogous to synaptic connections in the human nervous system in a way which allows signals to travel through the network in parallel as well as serially [2]. ANN are applicable in virtually every situation in which a relation-ship between the predictor variables (independents, inputs) and predicted variables (dependents, outputs) exists, even when the relationship is very complex or not easy to formu-late in the usual terms of “correlations” or “differences between groups”. In other words, ANN provides a way to actively incorporate both past and present knowledge, to extract information, to map correlations and to produce inferences from available data. ANN has become well estab-lished as robust computational methodologies with reliable theoretic support and with strong potential to be effective in the fields of internal medicine [3-5] and nuclear medicine [6].
In past years, overt emphasizing the prevention of renal osteodystrophy increased the prevalence of adynamic bone lesions following the overuse of phosphate binders and vita-min D preparations. So it is reasonable to monitor plasma intact parathyroid hormone (iPTH) concentration measured by K/DOQI-recommended radioimmunoassay (RIA) fre-quently to guide the proper therapy in both hemodialysis and peritoneal dialysis patients but the cost will intensify the bur-den of health insurance in our country. The aim of present study is to evaluate the ability of ANN in predicting plasma iPTH concentration in uremic patients on continuous ambu-latory peritoneal dialysis (CAPD). At the same time, these ANN models will be compared with plasma iPTH concentra-tion measured by RIA, which is the current reference method used in clinical nephrology. To date with literature search in PubMed and the best of our knowledge, this is the first investigation using ANN to predict plasma iPTH
concentra-tion in uremic patients on CAPD.
Methods
We retrospectively analyzed our database of CAPD patients with a final study population of 23 stable patients (11 male and 12 female, aged from 16 to 76 years with an average age of 48.8 ± 15.3 years) on CAPD for more than 3 months. For the quantitative prediction of plasma iPTH con-centration, we used the software package STATISTICA Neural Networks 6.0 (StatSoft, Inc., Oklahoma, US) to gen-erate various formulations of ANN models. The automatic network designer decided an appropriate architecture, using a combination of heuristic and optimized approach. It con-ducted a large number of tests, which were used to decide the best architecture. It could automatically compare linear model, multilayer perceptron (MLP) model, radial basis function (RBF) model, generalized regression neural net-work (GRNN) model and automatically choose the smooth-ing factor and the number of units for these models [7,8].
To choose the adequate variables from monthly bio-chemical examination, we selected the most relevant para-meters, used in clinical dialysis, such as plasma calcium (Ca), phosphate (P), alkaline phosphatase (ALP) concentra-tions, and Ca-P product to be the input variables in training ANN models. Plasma Ca, P, and ALP concentrations were measured by automatic biochemistry analyzer (Hitachi 7170; Hitachi Co., Tokyo, Japan) and plasma iPTH concentration was measured by RIA (Active I-PTH DSL-8000; Diagnostic Systems, Laboratories, Inc., Webster, TX, USA). All these plasma biochemistries were collected in the same month. The outcome variable was plasma iPTH concentration mea-sured by RIA (RIA-iPTH) and the predicted output was esti-mated by ANN (ANN-iPTH).
For solving the statistical problem of finite patients in our study, leave-one-out cross-validation (LOOCV) was employed to avoid the possible bias introduced by relying on any one particular division into test and train components [9]. The LOOCV procedure involves removing one case from the training data; training is done on the basis of remaining data and then testing is done on this removed case. In this manner, if the training data consist of 100 cases, then 100 networks are produced by using each of the case as
test set while using the other case as the training data. This is the most extreme test of the cross validation. It is the most accurate way to estimate the performance of method when the training data is small. After training and testing in a regression problem of the ANN models, the ratio of the pre-diction error standard deviation (SD) to the original output data SD, called the ratio of SD (SDR), will be calculated by STATISTICA Neural Network. A lower SDR will give a bet-ter prediction in debet-termining the final best ANN model.
Statistical analysis was performed using MedCalc for Windows 7.4.1.1 (MedCalc Software Inc., Mariakerke, Belgium). To test the performance of the estimates, ANN-iPTH was compared with RIA-ANN-iPTH using Pearson’s correla-tion coefficient (r) and mean predictive error in Bland-Altman comparison [10]. The mean predictive error is an indication of bias and higher correlation means that the mea-surements by two methods are linearly correlated but this condition does not mean that the two methods agree. To compare the agreement and interchangeability of two meth-ods, the Passing and Bablok regression describes a linear regression procedure with no special assumptions regarding the distribution of the samples and the measurement errors
[11,12]. The result does not depend on the assignment of the methods to X and Y. The slope B and intercept A are calcu-lated with their 95% confidence interval. These confidence intervals are used to determine whether there is only a chance difference between B and 1 and between A and 0. The significance level in this study was defined as P < 0.05.
Results
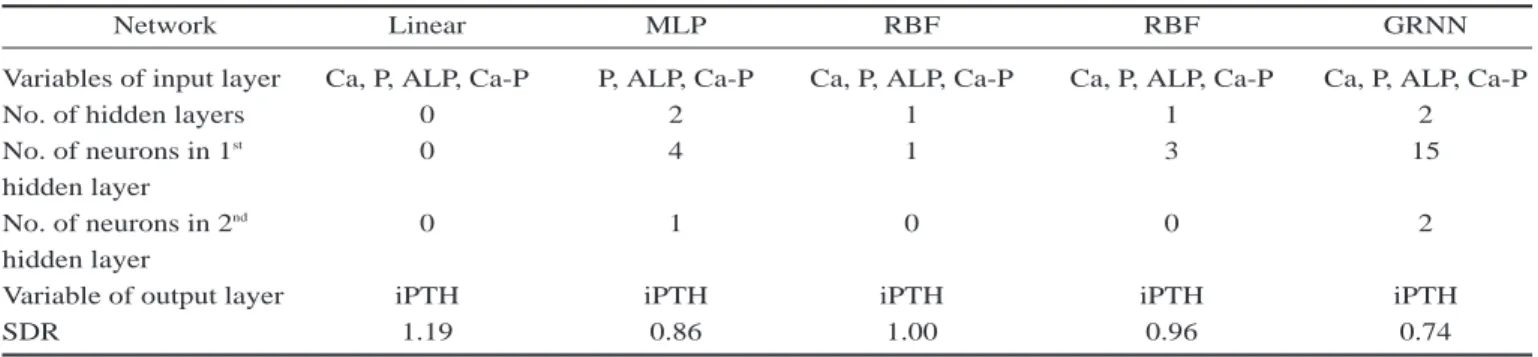
The final five networks were retained after training and validation of 1000 networks (Table 1).The best ANN model was a GRNN (SDR = 0.74), which had an input layer with 4 nodes, two hidden layers with 15 nodes and 2 nodes, and an output layer with 1 node (Figure 1). The results of selected biochemistries, RIA-iPTH, and ANN-iPTH were presented in Table 2. The RIA-iPTH and ANN-iPTH were 171.26 ± 40.99 and 198.73 ± 21.60, respectively which were not sta-tistically different compared by performing paired t-test (P = 0.37).
The r value for the correlation between RIA-iPTH and ANN-iPTH was 0.70 (P = 0.0003). The mean predictive error was 0.82 (upper limit and lower limit of limits of agree-ment were 1.97 and -0.33, respectively) by using the ratio of
Table 1. The final five models of ANN after training and validation of 1000 networks
Network Linear MLP RBF RBF GRNN
Variables of input layer Ca, P, ALP, Ca-P P, ALP, Ca-P Ca, P, ALP, Ca-P Ca, P, ALP, Ca-P Ca, P, ALP, Ca-P
No. of hidden layers 0 2 1 1 2
No. of neurons in 1st 0 4 1 3 15
hidden layer
No. of neurons in 2nd 0 1 0 0 2
hidden layer
Variable of output layer iPTH iPTH iPTH iPTH iPTH
SDR 1.19 0.86 1.00 0.96 0.74
Table 2. The results of selected biochemistries, RIA-iPTH, and ANN-iPTH
Biochemistries Mean ± SE Minimum Maximum
Ca (mg/dl) 8.96 ± 0.25 6.68 10.96 P (mg/dl) 5.22 ± 0.28 2.90 7.60 ALP (IU/L) 146.33 ± 7.83 94.00 240.00 Ca-P product 46.52 ± 2.65 27.14 68.60 RIA-iPTH (pg/ml) 171.26 ± 40.49 9.64 828.70 ANN-iPTH (pg/ml) 198.73 ± 21.60 89.80 519.62
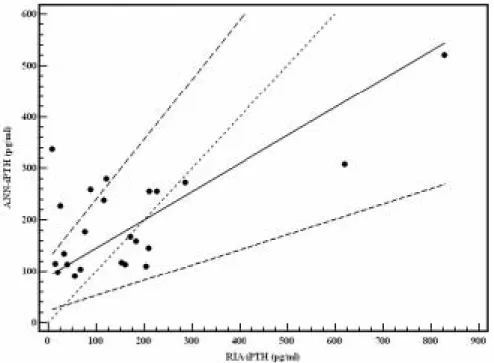
RIA-iPTH and ANN-iPTH against average of RIA-iPTH and ANN-iPTH in Bland-Altman comparison. The significantly higher r value and less mean predictive error represented that the ANN model had less bias and high accuracy. In the Passing and Bablok regression, the relationship between RIA-iPTH and ANN-iPTH was described by ANN-iPTH = 90.52 + 0.55 Ű RIA-iPTH, with 95% confidence interval for intercept 23.08 to 122.83 and for slope 0.30 to 1.16, indicat-ing that both methods are interchangeable without statistical-ly significant deviation (P > 0.10).
We also used these four predictors in the multiple linear regression and its coefficient of determination was 0.16. Comparing correlation coefficient of ANN (r = 0.70) and multiple linear regression (r = 0.16) based on RIA-iPTH, the correlation was significantly higher in ANN (P = 0.03).
Discussion
In our study, ANN over plasma iPTH concentration in CAPD patients but it could predict plasma iPTH concentra-tion accurately with less bias according to the results of mean predictive error in the Bland-Altman comparison and the Passing and Bablok regression.
The regulation of PTH in dialytic patients depends on the complicated interconnections among many contributors including age, gender, diabetes, duration on dialysis, renal function, Ca, magnesium (Mg), P, ALP, vitamin D, albumin, C-reactive protein, PTH gene transcription, skeletal resis-tance to the calcemic action of PTH, dialysis itself, metabol-ic acidosis, Ca sensing receptor, vitamin D receptor, and lab-oratory available protein markers etc. In previous study relat-ed to our study, Navarro JF et al. [13] utilizrelat-ed demographic data and several serum biochemistries (ALP, Ca, Mg, P, and albumin etc) of 110 CAPD patients to analyze the correlation between the iPTH. The results demon-strated that only P and Mg predicted iPTH values (iPTH = -35 ė 135 Ű Mg + 23 Ű P, r = 0.59, P < 0.001) in multi-ple linear regression . In our study, for the purpose of simplification in clinical practice, we only selected three common biochemistries (Ca, P, and ALP) with Ca-P product, which are ordinary monitored in dialytic unit monthly, to predict the plasma iPTH concentration in the ANN model and the correlation was much bet-ter than the conventional multiple linear regression (0.70 vs. 0.16, P < 0.05). Comparing r values between ANN and the finding of Navarro JF, although the difference were not statistically signifi-cant (0.70 vs. 0.59, P = 0.44), our ANN model had higher value. In particularly,
Figure 1. Topology of an (4 Ű 15 Ű 2 Ű 1) ANN model
input Layer
Hidden layer
Output layer
Figure 2. The Passing and Bablok regression shows a scatter diagram with the regression line (solid line), the confidence interval for the regression line (dashed lines) and identity line (x = y, dotted line).
the patients participated in our study were less than theirs. We took advantage of the LOOCV procedure, which is a kind of resampling method, to overcome this problem. Also, we employed just four predictors, still less than predictors used in theirs, to achieve the similar results. Although the r values were comparable in these two studies, this easy com-parison could not truly represent which one is better. If the original data of the study by Navarro JF et al. is available, we could use the folded empirical cumulative distribution plot [14], Deming regression model [15], or Passing and Bablok regression to compare the superiority of these two studies.
Except the small numbers of study population, which was resolved by the LOOCV procedure to decrease the pos-sibly internal bias, there were some notable limitations. First, although we used four predictors to obtain the better perfor-mance of ANN, we still expect more variables in the feature study. Second, our study was carried out at a single institute. The better protocol is to train the ANN model using the patients in an independent dialytic unit and validate other cases at another dialytic unit. The way for crossing multi-centers study will decrease the bias further. Future studies will focus on developing the web-based platform using our ANN as kernel engine to let the clinicians to evaluate the plasma iPTH concentration in real time. Additional benefit is that the performance of ANN will be continuously improved over time when more data collected to retrain the ANN model.
Conclusion
We have illustrated that the use of ANN makes possible to obtain a good prediction of plasma iPTH concentration in CAPD patients. We can use this model to save the cost of the RIA if the clinicians want to monitor plasma iPTH concen-tration frequently. The quicker and more accurate in predict-ing plasma iPTH concentration by uspredict-ing ANN model, the more benefits and proper treatments could be brought to the CAPD patients. We deeply believe that ANN may be a use-ful tool for physicians and nephrologists to treat the CAPD patients in clinical practice.
References
1. National Kidney Foundation. K/DOQI clinical practice guidelines for bone metabolism and disease in chronic kidney disease. Am J Kidney Dis 2003;42(Suppl 3):S1-S201.
2. Cross SS, Harrison RF, Kennedy RL. Introduction to neural networks. Lancet 1995;346:1075-1079.
3. Dayhoff JE, DeLeo JM. Artificial neural networks: open-ing the black box. Cancer 2001;91:1615-1635.
4. Rodvold DM, McLeod DG, Brandt JM, Snow PB, Murphy GP. Introduction to artificial neural networks for physicians: taking the lid off the black box. Prostate 2001;46:39-44.
5. Ramesh AN, Kambhampati C, Monson JR, Drew PJ. Artificial intelligence in medicine. Ann R Coll Surg Engl 2004;86:334-338.
6. Swietlik D, Bandurski T, Lass P. Artificial neural net-works in nuclear medicine. Nucl Med Rev Cent East Eur 2004;7:59-67.
7. Guan P, Huang DS, Zhou BS. Forecasting model for the incidence of hepatitis A based on artificial neural net-work. World J Gastroenterol 2004;10:3579-3582. 8. Chong CF, Li YC, Wang TL, Chang H. Stratification of
adverse outcomes by preoperative risk factors in coro-nary artery bypass graft patients: an artificial neural net-work prediction model. AMIA Annu Symp Proc 2003;160-164.
9. Yamamura S, Nishizawa K, Hirano M, Momose Y, Kimura A. Prediction of plasma levels of aminoglyco-side antibiotic in patients with severe illness by means of an artificial neural network simulator. J Pharm Pharm Sci 1998;1:95-101.
10. Bland JM, Altman DG. Statistical methods for assessing agreement between two methods of clinical measure-ment. Lancet 1986;1:307-310.
11. Passing H, Bablok W. Comparison of several regression procedures for method comparison studies and determi-nation of sample sizes. Application of linear regression procedures for method comparison studies in Clinical Chemistry, Part II. J Clin Chem Clin Biochem 1984;22:431-445.
12. Passing H, Bablok W. A new biometrical procedure for testing the equality of measurements from two different analytical methods. Application of linear regression pro-cedures for method comparison studies in clinical chem-istry, Part I. J Clin Chem Clin Biochem 1983;21:709-720.
13. Navarro JF, Mora C, Macia M, Garcia J. Serum magne-sium concentration is an independent predictor of
parathyroid hormone levels in peritoneal dialysis patients. Perit Dial Int 1999;19:455-461.
14. Krouwer JS, Monti KL. A simple, graphical method to evaluate laboratory assays. Eur J Clin Chem Clin Biochem 1995;33:525-527.
15. Cornbleet PJ, Gochman N. Incorrect least-squares regression coefficients in method-comparison analysis. Clin Chem 1979;25:432-438.
ᙷৠགྷშྮሀݭീాᜈّΞᛸёཛቯژ̝
Ԍ߲াঽଈ̝Ԇፋઘϥېཛྷ৵
1,3 2 3 1 1 2 3 ࡦഀĈ ͞ڱĈ 23 (11 12 48.8 ±15.3 ) (RIA-iPTH) leave-one-outPassing and Bablok (ANN-iPTH) ඕڍĈ 0.74 ANN-iPTH = 90.52 + 0.55 RIA-iPTH 95 % 23.08 122.83 0.30 to 1.16 (P > 0.10) ඕኢĈ ᙯᔣෟĈ ८̄ᗁᄫ2005;18:135-141 93ѐ10͡26͟צந 93ѐ12͡16࣒͟Լ 93ѐ12͡29͟ତצΏྶ ᓑඛˠĈͳߒᖳᗁर လཌྷᎩ622̂ڒᗉϔϠྮ2ཱི Ңି̂ڒຎᑻტЪᗁੰ८̄ᗁጯࡊ ྖĈ(05)-2648000ᖼ5700 ็ৌĈ(05)-2648508 ̄ܫቐĈ[email protected]