行政院國家科學委員會專題研究計畫 成果報告
交易對手風險,信用傳染與財務危機預測
研究成果報告(精簡版)
計 畫 類 別 : 個別型 計 畫 編 號 : NSC 98-2410-H-009-015- 執 行 期 間 : 98 年 08 月 01 日至 99 年 10 月 31 日 執 行 單 位 : 國立交通大學財務金融研究所 計 畫 主 持 人 : 李漢星 計畫參與人員: 博士班研究生-兼任助理人員:王志瑋 報 告 附 件 : 國外研究心得報告 處 理 方 式 : 本計畫可公開查詢中 華 民 國 100 年 02 月 01 日
行政院國家科學委員會補助專題研究計畫
■
成 果 報 告
□期中進度報告
交易對手風險,信用傳染與財務危機預測
計畫類別:■ 個別型計畫 □ 整合型計畫
計畫編號:NSC 98-2410-H-009-015-
執行期間:2009 年 08 月 01 日至 2010 年 10 月 31 日
計畫主持人: 李漢星
共同主持人:
計畫參與人員:王志瑋
成果報告類型(依經費核定清單規定繳交):■精簡報告 □完整報告
本成果報告包括以下應繳交之附件:
■赴國外出差或研習心得報告一份
□赴大陸地區出差或研習心得報告一份
□出席國際學術會議心得報告及發表之論文各一份
□國際合作研究計畫國外研究報告書一份
處理方式:除產學合作研究計畫、提升產業技術及人才培育研究計畫、
列管計畫及下列情形者外,得立即公開查詢
□涉及專利或其他智慧財產權,□一年□二年後可公開查詢
執行單位: 國立交通大學財務金融研究所
1. Introduction
In recently years, the credit derivative instruments such as Credit Default Swap (CDS) and Collateralized Debt Obligation (CDO) have experienced exponential growth in the global financial market. The global credit crunch resulted from the subprime mortgage crisis of 2007 has significantly impacted the financial systems around the world, and raises the importance of portfolio credit risk modeling. Portfolio credit risk models rely heavily on default correlation. Unexplained default clustering is a major issue for traditional credit risk models and could lead to more bank failures in periods of stress, or losses on CDOs that exceed the worst estimates. In fact, CDOs backed by subprime debt have been the major players in the recently ongoing global financial crisis. Therefore, researchers are intended to model the default correlation more realistically and to improve the portfolio credit risk modeling. Prior researches have been examining several possible structural explanations for default clustering, also called “credit contagion.” Nonetheless, current factor or industry effects in credit risk modeling seem to be unable to reproduce the actual pattern of default clustering. Therefore, our study aims at one particular different channel of credit contagion, which is counterparty credit risk.
The crucial problem for measuring portfolio risk is the estimation of default correlation, which is of great importance of the profits and losses in portfolio problems with a large number of assets. Estimation of default correlations is difficult because, unlike stock return correlations, they cannot be directly measured for specific obligors. Portfolio credit risk models typically employ factor models (see Crouhy, Galai, and Mark (2000) and Saunders and Allen (2002) for the comprehensive analysis of these models), in which default correlations are driven by common factors describing the state of the economy. However, these models seem to do not fully capture default correlations given the observed events of default clustering (Das et al. 2007). One of the extensions is to
consider industry factors, which reflects the shock common to companies in a particular industry. Lang and Stulz (1992) and Jorion and Zhang (2007) report strong contagion effects for Chapter 11 bankruptcies and competition effects for Chapter 7 bankruptcies.
Yet another possible channel of credit contagion is counterparty risk, which reflects the default of one firm might affect its creditors. This channel is very different from the factor or industry effects in that it requires detailed information about counterparty exposure. Counterparty risk has been modeled in theoretical studies by, for example, Jarrow and Yu (2001). The empirical studies on counterparty risk channels are rare due to the availability of data and the difficulties in identifying direct business links between companies. The empirical study by Jorion and Zhang (2009) provide first empirical results of credit contagion via direct counterparty effects. They indicate that, on average, creditors experience severe negative abnormal equity returns and increases in CDS spreads. In addition, creditors are more likely to suffer from financial distress later. These effects are stronger for industrial creditors than financials. This suggests that counterparty risk is an important additional channel of credit contagion and that current portfolio credit risk models understate the likelihood of large losses.
In this paper, we follow the pioneered work by Jorion and Zhang (2009) and focus on the relationship between counterparty risk and the subsequent default events. Jorion and Zhang (2009) indicate that creditors in financial industry suffered less than those in non-financial industries from the counterparty default. However, unlike Jorion and Zhang (2009), we could not find evidence of negative abnormal returns for the top unsecured creditors in Chapter 11 bankruptcy events. The difference may come from the manual sample matching procedure of unsecured creditors from www.bankruptcydata.com to CRSP dataset.
credit contagion and counterparty risk. Section 3 presents our data and empirical results. The conclusions are drawn in Section 4.
2. Literature Review
In this section, we review theoretical and empirical studies of default correlation, credit contagion, and counterparty risk.
2.1 Empirical Studies of Default correlation, Credit contagion, and Counterparty Risk
In the empirical studies of credit contagion, Das et al. (2007) test the doubly stochastic assumption under which firms’ default times are correlated only as implied by the correlation of factors determining their default intensity. The estimates of default intensity are of the form linked to the distance of default of the firm, the trailing 1-year stock return of the firm, as well as the U.S. 3-month T-bill rate and the trailing 1-year return of the S&P 500 stock index. They find that doubly stochastic property do not fully capture the clustering in default correlations, and defaults cluster in time because firm’s default intensity process are correlated, even after conditioning on these intensities, from the contagion or frailty.
Jorion and Zhang (2007) extend the work of Lang and Stultz (1992) by examining the intra-industry information transfer effect of credit events captured in the CDS and stock markets. Positive correlation across CDS spreads indicate the contagion effects dominate, while negative correlations imply competition effects. They find strong evidence of contagion effects for Chapter 11 bankruptcies and competition effects for Chapter 7 bankruptcies. In addition, they also introduce a purely unanticipated event by a large jump in a company’s CDS spread. They find that the unanticipated event leads to the strongest evidence of credit contagion across the industries.
Jorion and Zhang (2009) provide the first empirical analysis of credit contagion via direct counterparty effects. They examine the wealth effects of bankruptcy announcement on creditors using the data from www.bankrupctydata.com, which consists of top unsecured creditors, credit amounts, and credit types for Chapter 11 filings over the period of 1999 to 2005. This unique dataset enables them to use direct and identifiable business ties to assess counterparty risk. They find that, on average, creditors experience severe negative abnormal equity returns and increases in CDS spreads. In other words, a borrower’s default causes financial distress for its creditors. More specifically, in their cross-sectional analysis, market losses due to counterparty risk are significantly negatively related to the expense ratio (the credit amount divided by market value of equity of the creditor), industry recovery rate, the correlation of equity returns between the creditor and the bankrupt firm for 252 days preceding the event, and annual equity return volatility for 252 days preceding the event. On the other hand, the cumulated abnormal CDS spread are positively and significantly related to the four variables mentioned above. Furthermore, they also find that creditors are more likely to suffer from financial distress later. Finally, they perform simulations of portfolio distribution with counterparty risk to demonstrate that counterparty risk can potentially explain the observed excess clustering of defaults. Therefore, they suggest that counterparty risk is an important additional channel of credit contagion and the current portfolio credit risk models, without incorporating counterparty risk, understate the likelihood of large losses.
2.2 Bankruptcy Prediction
Brockman and Turtle (2003) investigated the bankruptcy prediction performance under down-and-out call (DOC) framework using a large-cross section of industry firms from 1989 to 1998. Their empirical evidence shows that the failure probabilities implied
by the DOC framework never underperform the well known accounting approach – Altman’s Z-score. In detail, the logistic regressions by including single or both of the implied failure probability and Z-score, the DOC approach dominants Z-score in predicting the corporate failure percentage of the one, three, five year tests as well as their size or book-to-market categorized tests. In addition, in the quintile-based test, the failure probability of DOC framework also stratify failure risks across firms and years much more effectively than the corresponding Z-score. We should note that another empirical finding by Brockman and Turtle (2003) is that implied default barriers are statistically significant for a large cross-section of industrial firms. However, Wong and Choi (2006) argue that it is the proxy approach of Brockman and Turtle (2003) that leads to barrier levels above the value of corporate liabilities. Hence, they adopt the transformed-data MLE approach and find that default barriers are positive but not very significant in the empirical study of a large sample of industry firms during 1993 to 2002.
Bharath and Shumway (2008) examine the default predictive ability of the KMV-Merton default probability of all the non-financial firms for the period 1980 to 2003. The method they use to estimate the KMV expected default frequency (EDF) is the same iterated procedure employed by Vassalou and Xing (2004). They compare the KMV-Merton default probability with several variables — the naïve probability estimate (without implementing the iterated procedure), market equity, and past returns, and find that the KMV-Merton model does not produce sufficient statistics for the probability of default. Implied default probabilities form the CDSs and corporate bond yield spreads are only weakly correlated with the KMV-Merton default probabilities after adjusting for agency ratings, bond characteristics, and their alternative predictor. Moreover, they find that the naïve probability they propose, which captures both the functional form and the same basic inputs of the KMV-Merton default probability, performs slightly better as a
predictor in hazard models and in out of sample forecasts. They conclude that the KMV-Merton probability is a marginally useful default forecaster, but it is not a sufficient statistic for default. Campbell, Hilscher, and Szilagyi (2004) also show similar results that failure risk cannot be adequately summarized by a measure of distance to default by the KMV-Merton model
Some empirical studies use structural credit risk models to predict defaults. Chen, Hu, and Pan (2006) use the volatility restriction method to test five structural models including the models of Merton, Brockman and Turtle, Black-Cox, Geske (2 periods), and Longstaff-Schwartz as well as the proposed non-parametric model. The default companies in the study are those filing Chapter 11 from January 1985 to December 2002 with assets greater that $50 million. Their results indicate that the distribution characteristics of equity returns and endogenous recovery are two important assumptions. On the other hand, random interest rates that play an important role in pricing credit derivatives are not an important assumption in predicting default. Later on, Chen, Lee, and Lee (2008) compare four structural credit risk models – the Merton (1974), the Brockman and Turtle (2003), the Black and Cox (1976), and the Leland (1994) models – for their default prediction capabilities. They use the MLE estimation approach and empirically investigate the default prediction capability of firms over the period of 1986 to 2005. Their empirical results indicate that exogenous default barriers, flat or exponential, are not crucial in default prediction. In contrast, modeling endogenous barrier has significant improvement in long term prediction for non-financial firms.
More recently, Duffie, Saita, and Wang (2007) provide maximum likelihood estimators of term structures of conditional probabilities of corporate default, incorporating the dynamics of firm-specific and macroeconomic covariates. They find that, for U.S. industrial firms, the term structure of conditional future default probabilities
depends on a firm’s distance to default (a volatility-adjusted measure of leverage), on the firm’s trailing stock return, on trailing S&P 500 returns, and on U.S. interest rates. The out-of-sample predictive performance of the model is an improvement over that of other available models. They also show that their model substantially improves out-of-sample predictive performance over prior models by the average accuracy ratio for one-year-ahead test during 1993-2003.
3. Empirical Results
3.1 Data
In our empirical study, we examine the market reaction of the top unsecured creditors in bankruptcy filings. We follow the approach by Jorion and Zhang (2009) to identify bankrupt events from www.bankruptcydata.com and to retrieve the detailed information of top twenty unsecured claimholders, including creditor names, credit types, and credit amounts. The direct business counterparty exposures enable us to examine the counterparty risk and the following distress of unsecured creditors. All claims by individuals, local, state, federal governments, and other non-profit organizations are excluded. To avoid the potential contamination issue, we follow Jorion and Zhang’s (2009) approach to check the [−5, +5] event window around the bankruptcy filing in the ABI/Inform database to ensure that creditors have no other informative corporate news. In addition to the bankruptcy related data, the equity prices are collected from CRSP and the financial statement information is retrieved from Compustat. The sampling period of the firms is from January 1999 to December 2008, while the quarterly accounting information is from 1997 to 2008 since some firms under financial distress stop filing financial reports a long time before they are delisted from the stock exchanges.
Jorion and Zhang (2009), we construct a creditor portfolio as an equally-weighted portfolio of firms for each event. We then apply the standard event study method (MacKinlay 1997). First, we calculate abnormal returns for firm j at time t using the market model methodology, with parameters estimated over a window ranging from 252 days before the event date to 50 days before the event date. Next, these abnormal returns are averaged across bankruptcy events for creditor portfolios. To isolate the direct counterparty effect specific to the creditor from the contagion or cascading effect spreading to the rest of the industry, the market model is estimated for each firm relative to two portfolios. The first is the market index, CRSP’s value-weighted index for NYSE/AMEX/Nasdaq stocks. The second is a portfolio of firms in the same industry as the creditor, which is constructed as a portfolio of value-weighed industry equity returns for all firms with the same three-digit SIC code. Finally, cumulative abnormal returns (CAR) are computed for analyzing period, and t-statistics are computed from the portfolio time-series standard deviation to account for any possible event clustering.
3.2 Empirical Results
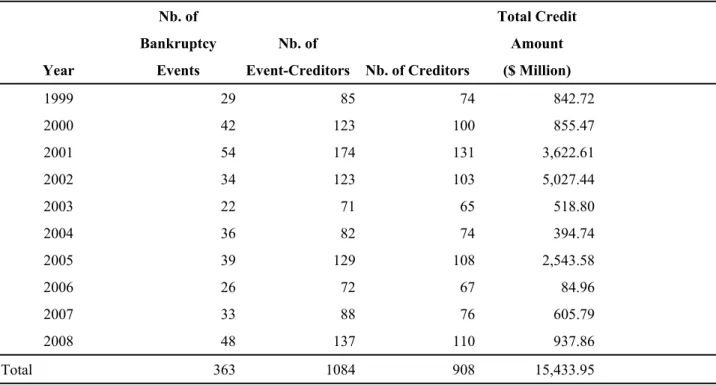
In Table 1, we present the distribution of final sample of Chapter 11 filings used with equity returns. Our samples are from January 1999 to December 2008, including 363 events with complete unsecured creditor information from www.bankruptcydata.com as well as data on CRSP and Compustat. In Panel A, we report by year the number of bankruptcy events, the number of event-creditor samples, the number of creditors and total credit claims. Panel B reports summary statistics for the number of creditors associated with a bankruptcy event. It is apparent that there are more Chapter 11 filings in dotcom bubble and the global financial crisis in 2008. However, we should note that the distribution of our final samples is not very close to that documented by Jorion and Zhang
(2009). The difference may come from manual sample matching procedure from www.bankruptcydata.com to CRSP data.
Table 1 Distribution of Bankruptcy Events in Sample
Panel A: Distribution Year Nb. of Bankruptcy Events Nb. of Event-Creditors Nb. of Creditors Total Credit Amount ($ Million) 1999 29 85 74 842.72 2000 42 123 100 855.47 2001 54 174 131 3,622.61 2002 34 123 103 5,027.44 2003 22 71 65 518.80 2004 36 82 74 394.74 2005 39 129 108 2,543.58 2006 26 72 67 84.96 2007 33 88 76 605.79 2008 48 137 110 937.86 Total 363 1084 908 15,433.95
Panel B: Number of Creditors within a Creditor Portfolio
Nb. Of Events Mean Std Dev Median Max Min
363 2.99 2.39 17 2 1
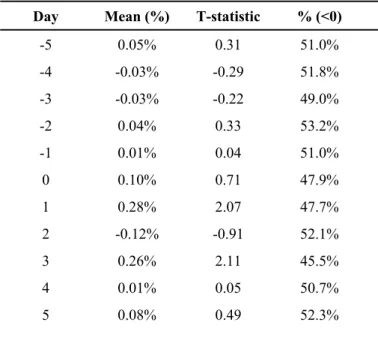
Table 2 reports abnormal equity returns (AR) for major unsecured creditors of the firms filing for Chapter 11 over our sampling period. The return of creditor portfolio is computed in two steps as Jorion and Zhang (2009). First, we construct a portfolio of equally-weighted equity returns for each bankruptcy event. Second, we average these returns across events. AR is the industry-adjusted abnormal returns of the creditor, defined from an industry market model estimated over the period (-252,-21). The industry index is constructed from a portfolio of value-weighted industry equity returns for all
firms having the same three-digit SIC code as the unsecured creditor. We also present the percentage of samples with negative abnormal returns on the given day.
Table 2. Contagion Effect of Chapter 11 Bankruptcy on Creditors Stock Prices
Panel A: Abnormal Equity Returns, Entire Sample (N=363)
Day Mean (%) T-statistic % (<0)
-5 0.05% 0.31 51.0% -4 -0.03% -0.29 51.8% -3 -0.03% -0.22 49.0% -2 0.04% 0.33 53.2% -1 0.01% 0.04 51.0% 0 0.10% 0.71 47.9% 1 0.28% 2.07 47.7% 2 -0.12% -0.91 52.1% 3 0.26% 2.11 45.5% 4 0.01% 0.05 50.7% 5 0.08% 0.49 52.3%
Panel B: Abnormal Equity Returns by Type of Creditors
Industrial Firms (N=316) Financial Firms (N=124)
Day Mean (%) T-statistic % (<0) Day Mean (%) T-statistic % (<0)
-5 0.08% 0.41 53.2% -5 0.00070 0.47 50.0% -4 -0.06% -0.48 52.8% -4 0.00030 0.17 44.4% -3 0.01% 0.08 50.6% -3 -0.00023 -0.11 45.2% -2 -0.05% -0.38 54.4% -2 0.00262 1.31 50.0% -1 -0.04% -0.28 50.6% -1 0.00022 0.14 54.0% 0 0.12% 0.76 47.2% 0 -0.00027 -0.15 50.8% 1 0.31% 1.94 47.8% 1 0.00081 0.50 53.2% 2 -0.15% -1.01 51.3% 2 0.00205 1.04 48.4% 3 0.33% 2.22 44.0% 3 -0.00048 -0.25 46.8% 4 -0.02% -0.16 48.7% 4 -0.00037 -0.18 56.5% 5 -0.02% -0.13 52.5% 5 0.00223 0.89 43.5%
In contrast to the results of Jorion and Zhang (2009), we could not find significantly negative abnormal returns of unsecured creditors around the Chapter 11 filing period. The results hold not only for entire sample, but also in subsamples tests for industrial firms and financial firms. As in Table 1, we believe one of the possible reasons for the difference may from manual sample matching procedure from www.bankruptcydata.com to CRSP data. Furthermore, prior empirical study, for example Hertzel et al. (2008), also indicated that distress may be widely known well in advance of the actual bankruptcy petition.1 Therefore, the negative AR for the unsecured creditors may occur before the actual filing date of Chapter 11.
4. Conclusion
Counterparty risk is rarely empirically investigated in finance literature. In this paper, we have conducted a comprehensive literature review of theoretical and empirical studies in default correlation, credit contagion, and counterparty risk. Following Jorion and Zhang (2009), we attempt to investigate the market reaction of the top unsecured creditors in Chapter 11 bankruptcy filings. However, unlike Jorion and Zhang (2009), we could not find support for the existence of negative abnormal return for the top unsecured creditors in Chapter 11 bankruptcy events. The difference may result from the manual sample matching procedure of unsecured creditors from www.bankruptcydata.com to CRSP
1 Therefore, in the study of Hertzel et al. (2008), they instead investigate the effects of a pre-bankruptcy distress
date rather than the filing of a bankruptcy petition. In addition to the reason that distress may be widely known well in advance of the actual bankruptcy petition, they claim that the pre-bankruptcy distress catalysts are themselves of likely consequence to rivals, suppliers, and customers. To identify pre-bankruptcy distress, Hertzel et al. (2008) search the CRSP tapes over the calendar year prior to (and including) the Chapter 11 filing date and find the day on which the distressed firm has the most negative dollar abnormal return. This day represents the day on which the eventually-bankrupt firm experiences the largest loss of shareholder wealth, and is referred to as the distress date. Hence, in their paper, instead of actual Chapter 11 filing date, they measure abnormal returns over the distress period, which is defined as the three-trading-day period centered on the distress date.
dataset. Yet another possible reason is that the negative abnormal returns for the unsecured creditors may occur before the actual filing date of Chapter 11 when the distress of filing firm are known by the market Hertzel et al. (2008). In the future, we seek to re-probe this issue by other more reliable data source and reconfirm our results in this study. In addition, we hope to investigate the relationship between the changes in default probabilities implied by the structural models and the subsequent events of financial distress of creditors, and construct a direct linkage between counterparty risk and financial distress.
Reference
Bharath, S. T., and T. Shumway, 2008, “Forecasting Default with the Merton Distance to Default Model,” Review of Financial Studies, 21, 1339-1369.
Black, F. and J. C. Cox, 1976, “Valuing Corporate Securities: Some Effects of Bond Indenture Provisions,” Journal of Finance 31, 351-367.
Brockman, P. and H. J. Turtle, 2003, “A Barrier Option Framework for Corporate Security Valuation,” Journal of Financial Economics 67, 511-529.
Campbell, J. Y., J. Hilscher, and J. Szilagyi, 2004, “In Search of Distress Risk,” Working Paper, Harvard University.
Chen R., C. Lee, and H. Lee, 2008, “Default Prediction of Alternative Structural Credit Risk Models and Implications of Default Barriers,” Working paper of Rutgers University and Nation ChaioTung University.
Chen, R., S. Hu., and G. Pan, 2006, “Default Prediction of Various Structural Models,” Working Paper, Rutgers University, National Taiwan University, and National Ping-Tung University of Sciences and Technologies.
Crouhy, M., D. Galai, and R. Mark, 2000, “A Comparative analysis of current credit risk models,” Journal of Banking and Finance 24, January, 57-117.
Das, S., D. Duffie, N. Kapadia, and L. Saita, 2007, “Common failings: How corporate defaults are correlated,” Journal of Finance 62 (1), 93-117.
Duan, J. C., 1994, “Maximum Likelihood Estimation Using Pricing Data of the Derivative Contract,” Mathematical Finance 4, 155-167.
Duan, J. C., 2000, “Correction: Maximum Likelihood Estimation Using Pricing Data of the Derivative Contract,” Mathematical Finance 10, 461-462.
Duan, J. C., G. Gauthier, and J. G. Simonato, 2004, ”On the Equivalence of the KMV and Maximum Likelihood Methods for Structural Credit Risk Models,” Working Paper, University of Toronto.
Hertzel, M. G., Z. Li, M. S. Officer, and K. J. Rodgers, 2008, Inter-firm linkages and the wealth effects of financial distress along the supply chain, Journal of Financial Economics 87, 374-387.
Jarrow, R. and F. Yu, 2001, “Counterparty Risk and the Pricing of Defaultable Securities,” Journal of Finance 56, 1765-1800.
Jorion, P. and G. Zhang, 2007, “Good and Bad Credit Contagion: Evidence from Credit Default Swaps,” Journal of Financial Economics 84, 860-883.
Jorion, P., and G. Y. Zhang, 2009, “Credit contagion from counterparty risk,“ Journal of Finance 64, 2053-2087.
Lang, L. and R. Stulz, 1992, “Contagion and Competitive Intra-Industry Effects of Bankruptcy Announcements,” Journal of Financial Economics 8, 45-60.
Leland, H. E., 1994, Corporate debt value, bond covenants, and optimal capital structure, Journal of Finance 49, 1213-1252.
MacKinlay, C., 1997, Event Studies in Economics and Finance, Journal of Economic Literature 35 (1), 13-39.
Merton, R. C., 1974, “On the Pricing of Corporate Debt: the Risk Structure of Interest Rates,” Journal of Finance 28, 449-470.
Saunders, A., and L., Allen, 2002, Credit Risk Measurement, New York: John Wiely & Sons, Inc.
Vassalou, M. and Y. Xing, 2004, “Default Risk in Equity Returns,” Journal of Finance 59, 831-868.
Wong H. Y. and T. W. Choi, 2006, “Estimating Default Barriers from Market Information,” Working Paper, The Chinese Hong Kong University and Citic Kawah Bank.
國科會補助專題研究計畫項下赴國外(或大陸地區)出差或研習
心得報告
日期: 2010 年 1 月 30 日
一、國外研究過程與研究成果
抵美後與目前任職於Fordham University 之 Ren-raw Chen 教授進行數次研究討 論:
1. 財務危機預測研究方面,已完成 Non-parametric credit risk model 模型程式與初 步實證結果,目前正進行最新破產公司資訊與近兩年的會計財務資料更新中,將與 Altman (1968)、Merton(1974)、Brockman and Turtle(2003)以及 Bharath and Shumway (2008)所發展之模型進行違約預測實證分析比較,預計於 2010 年 3 月底前可完成初 稿並投稿國際期刊。
2. 信用傳染研究方面,已進行數次相關文獻結果討論與構思新研究計畫,Jorion and Zhang (2007) 與 Jorion and Zhang (2009)以事件分析為主,雖能提供破產事件發 生時對同產業公司以及交易對手信用狀況的短期影響分析,但仍缺乏模型面完善的 解釋。因此,仍應以目前reduced form 模型之概念,測試 default intensity 是否受信 用事件影響較為理想,並可進而應用至違約預測與信用商品定價上。近來Lando and Nielsen (2010)導入了 Hawks process 的概念,並駁斥了之前 Das, Duffie, Kapadia, and Saita (2007)所指出 reduced form 模型無法有效捕捉違約相關性的說法。此研究目前 正進行模型程式的撰寫中,冀望於2010 年 6 月底前有初步實證結果。 3. 選擇權訂價模型方面,透過討論發現業界對於model calibration 與中長期持有 期間損益狀況分析有其需求,需要一個對美式選擇權計算速度較快速之模型。因此 目前正進行CEV 模型程式效率的再改進,進行業界實務模型的建構。 計畫編號 NSC 98-2410-H-009-015- 計畫名稱 交易對手風險,信用傳染與財務危機預測 出國人員 姓名 李漢星 服務機構 及職稱 國立交通大學財務金融研究所 出國時間 99 年 7 月 19 日至 99 年 8 月 18 日 出國地點 美國新澤西州
二、建議
能夠與國外知名學者進行面對面研究討論,對於研究的進展速度有極大助益,遠 較透過email 與電話之溝通清楚明瞭,並容易激發新的想法。若有機會,除至海外 進行短期研究外,也希望能夠邀請海外知名學者至交通大學進行中短期學術訪問交 流,成果應較目前邀請學者給予演講討論方式更為豐碩。
國科會補助專題研究計畫項下赴國外(或大陸地區)出差或研習心得報告
日期: 2010 年 1 月 30 日
一、國外研究過程與研究成果
抵美後與目前任職於 Fordham University 之 Ren-raw Chen 教授進行數次研究討論:
1. 財務危機預測研究方面,已完成 Non-parametric credit risk model 模型程式與初步實證結果, 目前正進行最新破產公司資訊與近兩年的會計財務資料更新中,將與 Altman (1968)、
Merton(1974)、Brockman and Turtle(2003)以及 Bharath and Shumway (2008)所發展之模型進行違約 預測實證分析比較,預計於 2010 年 3 月底前可完成初稿並投稿國際期刊。
2. 信用傳染研究方面,已進行數次相關文獻結果討論與構思新研究計畫,Jorion and Zhang (2007) 與 Jorion and Zhang (2009)以事件分析為主,雖能提供破產事件發生時對同產業公司以及交易對手 信用狀況的短期影響分析,但仍缺乏模型面完善的解釋。因此,仍應以目前 reduced form 模型之概 念,測試 default intensity 是否受信用事件影響較為理想,並可進而應用至違約預測與信用商品定 價上。近來 Lando and Nielsen (2010)導入了 Hawks process 的概念,並駁斥了之前 Das, Duffie, Kapadia, and Saita (2007)所指出 reduced form 模型無法有效捕捉違約相關性的說法。此研究目前正 進行模型程式的撰寫中,冀望於 2010 年 6 月底前有初步實證結果。 3. 選擇權訂價模型方面,透過討論發現業界對於 model calibration 與中長期持有期間損益狀況 分析有其需求,需要一個對美式選擇權計算速度較快速之模型。因此目前正進行 CEV 模型程式效 率的再改進,進行業界實務模型的建構。 二、建議 能夠與國外知名學者進行面對面研究討論,對於研究的進展速度有極大助益,遠較透過 email 與電話之溝通清楚明瞭,並容易激發新的想法。若有機會,除至海外進行短期研究外,也希望能 夠邀請海外知名學者至交通大學進行中短期學術訪問交流,成果應較目前邀請學者給予演講討論 方式更為豐碩。
計畫編號
NSC 98-2410-H-009-015-
計畫名稱
交易對手風險,信用傳染與財務危機預測
出國人員
姓名
李漢星
服務機構
及職稱
國立交通大學財務金融研究所
出國時間
99 年 7 月 19 日至
99 年 8 月 18 日
出國地點
美國新澤西州
附件五國科會補助計畫衍生研發成果推廣資料表
日期:2011/02/01國科會補助計畫
計畫名稱: 交易對手風險,信用傳染與財務危機預測 計畫主持人: 李漢星 計畫編號: 98-2410-H-009-015- 學門領域: 財務無研發成果推廣資料
98 年度專題研究計畫研究成果彙整表
計畫主持人:李漢星 計畫編號: 98-2410-H-009-015-計畫名稱:交易對手風險,信用傳染與財務危機預測 量化 成果項目 實際已達成 數(被接受 或已發表) 預期總達成 數(含實際已 達成數) 本計畫實 際貢獻百 分比 單位 備 註 ( 質 化 說 明:如 數 個 計 畫 共 同 成 果、成 果 列 為 該 期 刊 之 封 面 故 事 ... 等) 期刊論文 0 0 100% 研究報告/技術報告 0 0 100% 研討會論文 0 0 100% 篇 論文著作 專書 0 0 100% 申請中件數 0 0 100% 專利 已獲得件數 0 0 100% 件 件數 0 0 100% 件 技術移轉 權利金 0 0 100% 千元 碩士生 0 0 100% 博士生 1 1 100% 博士後研究員 0 0 100% 國內 參與計畫人力 (本國籍) 專任助理 0 0 100% 人次 期刊論文 0 0 100% 研究報告/技術報告 0 0 100% 研討會論文 0 0 100% 篇 論文著作 專書 0 0 100% 章/本 申請中件數 0 0 100% 專利 已獲得件數 0 0 100% 件 件數 0 0 100% 件 技術移轉 權利金 0 0 100% 千元 碩士生 0 0 100% 博士生 0 0 100% 博士後研究員 0 0 100% 國外 參與計畫人力 (外國籍) 專任助理 0 0 100% 人次其他成果