國
立
交
通
大
學
顯示科技研究所
碩
士
論
文
下一代被動式光纖網路之研究
Studies of Next Generation Passive Optical Network
研 究 生:林彥希
指導教授:鄒志偉教授
林清隆教授
下一代被動式光纖網路之研究
Studies of Next Generation Passive Optical Network
研 究 生:林彥希 Student:Yen-His Lin 指導教授:鄒志偉 教授 Advisor:Chi-Wai Chow 林清隆 教授 Chin-Lon Lin
國立交通大學
顯示科技研究所
碩士論文
A Thesis Submitted to Display InstituteCollege of Electrical Engineering and computer Engineering National Chiao Tung University
in partial Fulfillment of the Requirements for the Degree of Master in Institute of Electro-Optical Engineering
June 2011
Hsinchu, Taiwan Republic of China 中華民國一百零一年六月
i
下一代被動式光纖網路之研究
學生:林彥希 指導教授:鄒志偉 教授 林清隆 教授 國立交通大學顯示科技研究所 碩士班 摘要 第一章,先介紹論文中探討到的光纖通訊系統在現今的相關應用,介 紹被動式光纖網路,射頻光纖傳輸以及乙太網路及。第二章裡我們提出兩 種自我修復的被動式光纖網路系統分別說明其運作原理以及實驗結果,並 計算及可靠度並與其他保護系統做比較。第三章中,我們使用振幅調變來 傳輸高資料速率的用戶信號以及無線射頻訊號,文章中我們說明並解釋系 統能夠提高頻寬使用效率以及如何在眼圖重疊下仍然能夠解調。第四章, 我們以現今乙太網路為基礎架構,比較未來使用 40Gb/s 的被動式光纖網路 的設備及能量消耗,說明在未來 40Gb/s 的傳輸速率下,能量消耗對傳輸速 率的效率是越高的。最後一章則包含了總結以及未來方向。ii
Studies of Next Generation Passive Optical Network
Student:Yen-His Lin Advisor:Prof. Chi-Wai Chow Prof. Chin-Lon Lin
Display Institute
National Chiao Tung University
ABSTRACT
In my thesis, we had studied three issues which are significant for passive optical network (PON). They are protection PON, radio over fiber and the power consumption respectively.
In the chapter two, we propose two self-healing fiber protection PON and show up our scheme and the experiment result. We also calculate the reliability and compare it with other protection system. In the chapter three, we use three Mach-Zehnder modulators to create the optical wire and wireless signal with a high spatial efficiency, explaining the principle of our architecture and how we demodulate the signal with the arranged eye diagram. In chapter four, based on the Ethernet PON, we do the power consumption simulation about the future 40Gb/s PON transmission and calculate the power consumption. The final chapter is my conclusion and the future work.
iii 致謝 感謝鄒志偉教授和葉建宏博士兩位的指導,度過我交大顯示所兩年歲 月。教授建議修課研究以及各種規劃,幫助了我很多在研究上的方向及進 展,而葉博對我們研究生很友善,給了我很大的空間去進行研究,真的非 常感謝兩位的指導。 再來要感謝我的父母家人,給我的支持鼓勵,提供我環境並不時的開 導和建議,在我喪氣的時候加油打氣。還有最大功臣我女朋友,陪我度過 各種忙碌的時期,與我共同分擔煩惱,陪伴我順利完成學業。 最後感謝實驗室的同學,尤其是打字速度超快的宋浚宇和魔人劉昱夆, 指導我在程式的疑難雜症,各方面都受益良多。承蒙你們的照顧碩論才得 以順利完成。還有其他學長和同學的幫助,再一次的感謝你們。
iv
目 錄
摘要 ... i
ABSTRACT ... ii
致謝 ... iii
表 目 錄 ... vi
圖 目 錄 ... vii
Chapter 1: Introduction ...1
1.1 General background information ... 1
1.2 EPON and GPON ... 2
1.3 Long reach PON ... 4
1.4 Radio over fiber ... 5
Chapter 2: Protection passive optical network system ...8
2.1 Study motivation ... 8
2.2 Proposed Protection PON scheme ... 9
2.3 Experiment and system performance ... 11
2.4 Reliability ... 14
2.5 Conclusion ... 15
Chapter 3: Radio over fiber long reach PON ...28
3.1 Study motivation ... 28
3.2 System setup and the principle ... 31
v
3.4 DPSK simulation for ROF system ... 36
3.5 Simulation result of the DPSK ... 37
Chapter 4: 40Gb/s PON power consumption ...49
4.1 Study motivation ... 49
4.2 The structure of the Ethernet network ... 50
4.3 Network model ... 53
4.4 The simulation result and discussion ... 60
Chapter 5: Conclusion ...65
vi
表 目 錄
Table 2.1 Comparison of our proposed scheme with other recently reported schemes.
...26
Table 2.2 Reliability data sheet
...27
vii
圖 目 錄
Figure 1.1 Traditional wireless access network and Radio over Fiber network ... 7 Figure 2.1 Schematic of the proposed C + L bands WDM-PON. ... 17 Figure 2.2 The wavelength assignments for the upstream and downstream signals. ... 17 Figure 2.3 The proposed distributed-controlled protection WDM-PON architecture. ... 18 Figure 2.4 Two fiber faults occur at the distributed fiber and the distributed fiber, and the recovery system signal path... 19 Figure 2.5 Another proposed self-protection WDM-PON architecture ... 20 Figure 2.6 The network protection scheme when the fiber links are broken ... 21 Figure 2.7 Reliability block diagram (RBD) for (a) an unprotected scheme, (b–d) the existing protection schemes in [57–59] ... 22 Figure 2.8 Reliability block diagram (RBD) for (e) [60] (f-g) [20] ... 23 Figure 2.9 Our protection scheme 1 and scheme 2 ... 24 Figure 2.10 The unavailability of our propose two schemes and the other protection schemes ... 25 Table 2.1 Comparison of our proposed scheme with other recently reported schemes. ... 26 Figure 3.1 Experimental setup of the convergent optical wired and wireless access network. Inset: grey box: optical spectra, yellow box: electrical spectra.39 Figure 3.2 Principle of orthogonal WDM for baseband and ROF signals. ... 39
viii
Figure 3.3 BER measurements of the (a) baseband NRZ signal for PON applications and (b) baseband-detected ROF and down-converted ROF signal. Insets: corresponding experimental and simulation eye-diagrams. ... 40 Figure 3.4 Experimental optical spectra measured at constructive and destructive output ports of the DI. ... 40 Figure 3.5 Stimulated Q-value against time-delays between the baseband RZ signal and the ROF signal. ... 41 Figure 3.6 Stimulated Q-value of the signals against power differences between the baseband NRZ and the ROF signals at (a) B2B and (b) after 60km SMF. .. 41 Figure 3.7 Stimulated Q-value of the signals with different additional lengths of SMF. ... 42 Figure 3.8 The DPSK baseband and OOK ROF convergent system ... 43 Figure 3.9 The DPSK baseband and DPSK ROF convergent system ... 44 Figure 3.10 The eye diagrams for (a) OOK ROF-baseband (b) OOK ROF-RF (c)DPSK-baseband ... 45 Figure 3.11 The BER curve versus sensitivity for DPSK and OOK convergent system. ... 46 Figure 3.12 The BER curve versus power difference for DPSK and OOK convergent system. ... 46 Figure 3.13 The eye diagrams for (a) DPSK ROF-baseband (b)DPSK ROF-RF (c) DPSK-baseband. ... 47 Figure 3.14 The BER curve versus power difference for DPSK and DPSK convergent system ... 48
ix
Figure 3.15 The BER curve versus power difference for DPSK and DPSK convergent system ... 48 Figure 4.1 Public internet network including ADSL, PON, FTTN using VDSL, PtP access technology and the metro, core, VDN network ... 62 Figure 4.2 Proposed architecture for 40Gb/s in LR-PON ... 62 Figure 4.3 Power consumption per customer(W) vs. peak access rate(Mb/s) .... 63 Figure 4.4 Energy consumption per bit( J/s) vs. peak access rate(Mb/s) ... 63
1
Chapter 1
Introduction
1.1 General background information
In the recent year, internet and wireless communication have been blossomed over the world bringing the high demand of the bandwidth. However, with the trend of the exponential increasing traffic, millimeter- wave in wireless communication can’t afford the demand while the interference and the transmission bandwidth are not good enough. Moreover, in now a day, the bandwidth of traditional cooper twist pair and subscriber line are no longer enough for data transmission [1]. Fiber has been the definitely solution for this problem. Fiber takes the advantageous of high bandwidth (60T-hz), low loss (0.2dB/km) on interference from the electronic and the magnetic wave (EM wave). Because of these attractive reason, fiber has replaced most of the traditional cooper pair. One of the candidates for the optical fiber communication system is the passive optical network (PON).
PONs generally consist of an OLT (Optical Line Termination), which is connected to ONUs (Optical Network Units), using only fiber cables, optical splitters and other passive components (do not transmit signals using electricity). The OLT is located at a local exchange, and the ONU is located either on the street, in a building, or even in a user's home .If the fiber cable connect directly to the community or the building or the home
2
and we call them fiber to the community(FTTC), fiber to the building(FTTB), fiber to the home (FTTH) [2].
PONs rely on light-wave for data transfer. In a PON, signals are routed over the local link with all signals along that link going to all interim transfer points. Optical splitters rout signals through the network; optical receivers at intermediate points and subscriber terminals tuned for specific wavelengths of light direct signals intended for their groups of subscribers. At the final destination, a specific residence or business can detect its specified signal. PONs are capable of delivering high volumes of upstream and downstream bandwidth which can be changed "on-the-fly" depending on an individual user's needs.
There are two major standard groups: the Institute of Electrical and Electronics Engineers (IEEE) and the Telecommunication Standardization Sector of the International Telecommunication Union (ITU-T) [3]. Both organizations produced separate and incompatible 1 Gigabit and 10 Gigabit standards.
1.2 EPON and GPON
GPONStarting in 1995, the International Telecommunications Union (ITU) did further work, and standardized on two generations of PON. The older ITU-T G.983 standard is based on Asynchronous Transfer Mode (ATM), and has therefore been referred to as APON (ATM PON). Further improvements to the original APON standard – as well as the gradual falling out of favor of ATM as a protocol, led to the full, final version of
3
ITU-T G.983 being referred to more often as broadband PON, or BPON. A typical APON/BPON provides 622 megabits per second (Mb/s) (OC-12) of downstream bandwidth and 155 Mb/s (OC-3) of upstream traffic, although the standard accommodates higher rates. The ITU G.984 (GPON), compared to BPON, in both the total bandwidth and bandwidth efficiency through the use of larger, variable-length packets. Again, the standards permit several choices of bit rate, but the industry has converged on 2.488 gigabits per second (Gb/s) of downstream bandwidth, and 1.244 Gb/s of upstream bandwidth. G.987 defined 10G-PON with 10 Gb/s downstream and 2.5 Gb/s upstream – framing is "G-PON like" and designed to coexist with GPON devices on the same network.
EPON
In 2004, the Ethernet PON (EPON or GEPON) standard 802.3ah was ratified as part of the Ethernet in the first mile project of the IEEE 802.3. EPON uses standard 802.3 Ethernet frames with symmetric 1 Gigabit per second upstream and downstream rates. EPON is applicable for data-centric networks, as well as full-service voice, data and video networks. 10Gbit/s EPON or 10G-EPON supports 10/1 Gb/s. The downstream wavelength plan support simultaneous operation of 10 Gb/s on one wavelength and 1 Gb/s on a separate wavelength for operation of IEEE 802.3av and IEEE 802.3ah on the same PON concurrently. The upstream channel can support simultaneous operation of IEEE 802.3av and 1 Gb/s 802.3ah simultaneously on a single shared (1,310 nm) channel. Generally, we predict that the future PON system will have below feature.
4
(b) High split ratio (c) High data rate
(d)Broad-bandwidth for each user
(e) Colorless optical network unit’s equipment
1.3 Long reach PON
According to the transmission distance, we can category the network into access, metro and the core network which the transmission distance are shorter than 20km, 20 to 100km and over 100km. Although in the passive optical network, the data goes into the passive component splitter and transmits to the user, the transmission distance will be limited in 20km meter (access network). If the transmission is longer than the 20km, it needs the signal amplifier which is active equipment as optical to electric to optical (O-E-O) [4]. The concept of the Long-Reach Optical Access Network (LR-PON) is to replace the optical/electrical/optical conversion that takes place at the local exchange with a continuous optical path that extends from the customer to the core of the network. It has been showed that significant cost savings could be made by reducing the electronic equipment and real-estate required at the local exchange or wire center. The erbium doped fiber amplifier (EDFA) and the semiconductor optical amplifier (SOA) are used in the long reach PON to amplify the optical signal. In the LR-PON system there are two often used ways to do the multiplex. One way the time multiplexing division (TDM) which allocate the bandwidth to each user orderly in the time domain and the passive power splitter is used as the remote node. The other one is wave
5
multiplexing division (WDM) that multi-waves coexist in the same infrastructure while the ONUs will use the different wavelengths as their signal carriers.
Despite there are lots of advantageous of LR-PON [5], there are also some challenges waiting to be concurred. First, High power loss: High split ratio is one of the feature of the LR-PON which must attenuate the signal heavily, e.g., when the high split ratio is up to 1024, the power attenuation is 10dB. Second, in the WDM system, there is a need of optical tunable laser to be the upstream carrier in each ONU which highly increase the expenditure. Third, because of the long distance of the transmission, the chromatic dispersion of the fiber would be heavily.
1.4 Radio over fiber
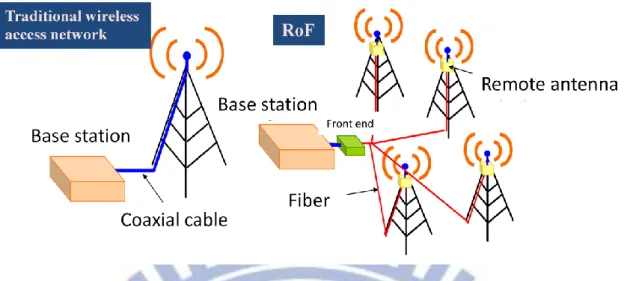
Radio over fiber (ROF) is the optical carrier which is modulated by wireless radio frequency signal and then transmits in the fiber [3]. In this way, we can take the advantageous of the low loss and low cost of the fiber to extend the transmission region of the radio frequency as in Fig. 1.1 . The traditional access network is to connect base station and the antenna through the cooper pair. However, when transmitting the high frequency signal, the severe loss will happen which cause the transmission length usually only under hundred meters. If we use the fiber, we transfer the radio signal into the optical signal through the head end in the base station and transmit to the remote antenna unit (RAU). In this way, we can set the base station and the RAUs in longer distance, moreover, the ROF also can be applied in the certain poor wireless place, e.g. in the tunnel [2].
6
ROF transmission systems are usually classified into two main
categories (RF-over-Fiber ; IF-over-Fiber) [2] depending on the frequency range of the radio signal to be transported.
a) In RF-over-Fiber architecture, a data-carrying RF (Radio Frequency) signal with a high frequency (usually greater than 10 GHz) is imposed on a light-wave signal before being transported over the optical link. Therefore, wireless signals are optically distributed to base stations directly at high frequencies and converted from the optical to electrical domain at the base stations before being amplified and radiated by an antenna. As a result, no frequency up/down conversion is required at the various base stations, thereby resulting in simple and rather cost-effective implementation is enabled at the base stations.
b) In IF-over-Fiber architecture, an IF (Intermediate Frequency) radio signal with a lower frequency (less than 10 GHz) is used for modulating light before being transported over the optical link. Therefore, before radiation through the air, the signal must be up-converted to RF at the base station.
7
Figure 1.1 Traditional wireless access network and Radio over Fiber network
8
Chapter Two
Protection passive optical network system
2.1 Study motivation
With the trend of the high bandwidth demand and exponential increasing internet traffic, the wavelength division multiplexing passive optical network (WDM PON) or the hybrid time division multiplexing (TDM/WDM PON) has been a good candidate for the future data traffic solution while the fiber transmission can provide the extreme high bandwidth and the WDM can support the high split ratio for large number of end user. However, when the distance of the transmission increasing and the number of the user in the access network ascending, there is more possibility that the fault in the feeder and distributed fiber will happen which is difficult and expensive to repair. Recently there are some protection architectures have been proposed [11-16] e.g. reference [6] and [7] need the electrical active component while [8] places the tunable laser in each optical network unit (ONU).
In this chapter, we propose and analyze two protection PON architectures [9] [10] which can support C band and the L band channels in the same time. Passive component 1XN AWG is equipped, and the high reliability is also calculated and compared with other NXN AWG scheme in our work. The feeder fiber and the distributed fiber are both in protection. In section 2.2, we will propose our two protection schemes and explain the principle. In section 2.3, the result of the experiment are performed and
9
evaluated then in next section 2.4, we will calculate the reliability for these two systems and compare with other AWG WDM protection PON. Finally it’s our conclusion.
2.2 Proposed Protection PON scheme
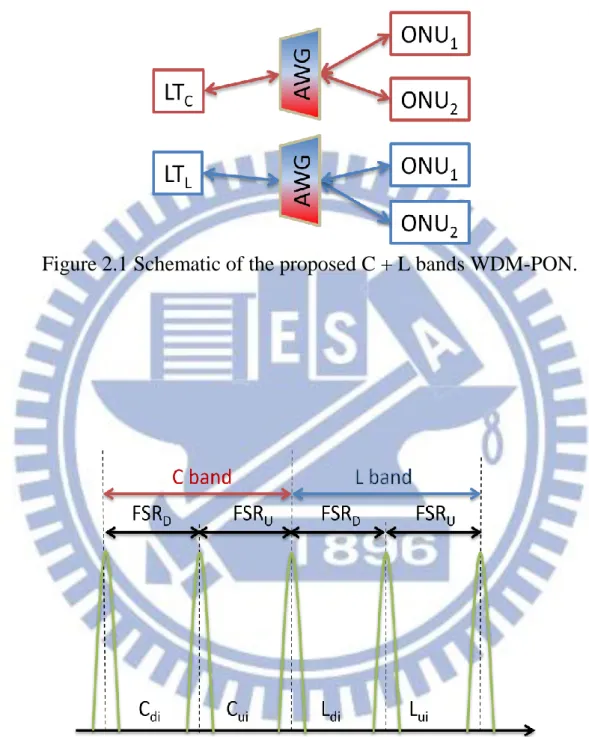
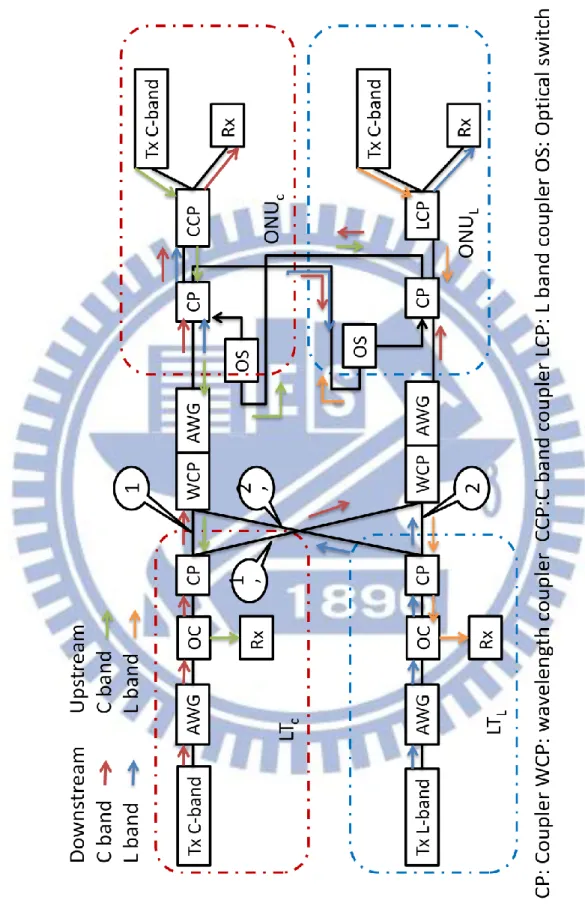
Scheme 1:In the Fig. 2.1, there are two LTs (Line terminals), one is for C band (LTc) and another one is for L band (LTL), respectively. In the standard
WDM PON, the line terminal connects to the AWG which is the remote node and then split into each ONU. In the Fig. 2.3, each LT is equipped with one pair of Rx and Tx. They are combined by the AWG and optical circulator (OC) and then connect to the 2x2 coupler. One working fiber and another backup fiber are connected with the coupler and there is a wavelength coupler and a 1XN AWG before the ONU. The components in the ONU are a optical switch, coupler and c Band coupler and a pair of the C band Tx and Rx. As in the Fig. 2.2, due to the spectral periodicity property of the cyclic AWG, the upstream signal Ui will be assigned to the
same output port of the downstream signal Di if the frequency space between the signal is the multiple of the FSR (Free spectrum region) of AWG.
In the normal working state, the two OSs in each ONU pair are “OFF.” The OS is controlled by medium access control (MAC) layer. The downstream and upstream signal go through the fiber paths 1 and 2 while the signals in fiber paths 1’ and 2’ are blocked by the OS in each ONU. When a fiber fault occurs on the distributed fiber (between the RN and ONU) or the in feeder fiber (between the remote node and the ONU) as
10
shown in Fig. 2.4, the signal can’t pass to the subscriber. Since the Rx of the ONU cannot receive the downstream signal, the OS switched “ON” by the media access control (MAC). Hence the ONUL reconnect both the
downstream signal and upstream signals through the neighbor ONUC
protecting fiber on path 1’, as shown in Fig. 2.4 with N pairs of ONUs. In the CO part, optical circulator (OC) is used to separate the upstream and downstream signals. A 1×2 optical switch (OS) is used to connect the RN with two feeder fiber for working and backup. The RN consists of a 1×2 coupler, a 1×N WDM (AWG) and N 1×2 couplers. Every two adjacent ONUs are assigned to a pair group which is connected to the corresponding output port of the AWG.
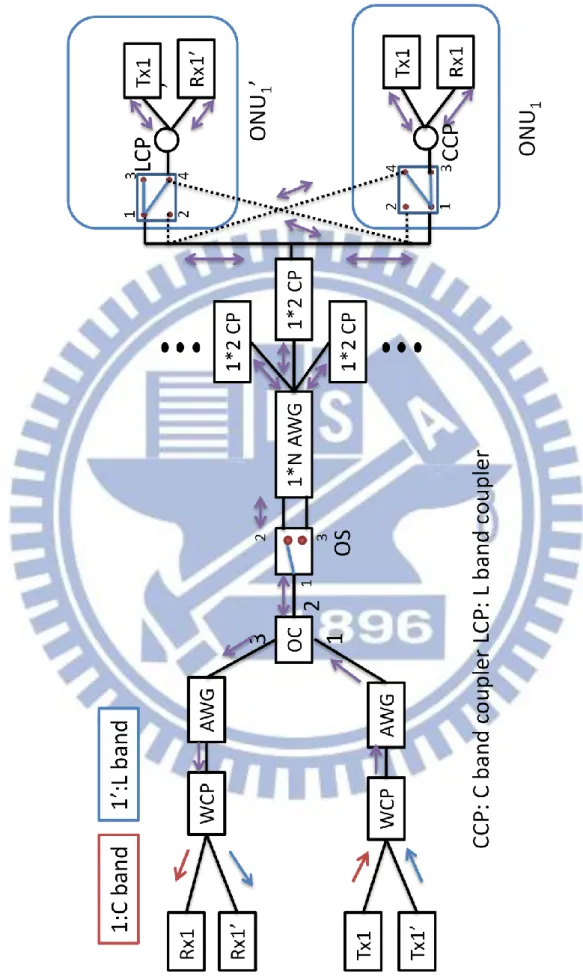
Scheme 2
We utilize the spectral periodic property of the AWG In the same way to transmit the upload and download signal in the same AWG port.
The downstream wavelengths (CDi , LDi) and the upstream wavelengths
( CUi , LUi ) in the ith ONU group (for i=1, 2, …, N) are spaced by one free
spectral range (FSR) of the AWG. Initially, two neighboring downstream signals (CDi , LDi) are coupled by a 1×2 blue/red-band WDM coupler (B/R
CP) into the i-input port of AWG. Downstream signals also can be filtered by the 1×2 red and blue couplers. Here, atailor-made 2×2 optical switch (OS, produced by Lightwave Link, Taiwan) is added for self-protection. The 2×2 OS in the same ONU group is connected to port “2” and “4” by two protecting fiber. A 1×2 re coupler is placed inside ONU1 to filter the downstream CDi and the upstream CUi wavelength channels, and a 1×2 blue
11
wavelengths.
Next, we discuss the two scenarios of fiber fault. In normal operation, the 1×2 OS in the CO connects the ports “1” and “2” for the working path and the ports “1” and “3” for protecting the path. And, for the 2×2 OS in each ONU, the ports “3” and “4” both connect to port “1” in normal status for upstream transmission. When there are two occurrences of fiber faults, one in the feeder fiber and the other in the distribution fiber. Because all the upstream signals cannot be detected in the CO, hence the monitor circuit (MC) in the CO will detect a power drop and the MAC will trigger the OS to switch the ports (1→2) in the protecting fiber path for reconnecting the signal, as shown in Fig. 2.6. The C band signal will go through the 2X2 switch port ” 4 ” in ONU1’ to the ONU1.
2.3 Experiment and system performance
In this section, we will discuss about our architecture and the experiment result. First let have a look at the scheme 1. In our experiment, the wavelengths of CD1, CU1, LD1, and LU1 are 1546.0, 1548.0, 1562.0, and
1564.0 nm and the total length of the feeder and distributed fiber is 20 km. The fiber between the ONU pair is 2 km. All the fiber are standard single mode fiber (SSMF). Both the downstream and up- stream signals are modulated at 10 Gb/s non-return-to-zero(NRZ) format with 231 pseudorandom binary sequence data via a LiNbO3 Mach–Zehnder modulator (MZM). Optical pre amplifier is erbium-doped fiber amplifier (EDFA). In the [9], it shows the BER performances of downstream and upstream signals between the CO and the ONUC1 back-to-back
12
transmission and the 20 km single mode fiber (SMF) transmission and the protection state (22 km SMF transmission). The measured C band signals power penalties are less than 0.5 dB at a BER of 10−9 without and with fault cut and the sensitivity is about -26.5dBm. We also can see in [9], the transmission performance for the L band signals and the power penalties are about 0.8 dB at a BER of 10−9 for L band signals. By considering the insertion losses of the OS(~ 0.5 dB), an AWG (~5 dB), two CPs (~6 dB), a WC( < 1 dB), an OC ( < 0.5 dB), and the 22 km SSMF (0.2 dB/km), the total loss budget is about 18 dB. In practice, the proposed scheme can support 80 WDM wavelengths using both C + L bands (40 wavelengths in the C-band and 40 wavelengths in the L-band). The number of supported wavelengths can be further increased if dense WDM (DWDM) is used. The insets are measured corresponding eye diagrams for downstream and upstream signals with and without protection, respectively.
Now we are talking about the scheme 2 [10]. In order to investigate the transmission performance of our proposed self-protection system [10], we select four wavelengths to simulate the downstream and upstream channels for the CO and a pair of ONU1 and ONU1’. In this experiment, the CD and
LD with wavelengths of 1540.5 nm and 1559.7 nm were served as the
downstream wavelengths for ONU1 and ONU1’, respectively. The CU and
LU with wavelengths of 1541.7 nm and 1560.9 nm were served as the
upstream wavelengths for ONU1 and ONU1’ respectively. Then, we
consider the power budget of the proposed access network: the signal transmits through two OSs (losses of ~0.5 dB and ~3.6 dB respectively), two AWGs (loss of 5 dB), a 1×2 blue/red coupler (loss of 3 dB), two
13
couplers (loss of 3 dB), a circulator (loss of 0.5 dB) and about 27 km single-mode fiber (SMF) (0.2 dB/km at 1550 nm). Thus, the total loss budget is less than 15 dB.
In the experiment, each signal was modulated at 10 Gb/s NRZ, 231−1 pseudo random binary sequence (PRBS) data via a LiNbO3 intensity modulation (IM). And the four signals were transmitted through the 25 km and 27 km single mode fiber (SMF), respectively, for working and protection statuses. The bit error rate (BER) performances of downstream and upstream signals between CO and ONU1; and CO and ONU1’ are
shown in [10]. It also shows the BER curves between CO and ONU1
without and with fault protection. The measured power penalty was less than 0.5 dB at BER of 10−9. Since the wavelengths (close to L-band) located at one side of the EDFA gain profile, the power penalties between CO and ONU1’ are larger than that between CO and ONU1. In addition, we
also measured the restoration time of the proposed WDM-PON system. The restoration time of OS was measured within 7 ms, as shown in the inset [10].
We compare our proposed scheme with other recently reported schemes in the literatures as shown in Table 2.1. The experimental results show that our proposed scheme has a higher power penalty between working and protection states (~0.8 dB), while other schemes in Refs. [7] and [8]. In Ref. [6], there is about 0.5 dB and negligible power penalty, respectively.
Our scheme can protect both feeder and distribution fiber without active control between the CO and ONU. Moreover, other protection schemes [17-19] could only be employed in C-band for WDM operation. For
14
example, 40 wavelength channels can be used in the C-band (1530 to 1560 nm) for WDM transmission while the channel spacing is 100 GHz (0.8 nm). Here, our proposed PON architecture can also support both C to L bands (1530 to 1600 nm) for providing twice the capacity when compared with Refs. [17–19].
2.4 Reliability
According to the reference [20], we can calculate and compare the reliability of connection between CO and ONU in the protection system. Our availability models are illustrated by reliability block diagrams (RBDs) [21] as in [20] and are shown in Fig. 2.7, 2.8 and 2.9. The asymptotic unavailability value [22-23] for each block in the diagrams is for a component or fiber section. For these values, we refer to [22-23] and show them in Table 2.2. In the reference [20], they compare and calculate other protection PON structures [57-60] with RBD. Therefore, we also compare our schemes unavailability to these protection schemes. We transfer the protection system scheme 1 and scheme 2 into the RBD as Fig. 2.9 and using the unavailability value in Table 2.2 to calculate the reliability of the scheme 1 and 2. We do some assumption as follow, the optical coupler, C band optical coupler, wavelength coupler and the splitter are the same unavailability. And the optical circulator which is in the dash block is excluded for our calculation because in [20], the OC has been included in the OLT already. The feeder fiber plus distribution fiber length is 20 km for working path while the fiber length is 2 km for distribution fiber and the interconnection fiber length is 3km for neighbor connection. By the way
15
It has to be mentioned that our reliability calculation is based on each ONU. After our assumption, the scheme “1” unavailability is 1.73e-6 and the scheme “2” is 6.02E-6 in the Fig. 2.10. We comparing to the Ref. [20,57-60] which using the NxN AWG in their protection systems while the lowest unavailability of protection scheme is 2.43E-6 in [20]. From Fig. 2.10, we show that our proposed protection scheme 1 has the best reliability and our scheme 2 still is better than un-protection and Ref. [57-58] scheme. In our analysis, the key point to reduce the unavailability is the protection length in the system. As we can in the Table 2.2, most of the passive components have the similar unavailability near 1E-7 while the optical fiber has the highest unavailability. When the transmission distance up to 25km, the unavailability from fiber will dominate the system reliability and we through the protection path to make the unavailability multiplication instead of add. By doing so, we can decrease the unavailability a lot for the system even we increase our TDM split ratio to 1:64.
Comparing to our scheme to the NxN AWG protection scheme [20], both protection region include feeder fiber and distribution fiber, and the supporting ONU number both are large. In our scheme “1”, it can support both C and L band about 80 channel when the guard band is about 0.8nm which is equal to 100Ghz. Adding the time division multiplexing (TDM) split ratio 1:16, the scheme “1" can support the 1280 ONUS with the low unavailability.
2.5 Conclusion
16
systems which both can support C and L band with the AWG periodic spatial feature. We show up the architecture and the experiment of these two schemes and the error free at received power -26.5dBm. The supporting number of ONU is 80 wavelength channels multiple the TDM ratio 1:16 which is 1280. We also compare about the reliability of our scheme with other protection systems which use NxN AWG. The result is that our schemes have the higher reliability in the same condition.
17
Figure 2.1 Schematic of the proposed C + L bands WDM-PON.
Figure 2.2 The wavelength assignments for the upstream and downstream signals.
18
Figure 2.3 The proposed distributed-controlled protection WDM-PON architecture.
19
Figure 2.3 Two fiber faults occur at the distributed fiber and the distributed fiber, and the recovery system signal path.
20
21
22
Figure 2.7 Reliability block diagram (RBD) for (a) an unprotected scheme, (b–d) the existing protection schemes in [57–59]
23
Figure 2.8 Reliability block diagram (RBD) for (e) [60] (f-g) [20]
24
Figure 2.9 Our protection scheme 1 and scheme 2
25
Figure 2.10 The unavailability of our propose two schemes and the other
protection schemes 1.00E-06 1.00E-05 1.00E-04
Unavailibility
Other paper Our scheme26
Table 2.1 Comparison of our proposed scheme with other recently reported schemes.
27
28
Chapter Three
Radio over fiber long reach PON
3.1 Study motivation
Future access networks need to provide broadband services with wired and wireless approaches. The convergent optical wired and wireless access network has been proposed to provide broadband services in a single and integrated perform. Passive optical network (PON) is promising for providing wired services, while radio-over-fiber (ROF) is an important technique for providing wireless services in the optical domain. The simultaneous generation and transmission of both signals for PON and ROF for the convergent optical wired and wireless has been proposed and demonstrated [24–33]. The scheme reported in [31] only needs a single electro-absorption modulator (EAM) to produce baseband and ROF signal simultaneously. However, the signal performance is limited by the nonlinearity, chirp of the EAM. Techniques used in the integrated ROF and access networks reported in [29] and [32] either require optical modulator at the remote node (RN) or multiple laser sources which will complicate the system. System reported in [33] requires electrical up-conversion at each base station, which is costly and complicated. Techniques used in [24] and [30] can provide simple generation and demodulation of the baseband and ROF signal, however, the frequency separation between the two bands signal should be larger than the bandwidth of the signal to avoid cross-talk.
29
Our proposed convergent optical wired and wireless scheme is spectral efficient, in which the channel spacing equals the bit-rate per subcarrier. It does not require multiple laser sources, or electrical up-conversion at the RN or at the base station. Recently, using orthogonal multi-carrier modulations provide cost-effective and high spectral-efficient optical communication. These modulations include orthogonal frequency division multiplexing (OFDM) [34], coherent wavelength division multiplexing (WDM) [35] and orthogonal WDM [36]. And orthogonal WDM is promising since its operation speed does not limited by the electronic bottleneck caused by the digital signal processing (DSP).
Besides, long-reach (LR) access can integrate the metro access for simplifying the network architecture [37]. In this work, we propose and demonstrate a convergent optical wired and wireless LR access networks based on orthogonal WDM. High signal spectral efficiency can be obtained. Although spectral efficiency is not the top priority issue for the present access networks, it is not true for the case of WDM LR access (since it integrates the present metro and access sections [37-38]). As the optical amplifier has a fixed and limited bandwidth of about 30 nm. Increasing the spectral efficiency of the WDM LR access is essential. Here 5 Gb/s baseband non-return-to-zero (NRZ) signal and 10 GHz double sideband ROF signal (carrying 5Gb/s data) are orthogonally wavelength-division-multiplexed. They occupy a bandwidth of 20 GHz. Error-free de-multiplexing and down-conversion can be achieved after 60 km (long-reach) of single-mode fiber (SMF) transmission without dispersion compensation. Time-delays and power differences between the
30
baseband NRZ and the ROF signals in the transmitter (Tx) are characterized. The scalability of the system for higher bit-rate (60 GHz) is also discussed. In the section 3.2, we illustrate the experiment and the simulation about our ROF system. Unless the OOK modulation, we also apply differential phase shift keying (DPSK) modulation format to our proposed system without adding optical equipment in section 3.4.
We briefly introduce about the DPSK modulation. First we can start from the binary phase shift keying (BPSK). BPSK modulation is to modulate the optical carrier phase with the alter binary signal, e.g. the carrier phase will be modulated in 180 degrees if sequence is ‘0’; while 0 degrees when the sequence is ‘1’. DPSK is doing the difference encode before the modulation. For a example, there is a original sequence bk, after
encoding, the sequence bk become dk. Then, we use the differential encoded
sequence dk to do the binary phase modulation. If the dk equals ‘1’, the
optical phase is 0 degrees; while the dk equals ‘0’, the optical phase is 180
degrees. The relation between the bk and the optical carrier is that when bk
equals ‘1’ the carrier
(1) ; when the bk equals ‘0’ the carrier phase
(2) According to the relation mentioned before, then we get the equation present this encoding.
(3) . The exclusive nor (XNOR) of bk and dk-1 is the dk.
31
If we use the phase modulation in our system, we can’t avoid the coherence detection which needs the optical phase lock loop (OPLL) [39] to lock the optical carrier. And it is very difficult to manufacture the OPLL moreover there is the loop delay. The advantageous of the DPSK is that we can use the delay-line in optical communication system to modulate the BPSK system which has the coherence optical carrier. Comparing to the OPLL, delay-line is much easier and reliable to be utilized in the system. In this way we can avoid the OPLL to implement the coherence detection in phase modulation. In section 3.4, the setups of ROF systems which use the DPSK are explained. In section 3.5 the measurement result for BER and the eye diagram are shown in this section and the power difference which influents the signals performance is also tested.
3.2 System setup and the principle
Fig. 3.1 shows the experimental setup of the wired and wireless access network. A continuous wave (CW) signal at wavelength of 1550.97 nm was divided into two paths by a 3-dB coupler. A Mach-Zehnder modulator MZM1 at the upper path was used to produce a 5 Gb/s, pseudorandom
binary sequence (PRBS) 231-1 baseband NRZ signal for optical wired application. In the lower path, two coherent optical tones of 10 GHz apart were first generated by the MZM2, which was dc-based at the transmission
null and was electrically driven by a 5 GHz clock. The optical two tones were then launched into MZM3 to produce the double sideband carrier
suppressed ROF signal (10 GHz sinusoidal signal carrying 5 Gb/s NRZ signal).
32
Time and power differences between the baseband NRZ signal and the ROF signal were adjusted by using electrical delay-line and variable optical attenuator (VOA) respectively. They will be discussed in next section . An erbium-doped fiber amplifier (EDFA) was used in the remote node (RN) to provide an output saturation power of 23 dB. Optical amplifiers are usually included in LR-PON [36-37]. Here, the EDFA was used to compensate the power loss of the 60 km SMF and the 1:32 fiber splitter. Then a passive optical delay interferometer (DI) of 100 picoseconds was used as an optical filter and optical de-multiplexer to de-multiplex the baseband and the ROF signal. The 100 picoseconds DI provides the free spectral range (FSR) of 10 GHz; hence allowing the ROF signal to pass through at one of the output port (f0 ± 5 GHz), and allowing the baseband NRZ signal to pass
through at the other output port (f0) as shown in Fig. 3.1. At the receiver
(Rx), the baseband signal was directly detected by a photodiode (PD1) (5
GHz bandwidth) for application. Then, the ROF signal was launched into PD2 (20 GHz bandwidth). The self-beating of the NRZ signal will produce
the baseband signal while the coherent beating between the two optical tones (two sidebands) will produce the radio-frequency (RF) signal at 10 GHz frequency band. An electrical diplexer was used to separate the baseband-detected ROF baseband signal and the RF signal. The RF signal can then be directly emitted via an antenna. In the measurement, the RF output of the diplexer was directly connected to an RF mixer for signal down-conversion. Bit-error rate (BER) measurements were performed by simulations with VPI Transmission Maker V7.5.
33
In the conventional WDM, if the channel separation is not large enough, crosstalk produced by adjacent channels will highly degrade the target channel. Fig. 3.2 shows the schematic optical spectra and simulated eye-diagrams (using VPI) for illustrating the operation principle of the proposed scheme. In our proposed scheme, high spectral-efficiency (channel spacing is equal to the bit-rate) can be achieved by using proper time-delay.
Considering the target wavelength channel at f0 (Fig. 3.2(a)) after
passing through an optical filter (filter pass-band: dotted line), residual crosstalk from the high frequency components of the two adjacent channels will also be inside the pass-band of the optical filter, as shown in Fig. 3.2(b) and 3.2(c). The corresponding eye-diagrams are return-to-zero (RZ) liked due to the transient components of the signal in time-domain. By proper time-adjusting these transients to the eye-crossing of the target channel, clear eye-opening can be achieved.
3.3 Experiment result and discussion
Fig. 3.3(a) shows the BER measurements of the 5 Gb/s baseband NRZ signal for PON applications. The corresponding experimental (upper graph) and simulation eye-diagrams (lower graph) are also included in the insets. About 1 dB power penalty was observed after the long-reach 60 km SMF transmission. Fig. 3.3(b) shows the BER measurements of the baseband-detected ROF and the down-converted ROF signal for wireless applications. About 2 dB power penalty was observed after the fiber transmission. It is observed that there is a good match between the
34
experimental and simulation eye-diagrams. It is also observed that even there is a large spectral overlap between the baseband wired signal and the ROF signal (as described in section 3.2 above), by adjusting the proper time-delay, error-free de-multiplexing and signal detection can be achieved after the long-reach transmission. Figure 3.4 shows the experimental optical spectra (using optical spectrum analyzer with resolution of 0.01 nm) measured respectively at the DI constructive and destructive output ports. We can observe that the baseband and the ROF signal can be successfully de-multiplexed by the DI. Fig. 3.5(a) and 3.5(b) show the experimental and simulation RF spectra measured after PD2 and prior the diplexer (point ‘A’
in Fig. 3.1). We can clearly observe the baseband and RF signals in the RF spectrum. The baseband component is generated by the self-beating of the NRZ signal, and the RF signal at 10 GHz frequency band is generated by the coherent beating between the two optical tones (two sidebands). There is a good match between them. Then we analyzed the optimum time-delay and power difference between the baseband NRZ signal and the ROF signal. Figure 3.6 shows the simulated Q-value of the baseband NRZ and ROF signals at different time-delays between them. As discussed in section 3.2, the optimum delay will happen simultaneously for both baseband NRZ and ROF signal. We can observe from Fig. 3.6 that the time-delay tolerance to achieve error-free operation (Q > 15 dB) is quite large, and it is about 35% of a bit period. Hence, less accurate delay line can be used. Fig. 3.6(a) and 3.6(b) shows the simulated Q-value of different signals against the power difference, P (P = power of baseband NRZ - power of ROF) at back-to-back (B2B) and after 60 km SMF transmission. When the power of
35
the baseband NRZ increases (i.e. P increases), its performance will increase; however, it will produce higher crosstalk to the ROF signal. Hence there is a trade-off between them. At B2B, the optimum performance of both baseband NRZ and down-converted ROF signal is at P = 2 dB. Since the ROF has a much broader spectrum than the baseband NRZ signal, it is more influenced by the fiber chromatic dispersion. Hence, after 60 km SMF transmission, the optimum power difference decreases to 0 dB. This implies that the launching power of the baseband NRZ signal should decrease accordingly to maintain the performance of the ROF signal, as shown in Fig. 3.6(b). It is worth to mention that this scheme can be applied for much higher bit-rate. We then discuss the scalability of the system for bit-rate of 30 Gb/s using simulation. And 16.67 ps DI is used in this case. In simulation, 30 Gb/s baseband NRZ signal is orthogonally wavelength division multiplexed with the 60 GHz ROF signal (carrying 30 Gb/s data) at different Power. Signal at 60 GHz band is highly desirable for the future home network since it is license free [38]. The signals were transmitted through 20 km feeder SMF, which is fully dispersion compensated by using dispersion compensating fiber. Different lengths of SMF (dispersion parameter = 17 ps/nm/km) were included to evaluate the dispersion tolerance of the 60 GHz system at different drop fiber lengths. Fig. 3.7 shows the simulated Q-value of the 60 GHz system. We can observe the opposite behavior of the performances of the baseband and down-converted signals when P increases, and this has been explain in last paragraph. And the dispersion tolerance of the 60 GHz is more than 1 km of additional SMF, which could be long enough for the drop fiber.
36
3.4 DPSK simulation for ROF system
As the radio over fiber system mentioned before, we alter the data modulation format from OOK into DPSK, as in Fig. 3.8. We use the DPSK signal as the optical baseband signal, and the OOK signal as the radio frequency signal. In this way, we can use the delay line to demodulate the DPSK signal and also separate the OOK ROF signal and the DPSK signal. As we can see in Fig. 3.8, our purpose is to evident that our system is not only can work on the OOK signal but also work on the DPSK modulated signal so we only do the VPI simulation on back to back system (BtB). In the upper line, we modulated the optical with the OOK signal. In the lower path, we modulate with a sinusoidal wave with frequency 10Ghz. Second, we encode the sequence and modulate the optical carrier with the MZM modulator at null point for BPSK. We combine the two paths into the coupler. At the received side, first we use a one delay line to filter the signal, OOK ROF signal and DPSK baseband signal, second we use another delay line to modulate the DPSK baseband signal. And the OOK ROF signal is demodulated by a sinusoidal wave with 20Ghz frequency and a low pass filter.
In the other setup, we both use the DPSK signal as the ROF and baseband signal. We need no more delay line to demodulate this system as in Fig. 3.9. The only difference from former experiment architecture is that the first delay is used to demodulation and the second delay line is used to be the filter to separate the radio signal and baseband signal as in Fig. 3.9. The advantageous of this arrangement of delay lines is that we can save one
37
delay line if we do the filter first and then demodulate the DPSK signal which needs two delay lines for baseband and radio signal respectively.
3.5 Simulation result of the DPSK
As in the Fig. 3.10, there are clear three eye diagrams for baseband DPSK signal, OOK radio frequency baseband signal and OOK radio frequency signal respectively. In this Fig. 3.10, we can see that there is the DPSK RF signal pattern but the location is between the eye so it won’t influent the bit error rate. The similar eye pattern are shown in the ROF eye diagram. And we also do the BER versus sensitivity measurement. As in Fig. 3.11 , the sensitivities for DPSK, ROF-RF, and ROF baseband signal are -26, -30, -40 dBm. The worst signal is the optical baseband signal. The reason for this is that the DPSK has been influenced by the double sidebands ROF signal, which is the most heavily degraded comparing to ROF signal. The ROF-RF signal needs to be down-convert with a sinusoidal wave so it is obviously that the ROF-RF signal will be worse than the ROF baseband signal. The same the power between the baseband signal and the radio over fiber signal will cause the performance variation for them. As in the Fig. 3.12, the power difference between the baseband and ROF signal is the tradeoff. At the power difference at 3.69 dBm is the balance power for both accepted baseband signal and the ROF-RF signal BER. By the way, the ROF-baseband signal can’t be seen in this chart because the BER performance is under 1E-10 under all power difference condition.
38
Then we can have a look at the DPSK-DPSK ROF system. The eye-diagram are shown in Fig. 3.13. The clear eye diagram show the system can work perfectly. The Fig. 3.14 is the BER versus sensitivity for the both DPSK modulation signal. The error-free sensitivities for DPSK baseband, ROF-RF and ROF-baseband are -29, -30, -36 dBm. The average performance are worse than the OOK-DPSK system because all the modulated signal are phase modulation which easily effect each other while the OOK and DPSK signal are amplitude modulated and phase modulated. In the Fig. 3.15, the best power difference between DPSK baseband and ROF-RF is about 4.9 dBm which can reach the BER balance.
39
Figure 3.1 Experimental setup of the convergent optical wired and wireless access network. Inset: grey box: optical spectra, yellow box: electrical
spectra.
40
Figure 3.3 BER measurements of the (a) baseband NRZ signal for PON applications and (b) baseband-detected ROF and down-converted ROF signal. Insets: corresponding experimental and simulation eye-diagrams.
Figure 3.4 Experimental optical spectra measured at constructive and destructive output ports of the DI.
41
Figure 3.5 Stimulated Q-value against time-delays between the baseband RZ signal and the ROF signal.
Figure 3.6 Stimulated Q-value of the signals against power differences between the baseband NRZ and the ROF signals at (a) B2B and (b) after
42
Figure 3.7 Stimulated Q-value of the signals with different additional lengths of SMF.
43
44
45
Figure 3.10 The eye diagrams for (a)OOK ROF-baseband (b)OOK ROF-RF (c)DPSK-baseband
46
Figure 3.11 The BER curve versus sensitivity for DPSK and OOK convergent system.
Figure 3.12 The BER curve versus power difference for DPSK and OOK convergent system. 1.00E-12 1.00E-11 1.00E-10 1.00E-09 1.00E-08 1.00E-07 1.00E-06 1.00E-05 1.00E-04 1.00E-03 1.00E-02 1.00E-01 1.00E+00 -50 -40 -30 -20 -10 0 B ER snesitivity(dbm)
BER v.s. sensitivity
ROF_BB ROF_RF DPSK 1.00E-10 1.00E-09 1.00E-08 1.00E-07 1.00E-06 1.00E-05 1.00E-04 1.00E-03 1.00E-02 0 5 10 15 20 B ER power differencePower difference vsBER
DPSK_BB ROF_BB ROF_RF
47
Figure 3.13 The eye diagrams for (a) DPSK ROF-baseband (b)DPSK ROF-RF (c) DPSK-baseband.
48
Figure 3.14 The BER curve versus power difference for DPSK and DPSK convergent system
Figure 3.15 The BER curve versus power difference for DPSK and DPSK convergent system 1.00E-12 1.00E-11 1.00E-10 1.00E-09 1.00E-08 1.00E-07 1.00E-06 1.00E-05 1.00E-04 1.00E-03 1.00E-02 1.00E-01 1.00E+00 -50 -40 -30 -20 -10 0 B ER DPSK_mid Semsitivity
BER v.s. sensitivity
ROF_BB ROF_RF DPSK mid Sensitivity 1.00E-10 1.00E-09 1.00E-08 1.00E-07 1.00E-06 1.00E-05 1.00E-04 1.00E-03 1.00E-02 0 5 10 15 20 B ER power differencePower different vs.. BER
DPSK_BB ROF_BB ROF_RF
49
Chapter Four
40Gb/s PON power consumption
4.1 Study motivation
In these few years, the demand of Internet bandwidth has been exponentially increasing so that high capacity and inexpensive network systems have become the current trend [41]. In order to deal with the growth of the Internet traffic, IEEE802.3 has standardized the next generation 40Gb/s Ethernet access network [42]. In addition, from the view point of reducing the operation expenditure and global warning environment issues, power consumption is also the next concern topic which could be ultimate limit for the future telecommunication development [43]. In the standard specified by IEEE802.3, the preferable solution to achieve next generation 40Gb/s access networks is to use 4 x 10Gb/s. This means every user must add additional transceivers and receivers to upgrade from 10Gb/s to 40Gb/s. However, because of the extra equipments, the total energy consumption would be intuitively regarded as fourfold in the new architecture which may violate the concept of the energy efficient Ethernet. In this chapter, we analyze the power consumption per customer and energy transmission per bit for next generation 40Gb/s PON. The analysis is based on the assumption in Ref. [44] and our results conclude that the power consumption only increases 3.5 W per customer when the 10Gb/s PON is upgraded to 40Gb/s PON in
50
standard reach; moreover, the energy consumption per bit are almost the same between 10Gb/s and 40Gb/s at 1Gb/s peak access rate. The power consumption at 10Gb/s and 40Gb/s under standard PON and long-reach PON (LR-PON) is analyzed and compared.
4.2 The structure of the Ethernet network
As we can in Fig. 4.1, the nowadays internet network can de divided into several parts, access network, metro and edge network, core network and video distribution network.
Access network
In access network, There are several different technologies in use today, and more are in development [45]. Shown in Fig. 4.1 is the technologies commonly used in access network. They are digital subscriber line (DSL) and three promising candidates for future high access rates PON, fiber to the node (FTTN), and point to point (PtP) optical systems. DSL is a cooper based access technology and the asymmetric digital subscriber line(ADSL) is usually seen in Taiwan which is the asymmetric upstream and downstream bandwidth. The ADSL usually be limited in the capacity of the usable bandwidth. In order to fix this problem, the internet service provider begun to install the fiber based technology such as PON. In some areas where customers are already served by good-quality copper pairs, a hybrid FTTN technology may be used [45]. Back bone fiber is provided from a network connect to a DSL access multiplexer (DSLAM) in a street cabinet which is close to a group of customers, and high-speed copper pair cable technologies e.g. very high-speed digital subscriber line (VDSL) are used
51
for connecting the terminal user. The highest speed access network today would probably a fiber between the customer premises and the switch in a PtP optical network [45]. The customer user would equip an optical media converter (OMC) to convert the electrical signal used inside the home to an optical signal. In the next part we are going to explain our capacity with energy consumption.
The per customer capacity AT is the total number downstream bits,
measured at the network side of the terminal unit, divided by the number of customers connected to that terminal unit
(4) where AI and AC are the per customer capacities in the public internet and
VDN, respectively. AMC is the multicast video traffic. The minimum
available capacity to per customer from the public internet is given by here M is the oversubscription rate.
In our model, the multicast video traffic on the final link to the customer and is given by
(7)
LB is the number of backhaul links from the terminal unit to the metro and edge network to carry multicast video services.
52
The metro and edge network serves as the interface between the access network and the core network. The metro and edge network includes edge Ethernet switches, broadband network gateway (BNG) or broadband remote access server (BRAS) routers, and provider edge routers. Edge Ethernet switches concentrate the signal traffic from a large number of access nodes and up-connect to two or more BNG or BRAS routers. The BNG or BRAS routers perform access rate control, authentication, and security services, and connect to multiple provider edge routers to increase reliability. The provider edge routers connect to the core of the network.
Core network
The core network includes a few large routers in major population centers. These core routers act all the necessary routing and also serve as the gateway to neighboring core nodes. The core routers are often highly meshed, but have a few links to the networks of other providers. High-capacity WDM fiber link is used to interconnect these routers and connect to networks of other operators.
Video distribution network
The performance requirements for an IPTV multicast and video-on-demand (VOD) service are largely different from those of Internet service, especially in terms of permitted packet delay and packet loss [46]. As shown in Fig. 4.1, the VDN bypasses the BRAS or BNG routers and so frees them from involving in authenticating, accounting, and management. The power consumption of these servers and authentication
53
systems in BNG and BRAS are not included in our model but The VDN has redundant routers and links which are not shown in Fig. 4.1 are included in our model.
4.3 Network model
If a state of art router or switch has capacity C0 and has power
consumption P0, then in t years a state of art router will have capacity CR
and power consumption given by
(8) where is the annual rate of improvement of state of art technology. P0/C0
is the energy efficient of router transmission per bit. Neilson observe the power consumption and capacity relation between the past ten years, and he declared the [47]. Furthermore; it’s is widely acknowledged that the Internet traffic is growing exponentially and that this trend will continue, so the relation between the access rate A0 and the future access
rate A after t year is
(9) where (Internet traffic become two times every two years). And we paraphrase the equation (9) into
(10)
and we substitute the equation (10) into (8) and it becomes
(11)
54
in these subsystems so the relation between WDM efficiency and access rate A becomes
(12)
Not only confirm the equations about capacity and power consumption, we also need to define the power consumption of the access network. The power consumption of access technologies Pa can be express as
(13)
where (cpe: customer premise equipment) is the power consumed by the customer premises equipment which is approximately 5 W. , are the power consumption of the remote node and the terminal unit at the central office. The factor of 2 accounts for cooling at the central office[48]. NRN, NTU is the number of the remote node and the terminal unit.
In the coming part, we are going to illustrate the values of the parameter for different technologies and the power consumption in the access network, metro network and core network.
Power consumption in access network
(1) Digital subscriber line:
Typical DSL services are ADSL services with download speeds higher than upload speeds. One of the most common DSL technologies currently in operation is ADSL2+, which provides theoretical maximum speeds of 24 Mb/s downstream and 1 Mb/s upstream.
(2) Passive optical network:
The capacity per customer in PON network is determined by backhaul capacity, ONU access rates, and the number of ONUs that share a
55
connection to an OLT.. In our model, we consider a G-PON access network, providing asymmetric 2.4 Gb/s downstream and 1.2 Gb/s upstream from the ONU to the OLT. The specification for the model is the Wave ONT-G1000i ONU [50] and the Hitachi 1220 OLT [49] and the power consumption is 5 Walt. All our simulations are focus on the PON so the rest of the access technologies are not very important in our chapter
(3) Fiber to the node:
In an FTTN network using VDSL, each remote node houses a VDSL DSLAM which connects to several homes through the copper wire and connects back to the OLT through an ONU.
Power consumption in metro network
The per customer power consumption of the metro network Pm can be expressed as
(14)
where PES is the per customer power consumption of the edge Ethernet
switches, while the PGateway and PEdge are the total power consumption of a
gateway router and provider edge router, respectively. CGateway and CEdge
and are the capacities of the gateway routers and provider edge routers, respectively. In the following paragraphs, we give estimated values for these parameters. The former factor of 2 is for cooling. The second factor of 2 is for redundancy upstream of the Ethernet switch.
(1)Ethernet switches: The number of Ethernet switches is determined by the number OLTs or small Ethernet switches. As the access rate increases, the number of OLTs or Ethernet switches required increases. A Cisco
56
Catalyst 6513 switch has 384 GE ports, a switching capacity of 720 Gb/s and consumes 3.21 kW [51]. The per customer power consumption of the Ethernet switches is given by
(15)
where the first term in the numerator represents the number of GE ports used by a single terminal unit. The second term and the third term is represent number of the port which connect the terminal unit to the VDN and public internet, respectively. The factor of 2 is to include the requirements for redundancy upstream of the Ethernet switch. As mentioned before, the LB is the number of backhaul links from the terminal
unit to the edge Ethernet switch to support multicast video services which needs only one copy of the signal for a Ethernet switch so that over 20000 users can share LB*1Gb/s.
(2) Gateway routers: The Cisco 10008 gateway router consumes 1.1 kW and has a capacity to support 8 Gb/s [51].
(3) Provider edge routers: A Cisco 12816 router consumes 4.21 kW and in the configuration used in our model has a capacity of 160 Gb/s [51].
Power consumption in Video distribution network
A Cisco 7613 router consumes 4.6 kW and serves a capacity of 120 Gb/s [51]. If we assume that traffic through the VDN takes two hops, the per customer power consumption of the VDN to support VOD and premium IP services, is given by
57
where the factor of 4 accounts for the power requirements for cooling and redundancy. The factor of 3 is included because three routers are transited for two hops.
Power consumption in Core network
A Cisco CRS-1 core router consumes approximately 10.9 kW and has a full-duplex switching capacity of 640 Gb/s [51]. The per customer power consumed by the core node is
(16) where H denotes the number of core node hops. The factor of 8 is required because core routers are usually prepared for future growth of double current peak demand [52]. Second factor of 2 accounts for the power requirements for cooling, and the last factor of 2 is for redundancy. In our model, customer’s signal must transmit over three hops to reach the network core so we assume an average 10 core hops, giving us an average of 13 hops in total.
Power consumption in Transport Systems
Edge and core routers are suitable for operation on fiber for distances up to approximately 80 km. Long links between metro edge router sites commonly employ WDM transport systems. The terrestrial WDM line terminal in our model provides mainly optical power, amplification, and dispersion compensation. In our model, terrestrial links from edge routers to core routers, and both terrestrial and undersea links between core routers
58
(1) Terrestrial WDM systems: The Fujitsu Flashwave 7700 WDM
terminal systems will consume 811 W for every 44 channels [52], operating at 40 Gb/s for each channel. If the distance between the two terminal systems is longer than 100 km, an in line amplifier is required and consumes 622 W for every 44 channels [52]. In this model, the average distance between terrestrially connected core routers is 1500 km and so 14 in-line amplifiers and two terminal systems are required for every 44 channels. The per customer power consumed by the core terrestrial WDM links is given by
(17) ()
where H is the average number of core hops, and U is the ratio of traffic going to neighboring nodes through undersea WDM systems. The parameter of 235 W is the calculated power per channel. The factor of 4 at the front is for the cooling and redundancy. In addition, we assume the half of the number of hops because lots of the core hops are intra-connection so that WDM transport is not used. And the edge routers are assumed to locate within 80 km so no WDM transponder systems required.
(2) Undersea WDM systems: Current undersea fiber cables support 64 wavelengths at capacity 10 Gb/s with four fiber pairs [53]. The fiber cable power feed has a resistance of 1 /km, and approximately 1A of dc is used by the repeaters [54]. A repeater is required every 50 km and each repeater consumes 40 W [54]. The terminal systems used undersea are similar to those in terrestrial WDM systems, but include special transponders and consume 9 kW per cable [52], [54]. Assuming 80% efficiency in the power