國
立
交
通
大
學
生物科技學系暨研究所
碩
碩
碩
碩
士
士
士
士
論
論
論
論
文
文
文
文
使用物化性質為基礎的最佳化方法來預測
DNA 鍵結蛋白質
Predicting DNA-binding proteins using a
physicochemical-property-based optimization method
研 究 生:林意哲
指導教授:何信瑩 博士
黃慧玲 博士
i
使用物化性質為基礎的最佳化方法來預測
DNA 鍵結蛋白質
研究生:林意哲 指導教授:何信瑩 博士
黃慧玲 博士
國立交通大學生物科技學系暨研究所碩士班
摘 要
辨認去氧核醣核酸(DNA)鍵結蛋白質不僅是一種在基因組註解領域中的一個重要 挑戰,在研究基因調控中也扮演了非常重要的作用,包括從去氧核醣核酸的複製到基因 表達的調控。近年來,許多研究預測去氧核醣核酸的鍵結蛋白質是使用物化性質當為特 性,但使用物化性質的全面性研究仍有待發展。本研究使用最佳化方式挑選文獻中的眾 多物化性質來預測蛋白質序列是否為去氧核醣核酸鍵結蛋白質。 我們提出一個繼承式雙目標基因演算法為基礎的物化性質挑選方法,利用支持向量 機與物化性質結合得到了一組物化性質來預測是否為去氧核醣核酸鍵結蛋白質。一般而 言,生物學家需要領域知識來選擇有效的物化性質進行蛋白質的分析和預測。本研究方 法可以用來了解去氧核醣核酸鍵結蛋白質和非去氧核醣核酸鍵結蛋白質之間的不同 點,是一種容易被用於預測與了解各種鍵結蛋白質的功能和特色的有效方法。 在本實驗中使用文獻提供的多個資料集來做分析比較,包括 DNA 鍵結蛋白質與 DNA 鍵結功能域的預測,預測方法分別使用了 22 和 28 個由 AAindex 資料庫挑選的物 化性質來預測,得到和文獻方法相近的預測正確率。從物化性質的分析中,我們將物化 性質用 Fuzzy C-means 演算法再加以分群歸類,了解鍵結蛋白質與鍵結功能域的特徵差 異。這個挑選物化性質為特徵的最佳化方法可當做核心方法,進一步用於設計其它預測 去氧核醣核酸結合蛋白質的問題。ii
Predicting DNA-binding proteins using a
physicochemical-property-based optimization method
Student::::I-Che Lin Advisors::::Dr. Shinn-Ying Ho Dr. Hui-Ling Huang
Institute of Biological Science and Technology National Chiao Tung University
ABSTRACT
Identification of DNA-binding proteins is not only a kind of key challenge in the field of genome annotation but also plays a very important role in investigating gene regulation, from DNA replicationto gene expression control. In recent years, many studies of predicting DNA-binding proteins have used physicochemical properties as features, but the comprehensive study of using physicochemical properties can be further investigated. In this thesis, we use an optimization approach to selecting informative physicochemical properties from a database AAindex to predict DNA-binding proteins.
We proposed a prediction method SVM-PCP of using support vector machine (SVM) and informative physicochemical properties as the features to predict DNA-binding domains and proteins. SVM-PCP uses an inheritable bi-objective genetic algorithm to identify a small set of informative physicochemical properties while maximizing the prediction accuracy. Generally, biologists need domain knowledge to identify the physicochemical properties for analyzing and predicting DNA-binding domains and proteins. In this thesis, the computational method can be used to analyze the similarity and difference between the DNA-binding and non-DNA binding domains/proteins, which is an effective method to further understand the functions of DNA-binding domains and proteins.
Several data sets were used in the experiments to evaluate the proposed method, including two data sets of DNA-binding domains and proteins. SVM-PCP identified 22 and 28 physicochemical properties from a database AAindex for predicting DNA-binding domains and proteins, respectively. The performance of SVM-PCP is comparable to that of using PSSM, compared with an existing method. The physicochemical properties are clustered by using a fuzzy C-means algorithm for further understanding the functions and characteristics of DNA-binding domains and proteins. From the analysis of informative physicochemical properties, some knowledge of DNA-binding and non DNA-binding proteins can be further investigated. The proposed physicochemical-property-based optimization method can be used conveniently as the core for designing predictors for various DNA-binding problems.
iii
Acknowledgements
在此我要非常感謝我的指導教授-何信瑩老師,這碩士生涯兩年以來,教導我與我大學 時期完全不同領域的知識,在我許多無法突破的瓶頸時,能夠很快的引導我找到問題的 所在並協助我,提供給我許多寶貴的建議,讓我學習到很多以前不同的知識,也體會到 很多我以前不曾想過的處事方法與態度,也讓我能順利的完成研究,除了感謝還是感謝。 。另外還要感謝慧玲學姐,他幫助我很多在實驗方法的問題,也非常細心的教導我,因 此我能很快的上手,也讓我的實驗能夠順利進行完成論文,由衷的感謝。此外還要感謝 實驗室學長姐們,幫我許多在程式方面與機器的設定,也能夠在適時提供建議,讓實驗 進行更順利。同時也要感謝所有的同學與學弟妹們,有問題時提出來共同討論並能很快 的得到解決方法,不會因為些許小問題而研究停頓下來,他們也給我很多鼓勵。最後要 謝謝我的家人,他們是我精神的原動力,也要特別感謝姐姐,因為有他的支持,使我沒 有經濟壓力,也要感謝在天上的父親,當時沒有他的鼓勵,也不會有今天這篇論文。iv
Contents
摘 要 ... i ABSTRACT ... ii Acknowledgements ... iii Contents ... iv List of Tables ... viList of Figures... vii
Chapter 1 Introduction...1
1.1 Background and motivations...1
1.2 Aim of the study ...1
1.3 Related Works...1
1.4 Thesis Overview...2
Chapter 2 DNA-binding protein ...3
2.1 Classification of DNA-BPs...4 2.1.1 Helix-Turn-Helix ...4 2.1.2 Zinc Finger ...6 2.1.3 Homeodomain ...7 2.1.4 Leucine Zipper...7 2.1.5 Basic Helix-Loop-Helix ...9 2.2 Function of DNA-BPs...10
2.3 DNA-binding domain and physicochemical properties of the relationship ...11
Chapter 3 Materials and Methods...12
3.1Datasets ...12
3.1.1 DNAset ...12
3.1.2 DNAaset ...12
3.1.3 DNAiset ...12
3.2Physicochemical Properties ...13
3.3 physicochemical properties for predicting DNA-BPs ...13
3.4 Support Vector Machine...13
3.5 Feature Selection By Inheritable Bi-objective Genetic Algorithm ...14
3.6 Clustering properties by fuzzy c-means...15
3.7 Prediction Method PPD ...17
Chapter 4 Results and Discussion ...19
4.1 Results of different ratios of training and cross validation datasets ...19
4.2 Selected a small set of physicochemical properties...20
v
4.4B-factor...24 Chapter 5 Conclusions...26 Reference ...27
vi
List of Tables
Table 1. The statistic of the training datasets...12
Table 2. The 20 clusters and their corresponding physicochemical and biochemical properties in the AAindex database ...16
Table 3. Results of training and cross validation...19
Table 4.This data from Kumar et al., 2007...19
Table 5. Results of the independent test ...19
Table 6. The feature set with m = 22 having the highest appearance frequency of properties in the 30 feature sets on main dataset. ...21
Table 7. The feature set with m = 28 having the highest appearance frequency of properties in the 28 feature sets on alternate dataset. ...22
Table 8. The represented the cluster sets using the features sets consisting of 22、28 and physicochemical properties ...23
vii
List of Figures
Fig.1 Palindrome of six bases in double-stranded DNA. ...3
Fig. 2 DNA replicationto gene expression control. ... 3
Fig. 3 DNA-binding protein protruding into the major groove (PDB ID: 1B81). ...3
Fig. 4 Helix-turn-helix...4
Fig. 5 (A) Helix-turn-helix protein is a dimer, it binding of Helix-Turn-Helix Motif to DNA. (B) The pairs of α-helices bind into two neighboring major grooves in the DNA...5
Fig. 6 Helix-turn-helix (A) DNA-binding domain of Lac repressor (PDB ID 1LCC) (B) entire Lac repressor (PDB ID 1LBG) ...5
Fig. 7 Zinc Finger DNA-Binding Protein a central zinc atom is bound to the sulfurs of cysteine (C) and the nitrogens of histidine (H). Chains of amino acids of varying lengths (x = chain length) extend from these binding regions. The zinc finger forms a component of a much larger protein and binds the protein to DNA. ...6
Fig. 8 Zinc Fingers. Zinc fingers (purple) interaction with DNA (PDB ID 1A1L)....6
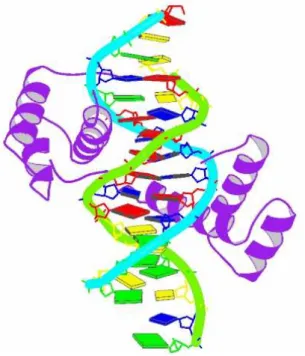
Fig. 9 Homeodomain. This picture is a homeodomain bound to DNA, this is a protein Ultrabithorax (PDB ID 1B81) ...7
Fig. 10 Leucine zippers.The Leu (L) residues at every seventh position in the zipper region, and the number of Lys(K) and Arg (R) residues in the DNA-binding region. ...8
Fig. 11 Leucine zipper from the GCN4 (PDB ID 1YSA). Only the “zippered” α-helices (purple) derived from different subunits of the dimeric protein. The two helices wrap around each other in a gently coiled coil. The interacting Leu residues are shown in red line...8
Fig. 12 Leucine Zipper Protein Binding DNA (A) The leucine zipper consists of two a-helixes that have hydrophobic zones and basic ends. (B) The helixes of the leucine zipper binds to each other by their hydrophobic regions and to DNA by their basic regions. ...9
Fig. 13 Helix-loop-helix. The protein is dimeric (purple); The DNA-binding segment (red circle) merges with the first helix of the helix-loop-helix (blue circle). The second helix merges with the carboxyl-terminal end of the subunit (green circle) (PDB ID 1HLO). ...9 Fig. 14 Principle of Positive and Negative Regulation In positive regulation, a
signal changes the conformation of an inactive regulator, which then becomes active and binds to the regulatory region of a gene. Its presence aids the
viii
binding of the RNA polymerase and helps switch on the gene. In negative regulation, a repressor molecule blocks the promoter of the gene. A signal changes the conformation of the repressor, releasing it from the gene and allowing the RNA polymerase to bind. ...11
Figure 15 The minimum spanning tree of the amino acid indices stored in the AAindex1 release 9.0 [10]. Each rectangle is an amino acid index. Coloured nodes represent the indices classified by Tomii and Kanehisa [11] Red (A): alpha and turn propensities, Yellow (B): betapropensity, Green (C):
composition, Blue (H): hydrophobicity, Cyan (P): physicochemical properties, Gray (O): other properties. White: the indices added to the AAindex after the release 3.0 by Tomii and Kanehisa [11]. ...17
Fig. 16 The system flowchart of the prediction method...1 Fig. 17 The highest frequency of (A) main dataset 18th (B) alternate dataset 6th in 30
independent runs. X-axis represents the number of immediate feature, Y axis represents the number of each feature, the resulting average accuracy. (A) indicates 22feature number, have the highest accuracy, (B) said that when the number in 28 feature the highest accuracy. ...20 Fig. 18 MED analysis of Main dataset 18th in 30 independent runs. X-axis
represents AAindex the feature (see Table 7), Y axis represents the relative impact of value, the higher the more influential representatives from the figure we can see Number of hydrogen bond donors (Fauchere et al., 1988) in the entire physical and chemical properties most influential. ...23 Fig. 19 MED analysis of Alternate dataset 18th in 30 independent runs. X-axis
represents AAindex the feature (see Table 8), Y axis represents the relative impact of value, the higher the more influential representatives from the figure we can see Normalized frequency of beta-sheet (Chou-Fasman, 1978b) in the entire physical and chemical properties most influential. ...24 Fig. 20 Transcription factor IIB (TFIIB), (PDB ID:1D3U) the b-factor of domain
sequence (B_Chain:1108-1205) ...24 Fig. 21 Transcription factor IIB (TFIIB), (PDB ID:1D3U) the b-factor of total
1
Chapter 1 Introduction
1.1
Background and motivations
DNA-binding proteins (DNA-BPs) play an important role in the regulation of gene expression of both eukaryotic and prokaryotic proteomes. It is mainly controlled by way of transcription factors binding to DNA for promoting or repressing gene expression levels. These transcription factors are mainly DNA-binding proteins coded by 2–3% of the genome in prokaryotes and 6–7% in eukaryotes proteins can bind to DNA. While, these proteins play vital roles in biological processes, such as DNA packaging, replication, repairs, recombination, transcription regulation and other critical activity steps in cellular development (Frishman and Mewes, 1997; Luscombe et al., 2000; Luscombe and Thornton, 2002; Stawiski et al., 2003 Lejeune et al., 2005).
In the post-genomic era, the genome annotation is an important issue we want to know. While, identification of DNA-BPs is not only a kind of the key to challenges in the field of genome annotation but also play a very important role in gene-regulation.
1.2
Aim of the study
Unfortunately, the mechanism of protein-DNA binding remains unclear. Thus we want to know the relativity between physicochemical properties and DNA-BPs or non DNA-BPs.
We can further on understanding the role of physicochemical properties on DNA-BPs. In recent years, many studies of prediction DNA-BPs have used physicochemical properties as features, but the physicochemical properties can be further comprehensive.
1.3
Related Works
Many researches mainly focused on prediction and analysis of protein binding sites in DNA [1-3] or protein based classification of binding and non-binding proteins [4, 5]. In this study, we are interested in protein based classification of binding and non-binding proteins. Stawiski et al. found that nucleic acid-binding proteins could be separated using a neural network trained that included secondary structure and charged patches, among others [6]. Ahmad and Sarai using a simple linear predictor to model a trivial system with few descriptors and they identified cutoff values for charge and dipole moment at which binding and non-binding proteins could be separated [7]. Kumar et al. proposed a method for
2
predicting DNA-binding proteins using SVM and PSSM profiles [8].
We investigate the optimal design of predictors for DNA-DBs from amino acid sequence using both informative features and an appropriate classifier. Furthermore, we obtain a set of relevant physicochemical properties can advance prediction performance. Physicochemical properties extracted from protein sequences were utilized as effective features in recent years. ProLoc [9] is a support vector machine (SVM) based classifier with automatic selection from a large set of physicochemical composition features to predict protein subnuclear localization. The POPI method used physicochemical properties as efficient features to predict peptide immunogenicity [10]. The prediction method UbiPred [11] mined informative physicochemical properties from protein sequences to identify promising ubiquitylation sites. Hsu et al. [12] analyzed the physicochemical properties on prediction of R5, X4 and R5X4 HIV-1 coreceptor usage.
1.4
Thesis Overview
This thesis has three-fold: (1) a frequency-based technique by scoring on multiple sets of potentially effective physicochemical properties is used to determine a feature set of informative physicochemical properties for DNA-DBs problems; (2) propose the predictors for DNA-DBs from amino acid sequence using both informative features and SVM classifier; (3) develop as an efficient tool so that various SVMs can be used conveniently as the core for DNA-DBs problems.
We found that the selected clusters set on Main dataset are included the selected clusters set on Alternate dataset and Realistic dataset. It can show the difference from DNA-binding domain and DNA-binding protein.
3
Chapter 2 DNA-binding protein
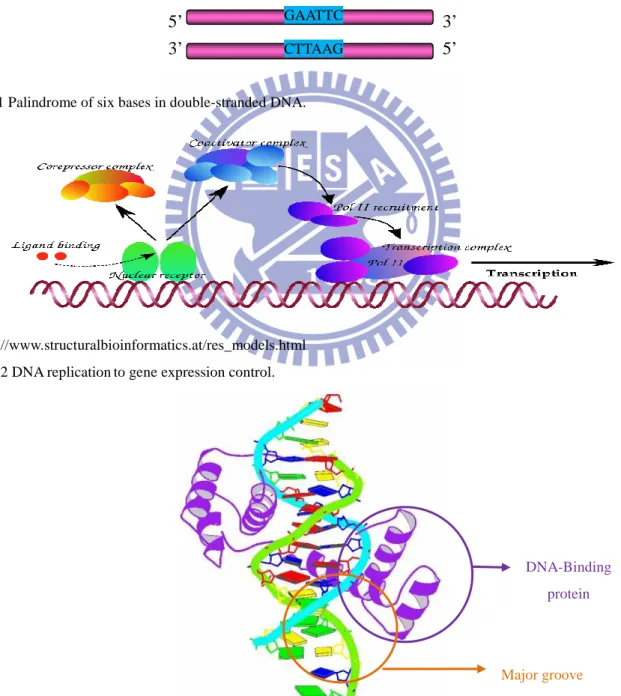
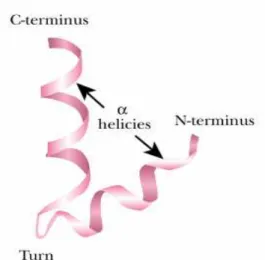
DNA-binding proteins are composed of DNA-binding domains and it had a specific or high affinity for either single or double stranded DNA. Many sequence-specific DNA-binding proteins are arranged as palindromes, for example, one strand is 5’-GAATTC-3’ and the other strand is 3’-CTTAAG-5’ (Fig. 1) that can form triple helices or even H-DNA are found within regions involved in the regulation of expression in the living cells(Fig. 2). Then the Sequence -specific DNA-binding proteins can interact with the major groove of DNA (Fig. 3), because it exposes more functional groups that identify a base pair.
5’ 3’ 3’ 5’
Fig.1 Palindrome of six bases in double-stranded DNA.
http://www.structuralbioinformatics.at/res_models.html Fig. 2 DNA replicationto gene expression control.
Fig. 3 DNA-binding protein protruding into the major groove (PDB ID: 1B81). GAATTC
CTTAAG
DNA-Binding protein
4
DNA-binding proteins are involved in regulation of DNA replication, gene expression, protection, and repair of DNA. DNA-binding proteins can recognize and bind to specific DNA sequences. Usually, DNA-BPs has distinct DNA-binding domains and these domains have common structural motif to bind DNA, like the helix-turn-helix, zinc finger, and homeodomain. On the other hand, DNA-binding proteins also involve in protein-protein interaction domain, including the leucine zipper and helix-loop-helix, their main function are the transcriptional activation and dimerization.
Understanding the properties of regulatory DNA-binding proteins is very importance thing in biotechnology. We can use to control the gene expression and so on. DNA-binding proteins are also of relevance in molecular medicine, such as cancer and aging. A wide range of DNA-binding proteins but there are some common themes in how these proteins interact with DNA[13, 14]
2.1 Classification of DNA-BPs
Terms of the regulatory proteins, DNA-BPs can be divided into two parts, one is a DNA-binding domain common motif that can recognize the specific DNA sequences, including helix-turn-helix, zinc finger, and homeodomain, the other for the protein-protein interaction domain involve in leucine zipper and helix-loop-helix.
2.1.1 Helix-Turn-Helix
Helix-turn-helix DNA-binding motif consist of two alpha-helices and a loop (Fig.4), it uses the alpha-helices fits into the major groove and makes bases pairing of the double helix DNA , these motifs usually bind as dimers to inverted repeats in the DNA(Fig. 5).
5
Fig. 5 (A) Helix-turn-helix protein is a dimer, it binding of Helix-Turn-Helix Motif to DNA. (B) The pairs of α-helices bind into two neighboring major grooves in the DNA.
This motif is also the key to the interaction of many prokaryotic regulatory proteins and some similar motifs occur in eukaryotic regulatory proteins with DNA. The helix-turn-helix motif comprises about 20 amino acids in two short alpha-helical segments, each seven to nine amino acid residues long, separated by a beta turn (Fig. 6).
Fig. 6 Helix-turn-helix (A) DNA-binding domain of Lac repressor (PDB ID 1LCC) (B) entire Lac repressor (PDB ID 1LBG)
Helix-Turn-Helix motif
(A) (B)
(A) (B)
6
One of the two alpha-helical segments is called the recognition helix in this DNA-binding motif, because it generally involve in many of the amino acids that interact with the DNA in a specific sequence way. This alpha-helix is stacked on other segments of the protein structure so that it protrudes from the protein surface. When bound to DNA, the recognition helix is positioned in or nearly in the major groove. The Lac repressor has this DNA-binding motif. [13, 14]
2.1.2 Zinc Finger
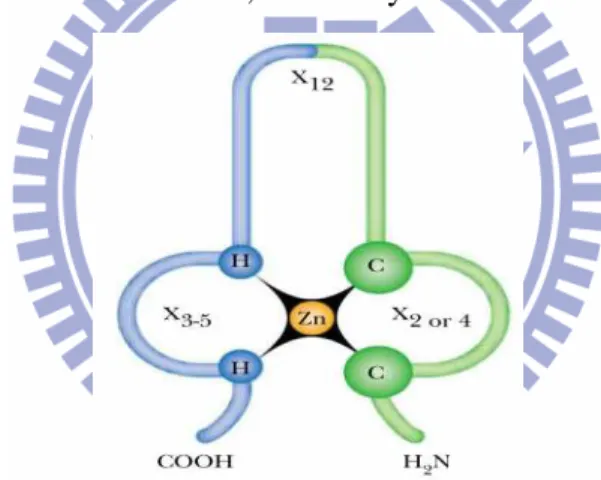
Zinc finger about 25-30 amino acid residues form an elongated loop held together at the base by a central zinc atom (Fig. 7), the Zn is bound to two cysteines and two histidines (or four cysteines), the far end of the a-helix protrudes into the major groove of the DNA. The zinc does not itself interact with DNA; so, the coordination of zinc with the amino acid residues stabilizes this small structural motif. Several hydrophobic side chains in the core of the structure also lend stability. It shows the interaction between DNA and three zinc fingers of a single polypeptide from the regulatory protein Zif268 (Fig. 8). To this day, about thousand of zinc finger proteins are known, and many of them have multiple fingers.
Fig. 7 Zinc Finger DNA-Binding Protein a central zinc atom is bound to the sulfurs of cysteine (C) and the nitrogens of histidine (H). Chains of amino acids of varying lengths (x = chain length) extend from these binding regions. The zinc finger forms a component of a much larger protein and binds the protein to DNA.
Fig. 8 Zinc Fingers. Zinc fingers (purple) interaction with DNA (PDB ID 1A1L)
7
Each zinc finger unit usually recognizes three bases (lesser four or five) in the DNA. The sequence specificity of each zinc finger depends on the amino acid sequence of the polypeptide chain between the His and Cys residues that bind the zinc. Amino acids in this region make hydrogen bonds with bases in the DNA.[13, 14]
2.1.3 Homeodomain
This DNA-binding domain has been identified in a lot of proteins that function as transcriptional regulators, especially during eukaryotic development. This domain of 60 amino acids—called the homeodomain, because it was discovered in homeotic genes (genes that regulate the development of body patterns)—is highly conserved and has now been identified in proteins from a wide variety of organisms (Fig. 9). The DNA-binding segment of the domain is related to the helix-turn-helix motif. The DNA sequence that encodes this domain is known as the homeobox.[13, 14]
Fig. 9 Homeodomain. This picture is a homeodomain bound to DNA, this is a protein Ultrabithorax (PDB ID 1B81)
2.1.4Leucine Zipper
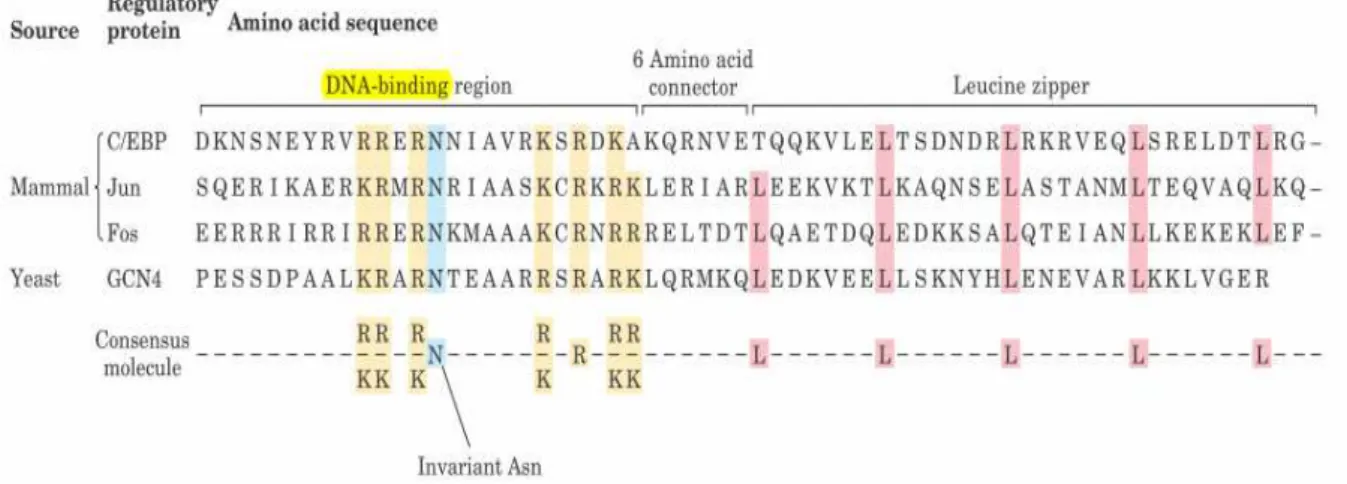
The leucine zipper is found in many eukaryotic transcription factors, like the Fos, Jun and Myc proteins that are involved in control of cell division and carcinogenesis. This motif is an amphipathic alpha-helix with a series of hydrophobic amino acid residues concentrated on one side (Fig. 10), with the hydrophobic surface forming the area of contact between the two polypeptides of a dimer, and leucine zipper motif include α-helix with leucine residues every seventh amino acid, forming a straight line along the hydrophobic surface.
8
“zipper”), we now know that they line up side by side as the interacting α-helices coil around each other(forming a coiled coil; Fig. 11).Furthermore, the amino acids halfway between the leucines are usually hydrophobic. Because there are 3.6 amino acids per turn, these hydrophobic residues form a strip down the side of the α-helix (Fig. 12).
Fig. 10 Leucine zippers.The Leu (L) residues at every seventh position in the zipper region, and the number of Lys(K) and Arg (R) residues in the DNA-binding region.
Fig. 11 Leucine zipper from the GCN4 (PDB ID 1YSA). Only the “zippered” α-helices (purple) derived from different subunits of the dimeric protein. The two helices wrap around each other in a gently coiled coil. The interacting Leu residues are shown in red line.
9
Fig. 12 Leucine Zipper Protein Binding DNA (A) The leucine zipper consists of two a-helixes that have
hydrophobic zones and basic ends. (B) The helixes of the leucine zipper binds to each other by their hydrophobic regions and to DNA by their basic regions.
Regulatory proteins with leucine zippers often have a separate DNA-binding domain with a high concentration of basic (Lys or Arg with positively charged) residues because it can interact with the negatively charged phosphates of the DNA backbone. Leucine zippers have been found in many eukaryotic and a few prokaryotic proteins.[13, 14]
2.1.5 Basic Helix-Loop-Helix
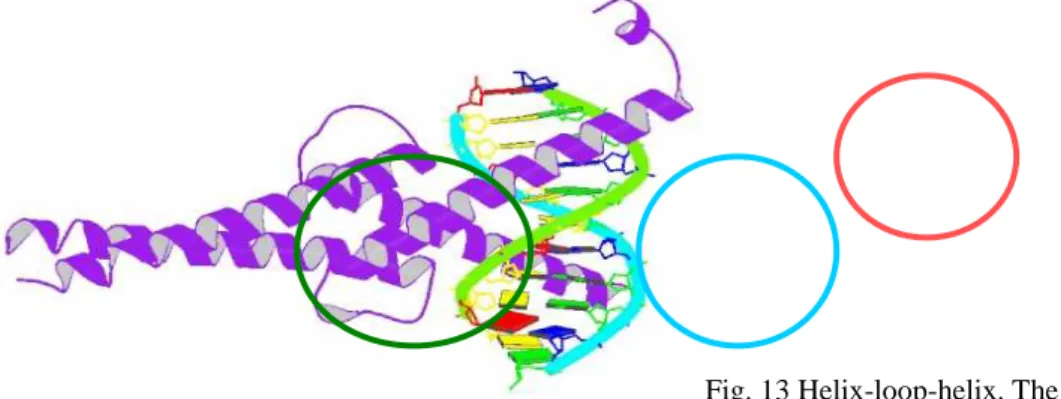
These proteins share a conserved region of about 50 amino acid residues important in both DNA binding and protein dimerization occurs in some eukaryotic regulatory proteins. This region can form two short amphipathic alpha-helices linked by a loop of variable length, the helix-loop-helix (distinct from the helix-turn-helix motif associated with DNA binding).
The helix-loop-helix motifs of two polypeptides interact to form dimers (Fig. 13). In these proteins, DNA binding is mediated by an adjacent short amino acid sequence rich in basic residues, similar to the separate DNA-binding region in proteins containing leucine zippers.[13, 14]
Fig. 13 Helix-loop-helix. The protein is dimeric
10
(purple); The DNA-binding segment (red circle) merges with the first helix of the helix-loop-helix (blue circle). The second helix merges with the carboxyl-terminal end of the subunit (green circle) (PDB ID 1HLO).
2.2 Function of DNA-BPs
DNA-binding proteins include transcription factors which modulate the process of transcription, various polymerases, nucleases which cleave DNA molecules and histones which are involved in chromosome packaging in the cell nucleus. DNA-binding proteins can incorporate such domains as the zinc finger, the helix-turn-helix, and the leucine zipper (among many others) that facilitate binding to nucleic acid. For example, Zinc fingers can also function as RNA-binding motifs, in certain proteins that bind eukaryotic mRNAs and act as translational repressors. Large complexes of proteins are generally required to regulate transcriptional activity. The effects of DNA-binding transactivators on Pol II are mediated by coactivator protein complexes such as TFIID or mediator. The modular structures of the transactivators have distinct activation and DNA-binding domains. Other protein complexes, including histone acetyltransferases and ATP-dependent complexes, reversibly remodel chromatin structure.
In eukaryotes, positive regulation is more common than negative regulation, and transcription is accompanied by large changes in chromatin structure. Promoters for Pol II typically have a TATA box and Inr sequence, as well as multiple binding sites for
DNA-binding transactivators. The latter sites, sometimes located hundreds or thousands of base pairs away from the TATA box, are called upstream activator sequences in yeast and enhancers in higher eukaryotes.
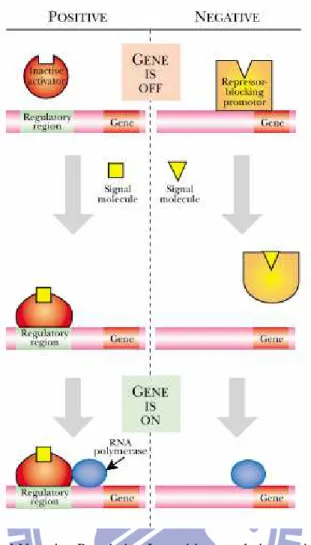
In positive control, an activator is required to turn a gene on, in response to a signal of some kind. In negative control, a gene is switched off by a repressor and is only expressed in the presence of a signal that removes the repressor from the gene. Positive and negative control may be exerted at the level of transcription or at later stages in gene expression. Furthermore, although most activators and repressors are proteins, cases are known in which regulation is due to regulatory RNA or even small molecules.
In both positive and negative control, a small signal molecule, the inducer, typically binds to the regulatory protein and induces gene expression. In the standard model of positive regulation, an inactive activator protein binds the signal molecule and is converted to its DNA-binding form, which then turns on the gene (Fig. 14). Similarly, in typical negative regulation, the DNA-binding form of a repressor protein is converted to its inactive form by binding the signal molecule.[13, 14]
11
Fig. 14 Principle of Positive and Negative Regulation In positive regulation, a signal changes the conformation of an inactive regulator, which then becomes active and binds to the regulatory region of a gene. Its presence aids the binding of the RNA polymerase and helps switch on the gene. In negative regulation, a repressor molecule blocks the promoter of the gene. A signal changes the conformation of the repressor, releasing it from the gene and allowing the RNA polymerase to bind.
2.3 DNA-binding domain and physicochemical properties of the relationship
Looking above, DNA-binding proteins regulate the process of domain for the protein has considerable influence, if we can know the DNA-binding protein with the domain of the relationship, or domain and the physical and chemical properties of the relationship, so I can further understand the door gene regulation in the meaning and use.
Many studies have discussed the relationship between the physical and chemical characteristics and protein in nature, but unfortunately, a lot of physical and chemical characteristics is not enough to understand or unclear, so by machine learning approach to identify possible and relevant physical and chemical properties, hoping to further understand the interaction between DNA-binding proteins and the physicochemical properties, and can use this result to other biological phenomena.
12
Chapter 3 Materials and Methods
3.1Datasets
3.1.1 DNAsetThis dataset also called main dataset from Kumar et al., 2007 [15]. They got 146 non-redundant DNA-BPs in which no two proteins have the sequence identity of more than 25%. A non-redundant set of 250 non-binding proteins was obtained from Stawiski et al., 2003 [6]. They used following criteria: i) no two protein chains have similarity more than 25% and ii) the approximate size and electrostatics are similar to DNA-BPs. Final dataset called DNAset or main dataset or domain dataset, consists of 146 DNA-binding and 250 non-binding protein chains or domains.
Because this dataset is chains or domains, in order to discriminate these PDB chains from full-length DNA-binding proteins obtained from Swiss-Prot.
3.1.2 DNAaset
We use an alternate dataset called DNAaset. This dataset consists of 1153 DNA-BPs and 1153 NBPs extracted from Yu et al., 2006 [16]. The parent dataset have 88 rRNA-BPs, 377 RNA-BPs, 1153 DNA-BPs and 17779 non-binding proteins.
We use the dataset from Kumar et al., 2007[15], they randomly picked 1153 non DNA-BPs and all 1153 DNA-BPs to constitute the alternate dataset (DNAaset). This is non-redundant dataset where no two proteins have more than 25% similarity.
3.1.3 DNAiset
This dataset is not use for training or testing, the dataset called DNAiset from Kumar et al., 2007[15] and they created an independent dataset. This dataset has 92 DNA-binding protein chains obtained from PDB and 100 nonbinding proteins picked from Swiss-Prot.
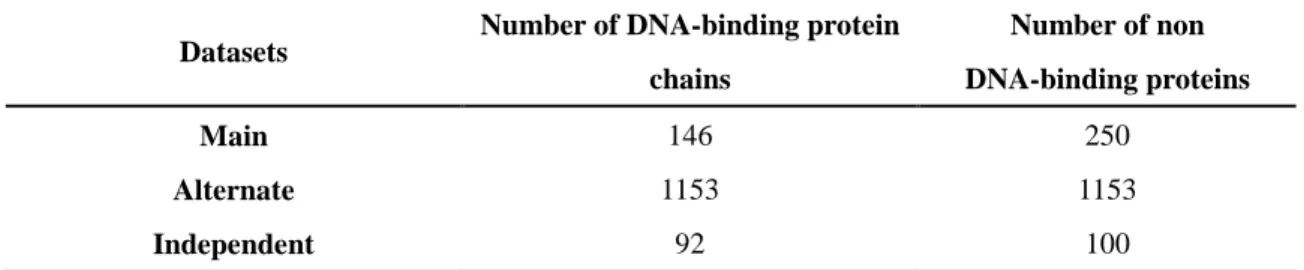
Table 1. The statistic of the training datasets Datasets
Number of DNA-binding protein chains Number of non DNA-binding proteins Main 146 250 Alternate 1153 1153 Independent 92 100
13
3.2Physicochemical Properties
Physicochemical property is the most intuitive feature for biochemical reactions and is extensively applied in bioinformatics studies. The amino acid indices (AAindex) database collects many published indices representing physicochemical properties of amino acids. For each physicochemical property, there is a set of 20 numerical values for amino acids. Currently, 544 physicochemical properties can be retrieved from the AAindex database of version 9.0 [17]. After removing physicochemical properties having the value ‘NA’ in the amino acid indices, 531 physicochemical properties are obtained for the following studies.
In contrast to the residue-based encoding methods of amino acid identity and evolutionary information, there are 531 mean values used to represent a sample [9, 10]. If m out of 531 informative physicochemical properties are selected and are used in SVM, m mean values are used to represent a sample.
3.3 physicochemical properties for predicting DNA-BPs
We propose a novel method using the physicochemical properties for predicting DNA-BPs (PPD). The identification of an effective feature set of physicochemical properties is mainly derived by using an inheritable bi-objective genetic algorithm (IBCGA) [18]. The IBCGA mines informative physicochemical properties and tune parameter settings of Support vector machine (SVM) simultaneously while maximizing 5-fold cross validation (5-CV) accuracy.
The selected m=12, 11 physicochemical properties for Main dataset and Realistic dataset, respectively. The designed SVM are used to implement the computational system for prediction DNA-BPs.
3.4 Support Vector Machine
Support vector machine (SVM) is a learning model dealing with binary classification problems. SVM constructs a binary classifier by finding a hyperplane to separate two classes with a maximal distance between margins of two classes consisting of support vectors. In order to make linear separation of samples easier, SVM uses one of various kernel functions to transform the samples into a high-dimensional search space. In this work, the commonly-used radial basis function is applied to nonlinearly transform the feature space, defined as follows: 0 ), exp( ) , (xi xj = −γ xi−xj γ> K (1)
14
The kernel parameter γ determines how the samples are transformed into a high-dimensional search space. The costparameter C>0 of SVM adjusts the penalty of total error. These two parameters C and γ must be tuned to get the best prediction performance.
For multi-class classification problems, ‘one-against-one’ strategy is applied to transform the multi-class problem into several binary classification problems. Given h classes, there are h(h−1)/2 classifiers constructed and each one trains the samples from two classes. A voting strategy is applied to give a final prediction for test samples. In this study, h=2 and the used SVM is obtained from LIBSVM package version 2.81 [19].
3.5 Feature Selection By Inheritable Bi-objective Genetic Algorithm
Selecting a minimal number of informative features while maximizing prediction accuracy is a bi-objective 0/1 combinatorial optimization problem. An efficient inheritable bi-objective genetic algorithm [18] is utilized to solve this optimization problem. IBCGA consists of an intelligent genetic algorithm [20] with an inheritable mechanism. The intelligent genetic algorithm uses a divide-and-conquer strategy and an orthogonal array crossover to efficiently solve large-scale parameter optimization problems. In this study, the intelligent genetic algorithm can efficiently explore and exploit the search space of C(n, r). IBCGA can efficiently search the space of C(n, r±1) by inheriting a good solution in the space of C(n, r) [18]. Therefore, IBCGA can economically obtain a complete set of high-quality solutions in a single run where r is specified in an interesting range such as [5, 50].
The proposed chromosome encoding scheme of IBCGA consists of both binary genes for feature selection and parametric genes for tuning SVM parameters, where the gene and chromosome are commonly-used terms of genetic algorithm (GA), named GA-gene and GA-chromosome for discrimination in this paper. The GA-chromosome consists of n=531 binary GA-genes bi for selecting informative properties and two 4-bit GA-genes for tuning the
parameters C and γ of SVM. If bi=0, the ith property is excluded from the SVM classifier;
otherwise, the ith propertyis included. This encoding method maps the 16 values of
γ
and C into [2-7, 2-6…, 28 ].The feature vector for training the SVM classifier is obtained from decoding a GA-chromosome using the following steps. Consider a given DNA-PBs sequence. At first, the index vectors for all selected physicochemical properties are constructed from AAindex for each amino acid. Feature vector of a peptide consists of the selected features whose values are obtained by averaging the values in their corresponding index vectors. Finally, all values of the feature vectors are normalized into [-1, 1] for applying SVM.
Fitness function is the only guide for IBCGA to obtain desirable solutions. The fitness function of IBCGA is the 5-CV overall accuracy.
15
IBCGA with the fitness function f(X) can simultaneously obtain a set of solutions, Xr,
where r=rstart, rstart+1, …, rend in asingle run. The algorithm of IBCGA with the given values
rstart and rend is described as follows:
Step 1) (Initiation) Randomly generate an initial population of Npop individuals. All the
n binary GA-genes have r 1’s and n-r 0’s where r = rstart.
Step 2) (Evaluation) Evaluate the fitness values of all individuals using f(X). Step 3) (Selection) Use the traditional tournament selection that selects the winner
from two randomly selected individuals to form a mating pool.
Step 4) (Crossover) Selectpc·Npop parents from the mating pool to perform orthogonal
array crossover on the selected pairs of parents where pc is the crossover
probability.
Step 5) (Mutation) Apply the swap mutation operator to the randomly selected pm·Npop
individuals in the new population where pm is the mutation probability. To
prevent the best fitness value from deteriorating, mutation is not applied to the best individual.
Step 6) (Termination test) If the stopping condition for obtaining the solution Xr is
satisfied, output the best individual as Xr. Otherwise, go to Step 2). In this
study, the stopping condition is to perform 40 generations.
Step 7) (Inheritance) If r < rend, randomly change one bit in the binary GA-genes for
each individual from 0 to 1; increase the number r by one, and go to Step 2). Otherwise, stop the algorithm.
3.6 Clustering properties by fuzzy c-means
Figure 15 obtained from [21]. According to the numerical indices representing 531 properties of amino acids, we clustered them into 20 clusters by using a fuzzy c-means algorithm based on their Euclidean distances between two indices [22].
The physicochemical properties can be classified into six groups according to their biological meanings [23]. From the viewpoint of machine learning, two properties are similar if the distance between their feature vectors is small. To identify informative physicochemical properties and obtain effective feature vectors with strong discriminative abilities, we cluster the 531 vectors of physicochemical properties into 20 clusters (show as Table 2) using a fuzzy c-means (FCM) method[22]. A feature vector of amino acids is a set of 20 numerical values representing a physicochemical property of amino acids. To apply the FCM method, all data were normalized in such a way that every physicochemical property had an averaged profile value of zero and a standard deviation equal to 1. The FCM method has an objective functional of the form [22]:
16
(2) where n=531 is the number of data vectors, K is the number of clusters to be found, u ij Î[0, 1] is the membership degree of j th data vector x j in the i th cluster, the i th cluster represented by the cluster prototype v i , sÎ[1,∞) is a weighting exponent called the fuzzifier and d(v i , x j ) is the distance of x j from the cluster prototype v i . Dembélé and Kastner [24] suggested the parameters setting s=1.12 and K=20 clusters, adopted in this study[25].
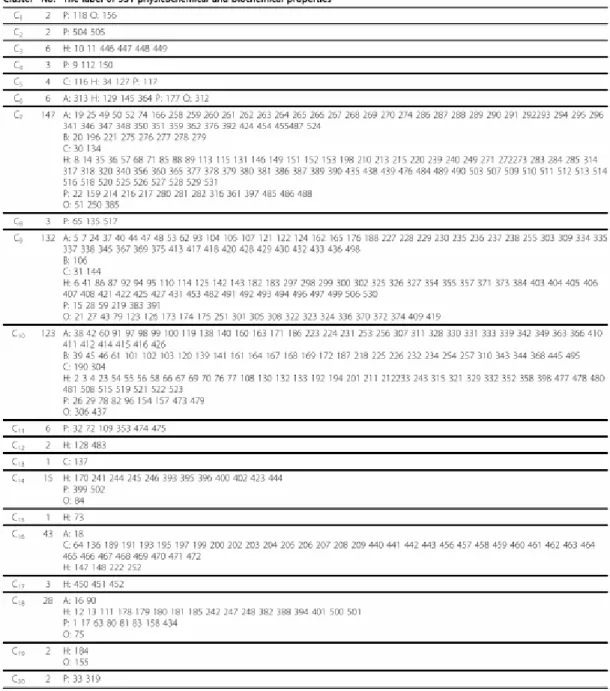
Table 2. The 20 clusters and their corresponding physicochemical and biochemical properties in the AAindex database
17
Figure 15 The minimum spanning tree of the amino acid indices stored in the AAindex1 release 9.0 [10]. Each rectangle is an amino acid index. Coloured nodes represent the indices classified by Tomii and Kanehisa [11] Red (A): alpha and turn propensities, Yellow (B): betapropensity, Green (C): composition, Blue (H): hydrophobicity, Cyan (P): physicochemical properties, Gray (O): other properties. White: the indices added to the AAindex after the release 3.0 by Tomii and Kanehisa [11].
3.7 Prediction Method PPD
The selected m physicochemical properties and the associated parameter set of SVM by using IBCGA are used to implement the computational system and analyze the physicochemical properties to further understand the DNA-BPs. Since the IBCGA is a non-deterministic method, it should make more effort to identify an efficient and robust feature set of informative physicochemical properties in five aspects. The procedure is as the following steps:
Step 1 : We prepare the independent data sets where each set is used as the training dataset of 5-CV.
Step 2 : IBCGA is performed R independent runs for each of independent data sets. In this study, R = 30. There are total 30 sets of m physicochemical properties for each of independent data sets.
Step 3 : We calculate and record the frequencies F( ) of the selected physicochemical properties from the solutions of R independent runs on train dataset.
18 1 ( )) /
(
m i i r S F P m ==
∑
(3)i where F(Pi) denotes the frequencies of the physicochemical property Pi, m is the number of
the selected feature in dependent run r.
Step 5 : Choose the set of selected physicochemical properties with a maximal value of Sr.
The system flowchart of the prediction method PPDs is shown in Fig. 1. PPDs will automatically determine a set of informative physicochemical properties and an SVM-model for prediction binding and non-binding proteins.
In order to provide the analysis of the PPD-based approach on the selected informative physicochemical properties, we calculate the frequency of the selected physicochemical properties from the solutions of R = 30 independent runs on Main dataset and Realistic dataset, shown in Fig. 2(a) and Fig. 2(b), respectively. The informative physicochemical properties were used to determine a prediction system for identify binding and non-binding proteins.
Fig. 16 The system flowchart of the prediction method.
IBCGA SVM IBCGA SVM IBCGA SVM • • • Perform R Independent Run … Run 2 Run 1
Static the frequency of the selected physicochemical
properties from the solutions of R independent runs Calculate score Sr (r = 1, …, R) for each solution
Choose the set of selected physicochemical properties with a maximal value of Sr.
PPD PPD PPD Data set DNA protein sequences 531 Physicochemical properties
19
Chapter 4 Results and Discussion
4.1 Results of different ratios of training and cross validation datasets
To compare the main dataset with the realistic dataset of training/test, we were used the independent dataset for independent test. We got the training/test sets and each set had R = 30 experiment. Results of training sets were shown in Table 3. Table 4 is shown the results that from Kumar et al., 2007 compare with ours (shown as table 5.), Matthew’s correlation coefficient (MCCi) for the ith coreceptor class, i = 1, 2, 3, and the best accuracy and averaged
accuracies for all classes:
(
) (
) (
) (
)
TPi TNi FPi FNi TPi FNi TPi FPi TNi FPi TNi FNi MCCi × − × + × + × + × + = (4)where TPi, TNi, FPi and FNi are the number of true positive, true negative, false positive and
false negative, respectively. The average result of overall accuracy and MCC is high.
Table 3. Results of training and cross validation
Training Frequency Dataset Accuracy (%) Sensitivity (%) Specificity (%) MCC Accuracy (%) Sensitivity (%) Specificity (%) MCC Main 88.89 84.93 91.20 0.76 87.12 82.19 90.00 0.72 Alternate 76.41 82.74 70.08 0.53 75.50 81.96 69.04 0.51
These results have high accuracy and MCC.
Table 4.This data from Kumar et al., 2007 Dataset Accuracy (%) Sensitivity (%) Specificity (%) MCC Main 86.62 86.32 86.80 0.72 Alternate 74.22 73.53 74.92 0.49 These results are from Kumar et al., 2007, they use the PSSM-SVM to evaluate.
Table 5. Results of the independent test
Datasets Sensitivity (%) Specificity (%) Accuracy (%) MCC Main 83.70 78.00 80.73 (155/192) 0.62 Alternate 67.39 81.00 74.48 (143/192) 0.49
20
These data are independent test, the accuracy about 80% and the highest MCC is 0.62.
4.2 Selected a small set of physicochemical properties
IBCGA is utilized to mine informative physicochemical properties using the whole dataset [23]. The best results of 30 runs shown in Fig. 16 reveal that the best numbers of selected features are m = 20 and 28 for Main dataset and Alternate dataset, respectively. The parameter settings (C, γ) of the SVM classifier are (25, 2-2), (25, 2-1)
(A)
(B)
Fig. 17 The highest frequency of (A) main dataset 18th (B) alternate dataset 6th in 30 independent runs. X-axis represents the number of immediate feature, Y axis represents the number of each feature, the resulting average accuracy. (A) indicates 22feature number, have the highest accuracy, (B) said that when the number in 28 feature the highest accuracy.
21
4.3
Analyzing Physicochemical properties
DNA-binding proteins (DNA-BPs) are functional proteins in a cell. How to difference DNA-BPs from other proteins is a very important reach topic in proteomics fields. This study investigates the prediction problem of DNA-binding proteins and proposes an efficient prediction system SVM-PCP to predict DAN-binding proteins with variable lengths. The features sets consisting of 22、28 and physicochemical properties are selected to implement the prediction system SVM-PCP on Main dataset、Alternate dataset and Realistic dataset, respectively.
In order to analysis the efficient features sets, we use FCM algorithm[26] to partition the 531 physicochemical properties into 20 clusters.
For each selected features is belonging to one cluster. The selected features sets are represented the cluster sets. The table 6. is shown the represented the cluster sets using the features sets consisting of 22、28 and physicochemical properties.
Table 6. The feature set with m = 22 having the highest appearance frequency of properties in the 30 feature sets on main dataset.
Feature ID Description
53 Frequency of the 4th residue in turn (Chou-Fasman, 1978b)
56 Normalized hydrophobicity scales for beta-proteins (Cid et al., 1992) 64 Size (Dawson, 1972)
86 Localized electrical effect (Fauchere et al., 1988) 91 pK-a(RCOOH) (Fauchere et al., 1988)
188 Normalized frequency of bata-structure (Nagano, 1973)
202 Ratio of average and computed composition (Nakashima et al., 1990) 227 Normalized frequency of beta-sheet from CF (Palau et al., 1981) 228 Normalized frequency of turn from LG (Palau et al., 1981) 255 Relative frequency in beta-sheet (Prabhakaran, 1990)
262 Weights for alpha-helix at the window position of -3 (Qian-Sejnowski, 1988) 274 Weights for beta-sheet at the window position of -4 (Qian-Sejnowski, 1988) 286 Weights for coil at the window position of -5 (Qian-Sejnowski, 1988) 363 Principal component IV (Sneath, 1966)
383 Average interactions per side chain atom (Warme-Morgan, 1978) 388 Free energy change of epsilon(i) to alpha(Rh) (Wertz-Scheraga, 1978)
412 Normalized positional residue frequency at helix termini N4 (Aurora-Rose, 1998) 430 Free energy in alpha-helical conformation (Munoz-Serrano, 1994)
434 Free energy in beta-strand region (Munoz-Serrano, 1994)
443 Distribution of amino acid residues in the alpha-helices in thermophilic proteins (Kumar et al., 2000)
22
486 Interactivity scale obtained from the contact matrix (Bastolla et al., 2005) 513 Apparent partition energies calculated from Chothia index (Guy, 1985)
Table 7. The feature set with m = 28 having the highest appearance frequency of properties in the 28 feature sets on alternate dataset.
Feature ID
Description
39 Normalized frequency of beta-sheet (Chou-Fasman, 1978b)
56 Normalized hydrophobicity scales for alpha+beta-proteins (Cid et al., 1992) 58 Normalized average hydrophobicity scales (Cid et al., 1992)
86 Number of hydrogen bond donors (Fauchere et al., 1988) 88 Positive charge (Fauchere et al., 1988)
95 Helix termination parameter at posision j+1 (Finkelstein et al., 1991) 100 Alpha-helix indices for alpha/beta-proteins (Geisow-Roberts, 1980) 102 Beta-strand indices for beta-proteins (Geisow-Roberts, 1980) 139 Average relative probability of beta-sheet (Kanehisa-Tsong, 1980) 146 Net charge (Klein et al., 1984)
147 Side chain interaction parameter (Krigbaum-Rubin, 1971)
167 Conformational preference for all beta-strands (Lifson-Sander, 1979) 178 Retention coefficient in HPLC, pH7.4 (Meek, 1980)
214 Short and medium range non-bonded energy per atom (Oobatake-Ooi, 1977) 229 Normalized frequency of alpha-helix in all-alpha class (Palau et al., 1981) 280 Weights for beta-sheet at the window position of 3 (Qian-Sejnowski, 1988) 299 Side chain orientational preference (Rackovsky-Scheraga, 1977)
321 Mean polarity (Radzicka-Wolfenden, 1988)
356 Side chain hydropathy, corrected for solvation (Roseman, 1988) 365 Optimal matching hydrophobicity (Sweet-Eisenberg, 1983) 399 Bulkiness (Zimmerman et al., 1968)
401 Isoelectric point (Zimmerman et al., 1968)
422 Normalized positional residue frequency at helix termini C4' (Aurora-Rose, 1998) 431 Free energy in beta-strand conformation (Munoz-Serrano, 1994)
449 Hydropathy scale based on self-information values in the two-state model (20% accessibility) (Naderi-Manesh et al., 2001)
451 Hydropathy scale based on self-information values in the two-state model (36% accessibility) (Naderi-Manesh et al., 2001)
512 Apparent partition energies calculated from Chothia index (Guy, 1985) 528 Optimized relative partition energies - method C (Miyazawa-Jernigan, 1999)
23
Table 8. The represented the cluster sets using the features sets consisting of 22、28 and physicochemical properties
Datasets Main Alternate
FCM Cluster ID 7 3 FCM Cluster ID 9 7 FCM Cluster ID 10 9 FCM Cluster ID 16 10 FCM Cluster ID 18 14 FCM Cluster ID 16 FCM Cluster ID 17 FCM Cluster ID 18
Total features 22features 28 features
The selected clusters set on Main dataset are included the selected clusters set on Alternate dataset. It can show the difference from DNA-binding domain and DNA-binding protein.
Fig. 18 MED analysis of Main dataset 18th in 30 independent runs. X-axis represents AAindex the feature (see Table 7), Y axis represents the relative impact of value, the higher the more influential representatives from the figure we can see Number of hydrogen bond donors (Fauchere et al., 1988) in the entire physical and chemical properties most influential.
24
Fig. 19 MED analysis of Alternate dataset 18th in 30 independent runs. X-axis represents AAindex the feature (see Table 8), Y axis represents the relative impact of value, the higher the more influential representatives from the figure we can see Normalized frequency of beta-sheet (Chou-Fasman, 1978b) in the entire physical and chemical properties most influential.
4.4B-factor
We use the tool, “PyMOL” to draw the DNA-DBPs, transcription factor IIB (PDB ID: 1D3U). Fig. 19 show the b-factor on Domain sequence (B_Chain:1108-1205). Fig. 20 show the b-factor total sequence. We find the b-factor always has larger changes near DNA. This result may indicate protein of the near DNA that binding force greater with DNA.
25
26
Chapter 5 Conclusions
We have proposed a novel method using physicochemical properties for predicting DNA-BPs (PPD). We had three datasets into training and cross validation. The three datasets are Main dataset, Alternate dataset and Realistic dataset with different sizes for evaluating the proposed methods. The IBCGA mines informative physicochemical properties and tune parameter settings of SVM simultaneously while maximizing 5-CV accuracy. We have calculated the frequency statistics of the selected physicochemical properties from the solutions of the independent runs. Determinate the informative physicochemical properties and SVM-model can be predicted the DNA-binding and non-binding proteins. The PPD can achieve high prediction test accuracy. The m=22, 28 and for Main dataset and Alternate dataset, respectively.
Furthermore we analyzing physicochemical properties from the 20 cluster that from 531 AAindex, we found that the selected clusters set on Main dataset are included into the
selected clusters set on Alternate dataset and Realistic dataset. It can show the difference from DNA-binding domain and DNA-binding protein.
The most important feature work is to analyses the informative physicochemical properties on cluster7, cluster9, cluster10, cluster16 and cluster18 we hope that can provide biologists to apply.
27
Reference
[1] E. Wingender, et al., "TRANSFAC: an integrated system for gene expression regulation," Nucleic Acids Res, vol. 28, pp. 316-9, Jan 1 2000.
[2] A. E. Kel, et al., "MATCH: A tool for searching transcription factor binding sites in DNA sequences," Nucleic Acids Res, vol. 31, pp. 3576-9, Jul 1 2003.
[3] R. Pudimat, et al., "A multiple-feature framework for modelling and predicting transcription factor binding sites," Bioinformatics, vol. 21, pp. 3082-8, Jul 15 2005. [4] S. Ahmad and A. Sarai, "Moment-based prediction of DNA-binding proteins," J Mol
Biol, vol. 341, pp. 65-71, Jul 30 2004.
[5] N. Bhardwaj, et al., "Kernel-based machine learning protocol for predicting DNA-binding proteins," Nucleic Acids Res, vol. 33, pp. 6486-93, 2005.
[6] E. W. Stawiski, et al., "Annotating nucleic acid-binding function based on protein structure," J Mol Biol, vol. 326, pp. 1065-79, Feb 28 2003.
[7] D. C. Chan, et al., "Core structure of gp41 from the HIV envelope glycoprotein," Cell, vol. 89, pp. 263-73, Apr 18 1997.
[8] D. Unutmaz, "T cell signaling mechanisms that regulate HIV-1 infection," Immunologic Research, vol. 23, pp. 167-177, 2001.
[9] W. L. Huang, et al., "ProLoc: Prediction of protein subnuclear localization using SVM with automatic selection from physicochemical composition features," Biosystems, vol. 90, pp. 573-581, Sep-Oct 2007.
[10] C. W. Tung and S. Y. Ho, "POPI: predicting immunogenicity of MHC class I binding peptides by mining informative physicochemical properties," Bioinformatics, vol. 23, pp. 942-9, Apr 15 2007.
[11] C. W. Tung and S. Y. Ho, "Computational identification of ubiquitylation sites from protein sequences," BMC Bioinformatics, vol. 9, p. 310, 2008.
[12] H.-L. H. Kai-Ti Hsu, Yi-Hsiung Chen, and Shinn-Ying Ho,, "Analysis of physicochemical properties on prediction of R5, X4 and R5X4 HIV-1 coreceptor usage,," May 27-29, 2009. 2009.
[13] D. L. Nelson and M. M. Cox, PRINCIPLES OF BIOCHEMISTRY, Fourth ed., 2005. [14] D. P. Clark, Molecular Biology Understanding the Genetic Revolution, 2005. [15] M. Kumar, et al., "Identification of DNA-binding proteins using support vector
machines and evolutionary profiles," BMC Bioinformatics, vol. 8, pp. -, Nov 27 2007. [16] X. Yu, et al., "Predicting rRNA-, RNA-, and DNA-binding proteins from primary
structure with support vector machines," J Theor Biol, vol. 240, pp. 175-84, May 21 2006.
[17] S. Kawashima, et al., "AAindex: amino acid index database, progress report 2008," Nucleic Acids Res, vol. 36, pp. D202-5, Jan 2008.
28
[18] S. Y. Ho, et al., "Inheritable genetic algorithm for biobjective 0/1 combinatorial
optimization problems and its applications," IEEE Trans Syst Man Cybern B Cybern, vol. 34, pp. 609-20, Feb 2004.
[19] C.-C. C. a. C.-J. Lin, "LIBSVM : a library for support vector machines. Software available at http://www.csie.ntu.edu.tw/~cjlin/libsvm " 2001.
[20] S. Y. Ho, et al., "Intelligent evolutionary algorithms for large parameter optimization problems," Ieee Transactions on Evolutionary Computation, vol. 8, pp. 522-541, Dec 2004.
[21] K. S, et al., "AAindex: amino acid index database," Nucleic Acids Res, vol. 36, pp. D202-205, 2008.
[22] B. JC, "Pattern Recognition with Fuzzy Objective Function Algorithms," New York: Plenum Press, 1981.
[23] K. M. Tomii K, "Analysis of amino acid indices and mutation matrices for sequence comparison and structure prediction of proteins," Protein Eng, vol. 9, pp. 27-36, 1996. [24] K. P. Dembele D, "Fuzzy C-means method for clustering microarray data,"
Bioinformatics, vol. 19, pp. 973-980, 2003.
[25] H.-L. Huang, et al., "Predicting and analyzing DNA-binding domains using a systematic approach to identifying a set of informative physicochemical and biochemical
properties," BMC Bioinformatics, vol. 12, p. S47, 2011.
[26] D. Dembele and P. Kastner, "Fuzzy C-means method for clustering microarray data," Bioinformatics, vol. 19, pp. 973-80, May 22 2003.