A Novel Fuzzy Pain Demand Index Derived From
Patient-Controlled Analgesia for Postoperative Pain
Jiann-Shing Shieh, Member, IEEE, Chun-Yi Dai, Yeong-Ray Wen, and Wei-Zen Sun*
Abstract—A multilayer hierarchical structure for an intelligent analysis system is described in this paper. Four levels (patients’, measurement, Web-based, and interpreting) are used to collect massive amounts from clinical information and analyze it with both traditional and artificial intelligent methods. To support this, a novel fuzzy pain demand (FPD) index derived from the interval of each bolus of patient-controlled analgesia (PCA) is designed and documented in a large-scale clinical survey. The FPD index is modeled according to a fuzzy modeling algorithm to interpret the self-titration of the drug delivery. A total of 255 patients receiving intravenous PCA using morphine (1 mg/ml) tested this index by offline analysis from this system. We found the FPD index modeled from a fuzzy modeling algorithm to interpret the self-titration of the drug delivery can show the patients’ dynamic demand and past efforts to overcome the postoperative pain. Moreover, it could become an online system to monitor patients’ demand or intent to treat their pain so these factors could be entered into a patient’s chart along with temperature, blood pressure, pulse, and respiration rates when medical practitioners check the patients.
Index Terms—Fuzzy modeling algorithm, fuzzy pain demand (FPD) index, intelligent analysis system, intent to treat, multilayer hierarchical structure, patient-controlled analgesia (PCA).
I. INTRODUCTION
T
HE need for a reliable and valid tool to measure pain is essential for any clinical practice or trial associated with pain treatment. However, the subjective feeling of pain is extremely hard to quantify [1]–[5]. The current patient-con-trolled analgesia (PCA) method provides the patient with a pain-driven button that activates a pump to administer a bolus dose of analgesic at a fixed time interval (i.e., lockout time). And, the most commonly used measures of pain intensity, including visual analog scales (VASs), numerical rating scalesManuscript received March 11, 2006; revised February 5, 2007. This work was carried out at the National Taiwan University Hospital and Shin Kong Wu Ho-Su Memorial Hospital Shih Lin, Taipei, Taiwan, R.O.C. This work was sup-ported in part by the Taiwan branch of the Abbott Laboratories Services Corpo-ration. Asterisk indicates corresponding author.
J.-S. Shieh is with the Department of Mechanical Engineering, Yuan Ze Uni-versity, Chung-Li Tao Yuan 320, Taiwan, R.O.C. (e-mail: [email protected]. edu.tw).
C.-Y. Dai is with the Department of Mechanical Engineering, National Central University, Chung-Li, Taoyuan 32001, Taiwan, R.O.C. (e-mail: [email protected]).
Y.-R. Wen is with the Department of Anesthesiology, Shin Kong Wu Ho-Su Memorial Hospital, Shin Lin, Taipei, Taiwan, R.O.C. (e-mail: yr.wen@yahoo. com.tw).
*W.-Z. Sun is with the Department of Anesthesiology, College of Medicine, National Taiwan University, No. 7, Chung-Shan South Road, Taipei, Taiwan, R.O.C. (e-mail: [email protected]).
Color versions of one or more of the figures in this paper are available online at http://ieeexplore.ieee.org.
Digital Object Identifier 10.1109/TBME.2007.896584
(NRSs), and verbal rating scales (VRSs) have been shown to have adequate sensitivity to changes in pain associated with treatment across many populations and settings. However, these conventional methods have a number of limitations for measuring pain. First, all these scales require intervention by other people (i.e., medical doctors or nurses) to ask the patient about results, which not only requires excess effort and time, but also may not detect some perceivable changes in pain that might occur just before interventions. This means that the timing for determining the patient’s pain is very difficult to synchronize with the staff asking for their VAS, NRS, or VRS. Secondly, these methods are not responsive to postoperative efforts of the patient. Although these values from clinical eval-uation may be quite similar, the results of pressing of buttons are dramatically different. This means that VASs, NRSs, and VRSs can only show static pain but not dynamic pain, which is related to the accumulated previous efforts. Third, these methods are not practical for online analysis of postoperative pain intensity.
In the search for a useful adjuvant to self-reported pain in-tensity, the PCA device is an important means to develop a re-liable, objective, continuous, and online index. In conventional PCA systems, consenting patients are provided with a hand-held pushbutton and are instructed to trigger the button when they re-quire pain relief. A bolus of constant size of an analgesic drug is given in response to each legitimate pushing of the button. The size of the bolus is set by the medical staff, and there is a “lockout” period following each bolus administration during which time no further bolus can be delivered. Moreover, based on the design of PCA, patients are requested to reduce their pain to a minimum (i.e., VAS ). Thus, all patients are the-oretically maintained at pain-free status in the long run regard-less of their efforts. However, the demand for better pain relief varies remarkably among each individual and it fluctuates with time. Accordingly, these individual and fluctuating demands are stored inside the PCA device to show the different pain pattern of patients related to either analgesic drugs or surgical opera-tions and to present specific characteristics with clinical impli-cations [6], [7]. Hence, how to model this pain pattern to be more objective and reliable in order to continuously monitor this fifth vital sign is the most important aspect of the pain measurement since pain has recently become the “fifth vital sign” to be en-tered into a patient’s chart along with temperature, blood pres-sure, pulse, and respiration rates [8], [9].
Modeling a system is very important because it is related to process characterization and design studies. In the past, it has been thought that a complicated mathematical approach could model a system more accurately. For example, pharmacokinetic and pharmacodynamic models have been applied for modeling 0018-9294/$25.00 © 2007 IEEE
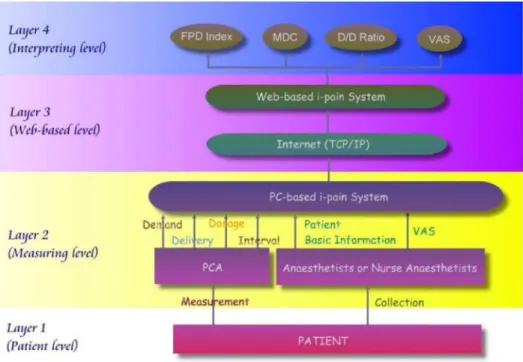
Fig. 1. Multilayer hierarchical structure ofi-pain system.
pain [10], [11]. However, this still has problems when ill-de-fined, complicated, and nonlinear systems are encountered. To solve this problem, fuzzy logic has been applied, as indicated by a recent survey on its use in medicine and healthcare [12]. Fuzzy logic not only accommodates uncertainty by dealing with im-precise, qualitative terms such as low, medium and high, but also provides rules that are easy to understand and modify for discus-sion with experts. Using verbalization or linguistics through in-teraction with the human operator or domain expert, the system can be modeled effectively [13], [14].
The present study had two primary goals. The first was to build a multilayer hierarchical structure for an intelligent anal-ysis system that is able to collect the postoperative records of a PCA device and patients’ basic information uploaded to a Web server PC using standard Web-based TCP/IP. The Web server acts as a database for multimodal electronic patient record in-formation, storing and intelligent analyzing patient data. Under this multilayer hierarchical system, the second goal of this paper was to propose a novel fuzzy pain demand (FPD) index derived from the interval of each bolus of PCA using fuzzy modeling algorithm. We wish to know how the rule base of the FPD index is generated from experts (i.e., anaesthetists) and how this rule base is related to FPD index perturbed by different generated rule bases. We also examine the relationship of FPD index in comparison with conventional parameters, standard mean drug consumption (MDC), demand/delivery ratio (D/D ratio), and clinical observation pain using the visual analog scale (VAS) measured at most pain and rest pain.
II. MULTILAYERHIERARCHICALSTRUCTURE OF THE -PAINSYSTEM
A multilayer hierarchical structure of the -pain (where means information and intelligence) system for data collection and interpretation includes the four levels of patients, measure-ment, Web-based, and interpreting, as shown in Fig. 1.
A. Level 1: Patients (i.e., Patient Level)
This study was approved by the Shin Kong Wu Ho-Su Memo-rial Hospital Ethics Committee. A total of 255 patients classed as American Society of Anesthesiologist physical status 1, 2, or 3 for upper and lower abdominal, spinal, and extremity proce-dures using an analgesic dosage of morphine (1 mg/ml) alone were screened from the -pain database and entered into this study. Patients were excluded from the study if they were mor-bidly obese, unable to understand the use of the PCA or had a history of allergy to morphine. According to routine clinical practice, patients were instructed on the correct use of the PCA pump and given standardized PCA education by a PCA team nurse.
B. Level 2: Measuring Patients’ Demand and Inputting Patients’ Basic Information (i.e., Measurement Level)
PCA has become an established procedure for clinical pain relief. A number of studies have shown the advantages of PCA over regularly scheduled and as-required administration of anal-gesics [15]. The basic concept of the PCA design is to reduce patients’ pain to a minimum (i.e., VAS ) and to maintain them at pain-free status in the postoperative period regardless of their efforts. That is why a significant improvement in satis-faction score was seen after the introduction of an acute pain ser-vice [16]. The PCA machine provides a system where the patient operates a hand-held button interfaced to a microprocessor that drives an infusion pump delivering intravenous analgesic. Fur-thermore, the pain demand and delivery of patients stored inside the PCA device may represent different degrees of pain relief. Hence, the second level is a measuring level that involves an in-strument device (i.e., Abbott AIM Plus pump), which collects all the patient demands and delivers a bolus to the patient when they require pain relief. The collected information is in two modules,
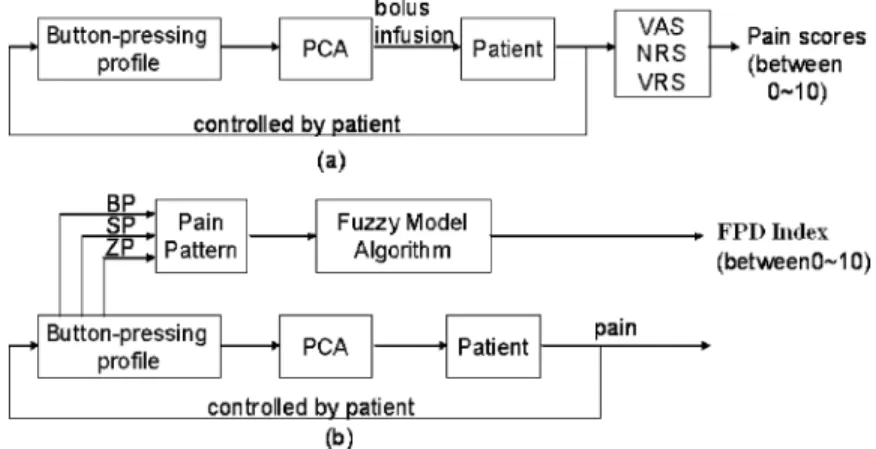
Fig. 2. Block diagram modeling the proposed pain system to interpret the pain measurement: (a) Conventional PCA system; (b) PCA+FPD system.
which provide basic information input and items, and data re-trieving from the PCA machine. A basic module provides the in-formation inputs and items, such as the patient height, weight, and age; doctor’s and nurse’s name; the drug’s name, dosage, and concentration, …, etc. In addition, the clinical observation pain using the VAS was measured at most and rest pain during medical visits by anaesthetists or nurse anaesthetists, as shown in Fig. 1. The data-retrieving module from the PCA machine provides the number of demands and delivery, the bolus volume, the continuous infusion volume, and the total drug consumption for each day. Then, the patients’ basic information and postoper-ative records of the PCA device are transmitted to a PC to create a comprehensive file in the PC-based -pain system.
C. Level 3: Constructing a Web-Based -Pain System to Collect Large Scale Clinical Data (i.e., Web-Based Level)
With the large-scale clinical data input from a PCA device via an RS232 communication port, we constructed a comprehensive Web-based -pain platform to encompass the high-throughput data acquisition. Hence, level 3 is a Web-based level that in-volves all data files, which are merged offline and uploaded to a Web server PC using standard TCP/IP. The Web-based -pain system acts as a database for multimodal electronic pa-tient record information and storing for conventional data anal-ysis (e.g., the MDC, D/D ratio, and VAS) and further intelligent analysis (e.g., the FPD index as shown in Fig. 1).
D. Level 4: Data Mining of the Pain Database (i.e., Interpreting Level)
In order to encompass the high-throughput data analysis to yield evidence-based medical information, the data mining of the database is like an interpreting level that involves inter-preting patients’ pain demand to obtain a delivery pattern, and then interpreting the pain pattern to a FPD index. In addition, the conventional patients’ MDC, D/D ratio, and VAS are also calculated and measured. In order to show the change of all these values, our clinical analysis data are divided into six periods after the start of PCA: period 1 (0–4 h), period 2 (4–8 h), period 3 (8–12 h), period 4 (12–16 h), period 5 (16–20 h), and period 6 (20–24 h).
1) Fuzzy Pain Demand Index Using the Fuzzy Modeling Al-gorithm: Fig. 2 shows the conventional PCA and the PCA+FPD
structure for modeling patient demand or intent to treat their pain via a PCA device. The current PCA method as shown in Fig. 2(a) provides the patient with a pain-driven button that ac-tivates the pump to administer a bolus dose of analgesic at no less than a fixed time interval (i.e., lockout time). In contrast, the proposed PCA+FPD structure in Fig. 2(b) is used to interpret the pain demand (i.e., intent to treat) derived from the button-pressing profile. It does so more accurately and better reflects the patients’ dynamic demand and past efforts to overcome postop-erative pain. According to a previous study of cancer pain relief [17], adequate relief was defined not by asking patients what de-gree of relief they perceived as acceptable, but by their no longer requiring additional opioid doses as rescue medication. There-fore, a more reliable, objective, continuous, and online monitor of dynamic demand for pain relief like the vital signs would be possible from this PCA+FPD structure.
Definition and Calculation of Pain Pattern: To obtain the
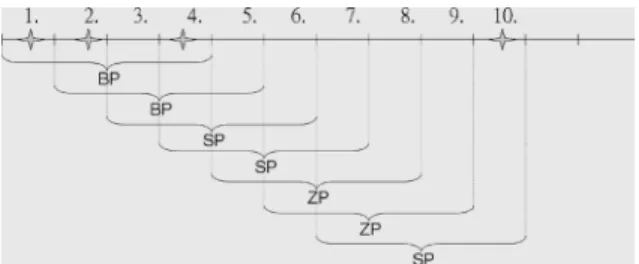
dif-ferent pain pattern from the patient’s button-pressing profile, the big pain (BP), small pain (SP), and zero pain (ZP) levels of pain pattern were defined as follows. In this definition, delivery was the successfully completed demand that was met by administra-tion of the drug, and demand was the request made by a patient by pushing the PCA button.
a) BP: at least two deliveries have been pushed during four lockout intervals;
b) SP: one delivery has been pushed during four lockout intervals;
c) ZP: no delivery has been pushed during four lockout intervals.
Since the four lockout intervals act as a data window segment obtained by breaking the data sequence into equal lengths, the segments of data may overlap or they may be disjoint. However, if the segments are made to overlap, more segments can be taken from the same sequence [18]. In this study, an overlap of 75% has been recommended, as shown in the example of Fig. 3 for a data sequence with ten lockout intervals. Also, the individual pain pattern within four consecutive lockout intervals can be calculated, as shown in the example for Fig. 4. The pain pattern of Fig. 4 is therefore calculated as BP (100%), SP (0%), and ZP (0%) of Fig. 4(a) and BP (25%), SP (50%), and ZP (25%) for Fig. 4(b). Although the total drug consumption is the same
Fig. 4. Example of calculations for pain pattern of same delivery amount (i.e., 3 ml) in different patterns: (a) first pattern and (b) second pattern.
(i.e., 3 ml) during these seven intervals, the pain pattern is totally different.
Fuzzy Pain Demand Index Derived From Pain Pattern According to Fuzzy Modeling Algorithm: Fig. 5 shows a
fuzzy modeling structure for interpretation of the FPD index according to the pain pattern derived from the PCA device. Model rules, membership functions, fuzzy inference engine, and defuzzification are the essential elements in the fuzzy modeling algorithm. To perform fuzzy inference and describe this fuzzy modeling system, we chose the three inputs of BP, SP, and ZP, with the single output of FPD index. In order to fuzzify the inputs and output, the BP, SP, and ZP values were divided into the following nine levels: zero (Z), between zero and small (ZS), small (S), between small and medium (SM), medium (M), between medium and big (MB), big (B), between big and big plus (BB ), and Big plus (B ). And, the FPD index was divided into 11 levels: zero (Z), between zero and small (ZS), small (S), between small and medium (SM), medium (M), between medium and medium plus (MM ), medium plus (M ), between medium plus and big (M B), big (B), between big and big plus (BB ), and big plus (B ). There is no negative fuzzy set because this is not possible for pain intensity. Here we use eleven levels instead of nine levels because this will increase the resolution of FPD index. There are many shapes of possible membership functions, such as triangle, trapezoid, etc., that can be used for the fuzzy modeling [19]. For simplicity, the common triangular shape is used, and a 25% overlap for contiguous fuzzy sets is considered [20] for three inputs (i.e., BP, SP, and ZP) and one output (i.e., FPD index). The inference engine works using the method of Gupta et al. [21], which involve the decomposition of a multi-variable fuzzy system into a set of one-dimensional systems. This method has the following advantages. First, by virtue of
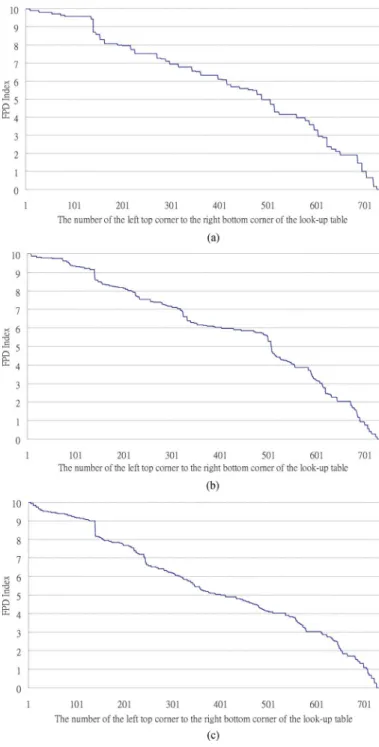
control actions of experts (i.e., medical specialists). Hence, the initial rule-base of 20 rules for FPD was derived from anaes-thetists’ experience as shown in Table I. In addition, the ranges of linguistic level for BP, SP, and ZP are shown in Table II. However, there are still many gray areas that cannot be decided by their rules because the maximal rules for this system are 729 (i.e., 9 9 9). To determine whether or not these 20 rules are enough to interpret the FPD index, we map this rule base of 20 rules to a lookup table for 729 (i.e., 9 9 9) FPD index values, as shown in Fig. 6(a). In this study, the normalized values of FPR index were chosen between . These values were aimed at providing a sensitive pain demand index similar to the VAS value. However, from Fig. 6(a), we see many repeated FPD values with different levels of BP, SP, and ZP. This implies that the rule base of 20 rules may not be sufficient to interpret the FPD index. So, we count the occurrences of dif-ferent FPD values, and then sort them according to descending frequency, as shown in Fig. 7(a). If we choose the number of occurrences as greater or equal to 18 (i.e., two intervals of SP) for these FPD values as shown in Fig. 7(a), there still remain 16 values of FPD satisfying this condition and which need to be further modified to increase the resolution of this lookup table. Hence, after consultation with medical experts an additional 16 fuzzy rules (indicated by “ ” in Table I) were added to the previous rule base so there are 36 rules in the rule base, as shown in Table I. Similarly, we map this rule base of 36 rules to a lookup table for 729 (i.e., 9 9 9) FPD index values, as shown in Fig. 6(b). The overall curve is much smoother than Fig. 6(a). We also count the occurrences of different FPD values and then sort them according to descending frequency, as shown in Fig. 7(b). Now, there are only three values of FPD where the number of the occurrences is greater than or equal to 18. Moreover, if we want to increase the resolution of this lookup table and choose the occurrences’ number greater than or equal to 9 (i.e., one interval of SP) for these FPD values, an additional 19 fuzzy rules [i.e., as shown in Fig. 7(b)] must be added to the rule base of 36 rules, for a total of 55 rules in the rule base. Once again, we map this rule base of 55 rules to a lookup table for 729 (i.e., 9 9 9) FPD index values as shown in Fig. 6(c). Consistently, the overall curve is much smoother than either Fig. 6(a) or (b). Similarity, we count the occurrences of different FPD values, and then sort them according to descending frequency, as shown in Fig. 7(c). Now, there are only seven values of FPD where the number of occur-rences is greater or equal to 9. Through this procedure, we can gradually modify this rule base to provide higher resolution, although more rules added to the rule base will make it more
Fig. 5. Block diagram of fuzzy modeling algorithm to interpret the FPD index derived from a PCA machine.
difficult to handle and detached from the knowledge that the expert applies in his/her routine.
2) Mean Drug Consumption: Dosage was calculated by
summing the total volume of opioid administered during each period and expressing the dose as milliliters per hour.
3) Demand/Delivery Ratio: Demand was the mean number
of times every period that the patient made a request by pushing the PCA button. In addition, delivery was the number of suc-cessfully completed demands, i.e., demands that were met by administration of the drug. Hence, the D/D ratio is the ratio of demands to completed deliveries. A low ratio suggests that the patient’s demands were frequently met by the drug delivery, whereas a high ratio suggests that the patient made frequent de-mands during the lockout interval, when the drug could not be delivered.
4) Visual Analog Scale Score: The visual analog scale is
a 10-cm line with the endpoints labeled “no pain” and “max-imum pain” [25]. The patient marks the line at the distance cor-responding to the intensity of present pain. The routine protocol for analgesia assessment was evaluated two or three times every day by a specially trained nurse with no knowledge of the treat-ment procedure. Each patient rated pain on a VAS graded from 0 (i.e., no pain) to 10 cm (i.e., maximum pain) during rest (i.e., for rest pain) and movement (i.e., for most pain).
5) Statistical Analysis: Kruskal–Wallis test was used to find
statistically significant differences in the median FPD index across perturbations of the anaesthetists’ rule base (i.e., 20, 36, and 55 rules) [26]. For this, was considered statistically significant. Moreover, the Pearson product-moment correlation coefficient [26] was used to assess the relationship of two indexes (i.e., FPD versus MDC, D/D ratio, or VAS).
III. RESULTS
A total of 255 patients (i.e., 146 female and 109 male), with upper and lower abdominal, spinal, and extremity procedures using analgesic dosage of morphine (1 mg/ml) alone were en-tered into the study. The mean age was 56.7(15.4) years, mean height was 154.8(12.8) cm, and mean weight was 58.7(9.9) kg.
In addition, the mean lockout time was 8.0(2.0) min, and mean time for PCA use was 5.2 (2.5) days. Table III shows the data of pain pattern of delivery (i.e., BP, SP, and ZP), FPD index, MDC, D/D ratio, and VAS score at most pain and rest pain.
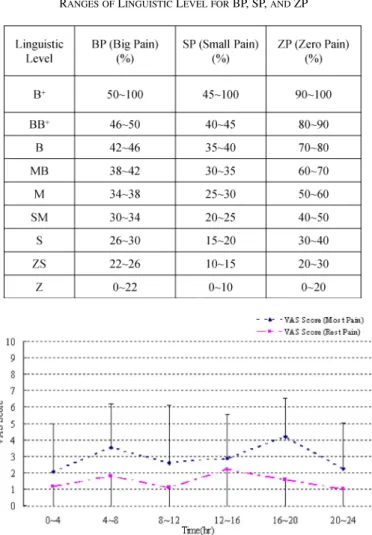
In order to perturb the anaesthetists’ rule base, the 20, 36, and 55 rules were tested in simulation to see what effect they have on the FPD index. Since the rules have been decided, combining all rules produces a three-input and one-output lookup table of 729 possible values (i.e., 9 9 9) for interpreting the FPD index. Fig. 6 is the comparison of FPD index at different rule base of 20, 36, and 55 rules from the upper left corner to the lower right corner of the lookup table. The FPD values in the lookup tables with rule bases of 36 and 55 rules are smoother than the rule base of 20 rules. Although the continuity of a rule base of 55 is smoother than with the rule base of 36 rules, there were no significant differences ( ) using Kruskal–Wallis test for these three rule bases in terms of FPD values at each interval. Obviously, adding more rules into rule base will make it more difficult to handle and detached from the original knowledge that the expert applies in his/her routine. Hence, in this study, we use 36 rules for this rule base in order to overcome the resolution problems without departing too much from the experts’ thought. From a large-scale clinical study via an -pain system, all patients’ pain intensities were assessed on a routine base with respect to their most pain and rest pain. As shown in Fig. 8, we found that most patients’ pain intensity was maintained at a very low level (i.e., VAS ) when the system was prop-erly used and careful titration and instruction. Moreover, the Pearson product-moment correlation coefficients calculated be-tween FPD and VAS score at rest pain and most pain as shown in Fig. 9 was 0.0098 and 0.0027, respectively. Thus, pain in-tensity is not the outcome measurement that the FPD index was designed to correlate. The value of FPD index does not act to predict the pain intensity but rather as a real time index to assess patients’ intention to relieve the pain at any specific time point. In order to compare FPD index with conventional parameters of MDC and D/D ratio, the Pearson product-moment correlation coefficients of FPR index with MDC and D/D ratio were 0.629
and 0.277, respectively. This result indicates that FPD index has some relationship with MDC, but it has a very weak relationship with D/D ratio. That is because the D/D ratio (or VAS) is not en-tirely determined by the nociceptive stimuli but rather as a result of both sensory-discriminative and emotional-cognitive compo-nents of patients’ suffering. Although the FPD index has a mild relationship with MDC (i.e., Pearson coefficient of 0.629), this is because FPD index was derived from four deliveries as shown in Fig. 3. However, in terms of dynamic phenomena to show the patients’ demand or intent to treat their pain, two patients were selected from the -pain system to demonstrate that the FPD index was dramatically different, although MDC was quite similar as shown in Fig. 10. This means the MDC can show only the past cumulative pain efforts, but the FPD index can show the past dynamic efforts to overcome the postoperative pain. Fur-thermore, in order to show that the FPD index can show dynamic
Fig. 6. Comparison of FPD index for different rule bases from the left top corner to the right bottom corner of the lookup table: (a) 20 fuzzy rules; (b) 36 fuzzy rules; and (c) 55 fuzzy rules. (X axis: number of the left top corner to the right bottom corner of the lookup table;Y axis: FPR index).
pain but will be smoothed out when many patients are averaged together, we calculate the FPD index for 1, 10, 50, 100, and 200 patients, as shown in Fig. 11. Theoretically, one may expect a decreasing trend in FPD index from time 0 to 24 h postopera-tively as the intensity of nociceptive input associated with in-cision wound clearly attenuates over time. However, our study demonstrated a biphasic pattern of FPD index, i.e., the curve moves downward over the first 20 hours and increased in the last hours of day. The diurnal cycle and postoperative activities are two major factors contributing to the discrepant results. First, all our patients were recruited under schedule operations, i.e., from
Fig. 7. Comparison of frequency rank order of FPD index values for different rule bases: (a) 20 fuzzy rules; (b) 36 fuzzy rules; and (c) 55 fuzzy rules. (X axis: frequency number of FPD index;Y axis: rank order of FPD index).
8:00 to 16:00. The postoperative time 0 h relatively ranged from afternoon to evening (between 10:00 and 18:00), while the post-operative time 16–20 h was over the midnight and early morning (ranging between 2:00 and 8:00). Therefore, most of our pa-tients spent their night sleeping time between 8 16 h after the operation. As the day–night cycle is well known to modu-late pain intensity, patients’ demand dropped when patients fell asleep and remained inactive in rest. The sensitized wound was left undisturbed during sleep but was profoundly irritated after being woken up in the morning for numerous activities (such as changing dressing, toileting, and nursing). Consequently, their demands to treat pain dropped into sleep hour but resurged at the postoperative 16 24 h as a result of more frequent activi-ties involved. Once again, our results demonstrate that FPD can
TABLE II
RANGES OFLINGUISTICLEVEL FORBP, SP,ANDZP
Fig. 8. VAS score (most and rest pain) during clinical interview of patients (data are plotted means6SD for the VAS scores in this figure).
serve as a sensitive and real-time index to reflect patients’ dy-namic demand and past efforts to overcome the postoperative pain. Hence, the dynamic phenomena of the FPD index is the most beneficial for clinical assessment of pain management be-cause a doctor wants to know the patient’s dynamic pain and past efforts to overcoming pain suffering when checking this patient. Then, the doctor can judge what kinds of settings of PCA parameters (e.g., lockout interval, drug type, and dosage amount) will be suitable to this patient.
IV. DISCUSSION
For this paper, we built up a multilayer hierarchical struc-ture of -pain system to collect the patients’ daily medical in-formation into major server since 2003. At present, a total of eight medical centers in Taiwan have joined to share the -pain system. Cumulative evidence from our preliminary results has yielded fruitful implication that, in turn, can provide immediate feedback for daily practice [27]. With the large scale of clinical data input, we have successfully constructed a comprehensive platform to encompass the high-throughput data acquisition and systemic analysis to yield a series of evidence-based medical evaluations for modern acute pain service.
Fig. 9. Relationship between FPD value and VAS score: (a) most pain and (b) rest pain.
Moreover, using a fixed rule base then modified by calcula-tion of its frequency and rank order via offline analysis from the -pain system, we have demonstrated that fuzzy logic is ap-propriate for modeling the patients’ demand or intent to treat their pain in the postoperative pain via PCA. However, it can be generated by the self-organizing fuzzy modeling (SOFM) al-gorithm [28] according to routine clinical PCA in postopera-tive pain service. The SOFM algorithm is derived from a tradi-tional SOFLC algorithm [29]. It can automatically obtain rules from input and output data and has been applied to controlling
Fig. 10. Comparison of FPD index and MDC during six intervals selected from two patients ofi-pain system: (a) FPD index and (b) MDC.
the depth of anaesthesia via auditory evoked response [30]. Al-though an SOFM can provide wider and more accurate rules for rule base, there is still much room to achieve even better model performance. Not only the fuzzy rule base but also the member-ship functions, the fuzzy inference engine, and defuzzification can be adapted to those of their parameters or methods via arti-ficial intelligence techniques for each individual patient.
Furthermore, from the clinical point of view, not only the VAS but also the side effects must be considered in comparison with the FPD index, MDC, and D/D ratio. Recently, we used an elec-tronic diary using a personal digital assistant (PDA) as the data
Fig. 11. Comparison of FPD index for different numbers of patients: (a) 1; (b) 10; (c) 50; (d) 100; and (e) 200 patients.
collection platform for recording the VAS and side effects when medical doctors or nurses interviewed patients [31]–[33]. This
PDA is like a messenger that not only records VAS scores and side effects but also collects the PCA data via the RS232 port at time of medical staff visits. All data files are merged offline and uploaded to a Web server PC using standard Web-based TCP/IP. Then, further data is mined by a Web server using intelligent analysis and can be obtained in order to determine the relation-ship between PDA (i.e., VAS and side effects) and PCA (i.e., FPD index, MDC , and D/D ratio) data.
In the current study, the FPD index is only calculated from pain delivery via a fuzzy modeling algorithm to interpret the self-titration of the drug delivery. However, since many studies have demonstrated that pain has at least two dimensions, sen-sory and affective, the popularity of scales that represent pain as a single dimension is disturbing [34]. Hence, the trigger of PCA is driven by both sensory-discriminative and emotional-cogni-tive components of patient’s pain. In order to build a more ob-jective and comprehensive approach to assess the need for pain relief or intent to treat (ITT), the demand (i.e., not pain delivery only) for pain relief should be considered in a FPD index. There-fore, using the hybrid intelligent approach to model patients’ demand or intent to treat their pain may provide an alternative method for the recent advocacy that a patient’s pain rating scores be treated as the fifth vital sign.
ACKNOWLEDGMENT
The authors would like to thank the Taiwan branch of the Abbott Laboratories Services Corporation for supporting this research.
REFERENCES
[1] D. C. Turk, T. E. Rudy, and B. A. Sorkin, “Neglected topics in chronic pain treatment outcome studies: Determination of success,” Pain, vol. 53, pp. 3–16, 1993.
[2] R. Melzack, “The McGill pain questionnaire: Major properties and scoring methods,” Pain, vol. 1, pp. 277–299, 1975.
[3] R. Melzack, “The short form McGill pain questionnaire,” Pain, vol. 30, pp. 191–197, 1987.
[4] R. L. Daut, C. S. Cleeland, and R. C. Flanery, “Development of the Wisconsin brief pain questionnaire to assess pain in cancer and other diseases,” Pain, vol. 17, pp. 197–210, 1983.
[5] T. D. Walsh, “Practical problems in pain measurements,” Pain, vol. 19, pp. 96–98, 1984.
[6] R. Ohrbach and S. F. Dworkin, “Five-year outcomes in TMD: Rela-tionship of changes in pain to changes in physical and psychological variables,” Pain, vol. 74, pp. 315–326, 1998.
[7] X. M. Mueller, F. Tinguely, H. T. Tevaearai, J. P. Revelly, R. Chiolero, and L. K. von Segesser, “Pain pattern and left internal mammary artery grafting,” Ann. Thorac. Surg., vol. 70, pp. 2045–2049, 2000. [8] M. McCaffery and C. L. Pasero, “Pain ratings: The fifth vital sign,”
Amer. J. Nurs., vol. 97, no. 2, pp. 15–16, 1997.
[9] M. K. Merboth and S. Barnason, “Managing pain: The fifth vital sign,”
Nurs. Clin. Nor. Amer., vol. 35, no. 2, pp. 375–383, 2000.
[10] M. R. Checketts, C. J. Gilhooly, and G. N. C. Kenny, “Patient-main-tained analgesia with target-controlled alfentanil infusion after cardiac surgery: A comparison with morphine PCA,” Br. J. Anaesthes., vol. 80, pp. 748–751, 1998.
[11] J. S. Shieh, L. W. Chang, M. S. Wang, Y. P. Wang, Y. P. Yang, and W. Z. Sun, “Pain model and fuzzy logic patient-controlled analgesia in shock wave lithotripsy,” Med. Biolog. Eng. Comput., vol. 40, pp. 128–136, 2002.
[12] M. F. Abbod, D. G. von Keyserlingk, D. A. Linkens, and M. Mahfouf, “Survey of utilization of fuzzy technology in medicine and healthcare,”
measures,” Pain, vol. 88, pp. 287–294, 2000.
[18] S. D. Stearns and R. A. David, Signal Processing Algorithms in
MATLAB. Englewood Cliffs, NJ: Prentice-Hall, 1996.
[19] J. Dombi, “Membership function as an evaluation,” Fuzzy Sets Syst., vol. 35, pp. 1–21, 1990.
[20] B. Kosko, Neural Networks and Fuzzy Systems. Singapore: Prentice-Hall Int., 1991.
[21] M. M. Gupta, J. B. Kiszka, and G. M. Trojan, “Multivariable structure of fuzzy control systems,” IEEE Trans. Syst., Man, Cybern., vol. 16, no. 5, pp. 638–656, Sep. 1986.
[22] J. S. Shieh, D. A. Linkens, and J. E. P. Peacock JE, “Hierarchical rule-based and self-organizing fuzzy logic control of anaesthesia,” IEEE
Trans. Syst., Man, Cybern. C, Appl. Rev., vol. 29, no. 1, pp. 98–109,
1999.
[23] J. S. Shieh, D. A. Linkens, and A. J. Asbury, “A hierarchical system of on-line advisory for monitoring and controlling the depth of anaes-thesia using self-organizing fuzzy logic,” Eng. Appl. Artif. Intell., vol. 18, no. 3, pp. 307–316, 2005.
[24] M. Braae and D. A. Rutherford, “Fuzzy relation in a control setting,”
Kybernetes, vol. 7, pp. 185–188, 1978.
[25] E. C. Huskisson, “Visual analogue scales,” in Pain Measurement and
Assessment, R. Melzack, Ed. New York: Raven Press, 1983, pp. 33–37.
[26] S. A. Glantz, Primer of Biostatistics, 6th ed. Singapore: McGraw-Hill, 2005.
[27] J. S. Shieh, L. Y. Chen, Y. R. Wen, J. Y. Chen, and W. Z. Sun, “The relationship of evoked parameters versus VAS and side effects using an evoked pain stimulation (EPS) algorithm,” in Annu. Meeting
Chi-nese Assoc. for The Study of Pain on ‘Advances in Management of In-tractable Pain’, Tainan, Taiwan, R.O.C., Mar. 19–20, 2005, p. 132.
[28] D. A. Linkens, J. S. Shieh, and J. E. Peacock, “Hierarchical fuzzy mod-elling for monitoring depth of anaesthesia,” Fuzzy Sets Syst., vol. 79, pp. 43–57, 1996.
[29] T. J. Procyk and E. H. Mamdani, “A linguistic self-organizing process controller,” Automatica, vol. 15, pp. 15–30, 1979.
[30] M. Elkfafi, J. S. Shieh, D. A. Linkens, and J. E. Peacock, “Fuzzy logic for auditory evoked response monitoring and control of depth of anaes-thesia,” Fuzzy Sets Syst., vol. 100, pp. 29–43, 1998.
[31] A. A. Stone, S. Shiffman, J. E. Schwartz, J. E. Broderick, and M. R. Huskisson, “Patient compliance with paper and electronic diaries,”
Control Clinic. Trials, vol. 24, pp. 182–199, 2003.
[32] T. M. Palermo, D. Valenzuela, and P. P. Stork, “A randomized trial of electronic versus paper pain diaries in children: Impact on compliance, accuracy, and acceptability,” Pain, vol. 107, pp. 213–219, 2004. [33] E. G. VanDenKerkhof, D. H. Goldstein, W. C. Blaine, and M. J.
Rimmer, “A comparison of paper with electronic patient-completed questionnaires in a preoperative clinic,” Anesth. Analg., vol. 101, pp. 1075–80, 2005.
[34] W. C. Clark, J. C. Yang, S. L. Tsui, K. F. Ng, and S. B. Clark, “Uni-dimensional pain rating scales: A multi“Uni-dimensional affect and pain survey (MAPS) analysis of what they really measure,” Pain, vol. 98, pp. 241–247, 2002.
bio-signal processing, critical-care medicine monitoring and control, pain model and control, medical automation, and medical simulator design.
Chun-Yi Dai received the B.Sc. degree in me-chanical engineering from the Yuan Ze University, Taiwan, R.O.C., in 2004 and the M.Sc. degree in mechanical engineering from National Central University, Taiwan, R.O.C., in 2007.
He was a Teaching Assistant in mechanical engi-neering at the National Central University and a Re-search Assistant at Taipei Veterans General Hospital from 2004 to 2005. After that, he was a Research Assistant with the Department of Mechanical Engi-neering at the National Central University from 2005 to 2006, running an orthopedic C-arm navigation system project supported by the National Science Council. His current research interests include medical image, orthopedic navigation system, pain management and control, and artifi-cial intelligence.
Yeong-Ray Wen received the M.D. degree from the Medical School, China Medical University, Taiwan, R.O.C., in 1990.
He completed his resident and subspecialist training in the Department of Anesthesiology, National Taiwan University Hospital, from 1991 to 1995. He became a Postdoctoral Research Fellow in the Sensory Plasticity Laboratory of the Pain Research Center, Department of Anesthesiology, Brigham and Women’s Hospital, Harvard Medical School, Boston, MA, form 2004 to 2005. Currently, he is an attending doctor in the Department of Anesthesiology, Shin-Kong Wu Ho-Su Memorial Hospital, Taipei, Taiwan, R.O.C., where he specializes in clinical anesthesia; pain managements, including postoperative pain and neuropathic pain; and hospice care. He also participates in basic pain research covering the fields of various animal pain models, mechanisms of acupuncture analgesia, spinal nociceptive sensitization, spinal glia activation, and morphine tolerance.
Wei-Zen Sun received the M.D. degree from the College of Medicine in National Taiwan University, Taiwan, R.O.C., in 1984.
He completed his residency training in the De-partment of Anesthesiology at National Taiwan University Hospital from 1986 to 1990 and served as the attending physician thereafter. Currently, he is the Chair and Professor of the Department of Anesthesiology, College of Medicine in National Taiwan University. His research interests in clinical medicine include management of the postoperative pain, neuropathic pain, and cancer pain. He also collaborates with basic research in the rat acupuncture analgesia model, opioid tolerance, and infor-mation systems.
Dr. Sun is currently chairing a national project in medical micro-video-sensor consumer product design.