A system of equations modeling international tourism demand for Taiwan
16
0
0
全文
(2) China). This was an increase of 109,274 over the year before (a growth of 4.18%). Growth trends for major market areas are shown by the arrivals statistics for 2002 as follows: Japan has 986,053 visitors (up 1.53%); U.S.A. has 354,087 visitors (up 4.33%); Singapore has 107,380 visitors (up 10.96%). According to the statistic and analyzed by the Tourism Bureau of R.O.C., the average spending of overseas visitors to Taiwan in 2002 was US$204.15 per person per day. If each visitor stayed in Taiwan for an average of 7.54 nights (according to the statistics by Bureau of Immigration of R.O.C.), each visitor spent 1,539.29 US dollars on average in Taiwan. So the total spending for the whole year amounted to US$4.2 billion (equal to NT$145.1 billion), which rose 5.16% over 2002. Since the foreign exchange earning from tourism in 2002 is estimated at US$4.2 billion, it generates approximately 3.92% of gross domestic product (GDP) more than agriculture. For Taiwan, it can establish the determinants of flows of visitors and can be considered as a source of hard currency. However, in contrast to the tourist sector in the Taiwan economy, little attention was paid to quantitative analysis. Most empirical studies of the international tourism demand in Taiwan are based upon non-causal forecasting techniques (i.e. time series models) in which tourism is analyzed without reference to the factors that affect the behavior of consumer (Tsai et al., 1998). Recognizing the usefulness of these methods for short-term forecasting, the demand models are appropriate to estimate elasticity and analyze the effect of alternative policies (Bakkal, 1991; Loeb, 1982; Summary, 1987; Syriopoulos and Sinclair, 1993; Witt and Martin, 1987). However, an empirical study on international tourism demand for Taiwan using both econometric models and the theory of consumer demand is still absent. So it becomes the motivation of this paper. The goal of this research is to construct an estimated demand function for the international inbound tourist expenditures in Taiwan by using econometric models and the theory of consumer demand. In our research, econometric models for four origin countries are constructed using selected variables. The rest of this paper is organized as follows. In Section II, we provide a brief overview for the methodologies of previous studies. Section III presents an international tourism demand model as well as its the data analysis. Section IV shows the empirical results and their interpretations. Finally, conclusions are given in Section V. II. LITERATURE OVERVIEW ON RECENT METHODOLOGIES Despite the importance of tourism to the world economy, applied economists have not paid too much attention to tourism. Industrial organization analysis is substantially nonexistent and demand-side studies are few. With respect to the latter, the majority of studies on tourism demand relied on single equation model with estimation within a static context (Loeb, 1982; Uysal and Crompton, 1984; Gunadhi and Boey, 1986; Syriopoulos, 1995; Vogt and Wittayakorn, 1998), or on cointegration, error correction and Grange. 2 第五屆全國實證經濟學論文研討會 The 5th Annual Conference of Taiwan's Economic Empirics.
(3) no-causality models with estimation within a dynamic context (Song et al., 2000; Lim and. McAleer, 2001; 2002). The above models lack a strong basis in economic theory. However, the tourism has a vague relationship with the theory of consumer demand, which cannot be used to test the validity of various restrictions on the consumer’s behavior such as symmetry, homogeneity or negativity. In contrast, the system of equation model can be based on economic theory and be used to test these restrictions by using expenditure allocation models such as the Almost Ideal Demand System (AIDS) approach (O’Hagan and Harrison, 1984; Syriopoulos and Sinclair, 1993; Papatheodorou, 1999; Song et al., 2000). The AIDS model consists of a system of equations and is estimated by means of the most recent econometric methods (Song et al., 2000). Therefore, it is appropriate for estimating tourism demand in the form of expenditure shares if tourism demand is defined as expenditure shares rather than visits in the microeconomic foundation of the model. The AIDS approach is particularly useful for cross-price elasticity of demand as compared to the single equation approach. Hence, this research uses the AIDS model to examine the international inbound tourism demand in Taiwan. III A MODEL OF INTERNATIONAL TOURISM DEMAND AND DATA ANALYSIS. The static Almost Ideal Demand System Theory The AIDS is based on the theory of consumer demand to estimate the system of tourism demand equations for the countries under consideration. It involves utility maximization for given prices and a given budget for tourism demand (Deaton and Muellbauer, 1980). Hence, the AIDS model is expressed as follows: n x Wi = α i + ∑ rij ln Pj + β i ln( ) j P. i, j = 1,..., n. ( r ij + r ji ). where rij =. (1). (2). 2. In context of tourism analysis, i is an inbound country among a group of n. The dependent variable Wi represents an inbound country’s i percentage share of tourist expenditure allocated to the set of n inbound countries. pj is tourist price in country j . rij is the parameter on the natural log of tourist price in the j th country. β i is the parameter on the natural log of the per capita expenditure in country i . x is per capita tourist expenditure. Furthermore, P is the weighted price index for inbound countries and defined as n. ln P = α i + ∑ α i ln Pi + j. 1 ∑ ∑ γ ij ln Pi ln Pj 2 i j. i, j = 1,..., n. (3). Hence, the share’s variability in Equation (1) can be explained by tourist price in i and in alternative inbound country j , and the per capita expenditure of inbound countries. 3 第五屆全國實證經濟學論文研討會 The 5th Annual Conference of Taiwan's Economic Empirics.
(4) deflated by price index P . Because the system of equations is nonlinear, which expresses demand as a function of relative prices and real expenditure, it is more difficult to estimate (Green and Alston, 1990). Deaton and Muellbauer(1980)found that the Stone price index provided a good approximation to the true price index as given high positive collinearity of prices and it didn’t affect likelihood ratio tests. Hence, many empirical studies converted a linear system by using the Stone price index ln P * to replace the weighted price index ln P . Stone’s index was expressed as:. ln P * = ∑ wi ln pi. (4). i. According to the investigation of Deaton and Muellbauer (1980), the behavior of consumer demand was found to be sensitive to other goods price variable, except the current variable of prices and expenditure. Therefore, the AIDS model adds exogenous variables of other goods price ( ln p0 ), a time trend ( Trend ) and seasonal variables (D). The static AIDS model of international tourism demand for Taiwan can be rewritten in the following form: 3 n x Wi = α0 + δ 0i Trend+ ∑δ s,i Ds + ∑ rij ln p j + γ i,n+1 ln p0 + βi ln( * ) s =1 j P i, j =1,...,n. (5). where a vector of variables Wi related to the share of tourism expenditure of inbound country vectors is represented as W jap ,t , Wus ,t , W skor ,t , Wsin g ,t 1 . δ 0 and δ s are defined parameters and interpreted as exogenous shifts in trend effect and seasonal effect respectively .. γ i ,n +1 is defined parameter and interpreted as reflecting other goods price shifts (i.e. the absolute change in the expenditure share allocated to commodity i due to a 1% change in the price of other commodity). rij represents the absolute change in the expenditure share allocated to commodity i due to a 1% change in the price of commodity j; β i is defined parameter and represented the absolute change in the i th expenditure share given a 1% change in real per capita expenditure at constant prices. In order to comply with the theoretic properties of the demand theory, the restrictions on parameters imposed as follow. The adding up restriction (implying that all budget shares sum n. to unity) requires that ∑αi =1, i=1. n. ∑γij =0,. i=1. n. ∑βi =0 , ∑ γ ij + γ i , n +1 = 0 , ∑δ0,i = 0 , ∑ δ s ,i = 0 ; the n. i=1. j =1. i. s. homogeneity restriction (implying that relative prices and expenditure has no effect on the purchase of goods and services) requires that. n. ∑ γ ij + γ i , n +1 = 0 ;. the symmetry restriction. j =1. (implying that consumer’s choices are consistency) requires that rij = r ji 1. for all i , j ; the. W jap : the tourist expenditure share of Japan (%). Wus : the tourist expenditure share of U.S.A. (%).. W skor : the tourist expenditure share of South Korea (%). Wsin g : the tourist expenditure share of Singapore (%). 4 第五屆全國實證經濟學論文研討會 The 5th Annual Conference of Taiwan's Economic Empirics.
(5) negativity restriction (implying that a rise in price results in a fall in demand), requiring a condition of negative own-price elasticities for all inbound countries. In Equation (5), the dependent variables are each inbound country’s share of tourist expenditure. The independent variables are the effectively relative prices of tourism in each inbound country, the real per capita expenditure, trend and seasonal variables. The effectively relative price of tourism ( ln pi ) and the real per capita expenditure ( ln( x. p*. ) ) are defined as. follows: CPI i * Ri ln Pi = ln( ln( x. p. TR * ) = ln(. CPI. TAP. ). *1. (6) P. *). where a vector of variables ln Pi related to the effectively relative price of tourism of inbound countries vectors is represented as ln Pjap , ln Pus , ln Pskor , ln Psin g 2 . Ri is the exchange rate (number of currency units of Taiwan required to buy one currency unit of country i ). CPI i is the consumer price index of country i . CPI is the consumer price index of Taiwan. TR is the foreign receipts in Taiwan. TAP is Taiwan’s inbound population about tourism. P* is the Stone price index defined in Equation (4).. Internal Tourism Model The static model is assumed to be an instantaneous adjustment to equilibrium. Therefore, it ignores short-run effect, (i.e. without considering consumer’s habit persistence or costly adjustments). For this reason, we can solve by the dynamic AIDS model, which is to modify static demand functions using the timing of adjustments through behavior of past consumption. The dynamic AIDS model can be separated into two forms. One assumed that current consumption of any given good depends on its own past consumption, current price and income per capita (Klonaris and Hallam, 2003); moreover, it extended past income per capita as well as past price of all goods. The other is to add serial correlation in the error terms of estimable demand function, where the error term of each equation depends on own past consumption and past price of errors of demand equations of all other goods (Anderson and Blundell, 1982; Weissenberger, 1986; Alessie and Kapteyn,1991; and Browning,1991). Therefore, dynamic demand models have been found to be empirically superior to static. In dynamic researches of international tourism, they only depend on their own past. 2. ln Pjap : log of real effective relative price in Japan; log ((CPI Japan/CPI Taiwan)*(Exchange. rate(Taiwan$ per Japan Yen$)). ln Pus : log of real relative price in U.S.A.; log ((CPI U.S.A./CPI Taiwan)*(Exchange rate(Taiwan$ per US$)). ln Pskor log of real relative price in South Korea; log ((CPI South Korea/CPI Taiwan)*(Exchange rate(Taiwan$ per South Korea Won$)). ln Psin g log of real relative price in Singapore ; log ((CPI Japan/CPI Taiwan)*(Exchange rate(Taiwan$ per Singapore$)). 5 第五屆全國實證經濟學論文研討會 The 5th Annual Conference of Taiwan's Economic Empirics.
(6) consumption and past price of all goods and use an unrestricted error correction mechanism (ECM) to estimate both short-run and long-run demand elasticity for tourism demand. However, their methodology does not incorporate economic theory of demand and test various restrictions on the behavior of consumer (Song et al., 2000; Lim and McAleer, 2001; 2002). Therefore, we use a dynamic demand system based on various restriction demand theory of consumer to estimate international tourism demand in Taiwan. From Equation (5), we can rewrite a dynamic system of tourism demand model as: n. n. j. j. ∆Wt = α 0 + θ i ∆Wt −1 + ∑ γ j1 ∆ ln Pjt + ∑ γ j 2 ∆ ln Pjt −1 +γ 1, n +1 ln P0t + γ 2, n +1 ln P0t −1 + β 1 ∆ ln(. n x x x ) + β 2 ∆ ln( * ) t −1 + λ [W − α − ∑ γ j ∆ ln p jt +β ∆ ln( * )]t −1 * t j p p P. (7). 3. + δ 0 Trend t + ∑ δ s D s ,t s =1. where ∆ represents the first difference operator; θ i is a parameter on the difference of tourist consumption share which represents consumer habits of tourism. The parameter λi measures the speed of adjustment towards the long run equilibrium. For example, if λi = 1 , then adjustment is instantaneous. If λi is large or closer to one in absolute value, then there is a rapid adjustment (i.e. the disturbance quickly disappears). On the other hand, if λi is smaller, then the system model is slowly adjustment back to long run equilibrium. By taking the advantage of estimated model parameters in Equation (7), we can compute elasticities of demand. These elasticities, which include the expenditure elasticities and the price elasticities of compensated, are formalated: Expenditure elasticities:. ηi =. βi wi. +1. (8). Compensated own-price elasticities:. ε c ii =. rii + βi − 1 wi. (9). As mentioned above, the compensated own-price elasticities assumed that real expenditures are held constant. Furthermore, the compensated own-price elasticities indicate how 1% change in one destination’s price affects percentage change in its demand. The Data Analysis This study models the foreign demand for tourist in Taiwan in the same way as the demand for any other good or service from abroad. In general, the foreign demand for tourist is measured by using a volume measure (i.e. aggregate quantities of all goods and services consumed by tourists) for example tourist numbers or night; and a value measure (i.e. the aggregate value of tourist consumption) for example tourism expenditure. Among the. 6 第五屆全國實證經濟學論文研討會 The 5th Annual Conference of Taiwan's Economic Empirics.
(7) measures, the tourism expenditure is obtained from two sources: expenditures available from origin countries and receipts available from destination countries. The former source corresponds to expected spending reported at the point of departure in countries of origin. The latter source corresponds to actual spending reported at the point of departure in destination countries. In this research, tourism receipts from inbound countries to Taiwan are used to measure demands as tourist spending on tourism goods and services. The choice of countries for international inbound tourism in Taiwan is using foreign receipts, which have over one-third of all receipts from tourism in 2002. In another word, country-specific data of foreign receipts corresponds to total spending by all types of tourists on tourism goods and services excluding the cost of international transport. We use data set consisting of 4 countries including Japan, Korea, Singapore, and U.S.A for the period from 1991 to 2002. The data sources are obtained from Economic Statistical Databank System of Taiwan’s Computer Center of Ministry of Education. Constant prices have been calculated using 1996 as the base year. Total foreign receipts of tourism in Taiwan and the exchange rate at current market price are obtained from Economic Statistical Databank System. The consumer price index at constant (at 1996 prices) market prices is obtained from Economic Statistical Databank System. The personal tourist expenditure per capita is calculated using Taiwan’s inbound population about tourism, which is obtained from Economic Statistical Databank System. With respect to the static model, it is well known that the value of tourist consumption (demand from abroad) for any good depends on the per capita expenditure of the inbound country, the effectively relative prices, the trend and seasonal variables. Those variables are presented as determinant variables. Estimation Procedure For statistical implementation, a disturbance (error) term will be added at the end of each share equation. We assumed that the error term of each share equation is normal distribution with zero mean and constant variance, and no-serial correlation. Owing to given that the dependent variables are tourism receipts shares, then they sum to unity and imply that the variance–covariance matrix would be singular. Therefore, one of the share equations in the static model is deleted and the equation system can be jointly estimated by using multivariate regression analysis to quantify the relationship between the dependent variable and its determinant variables. Barten (1969) has shown that if disturbances are serially independent, then Maximum Likelihood Method can be used. Furthermore, Zellner’s estimation method has the same asymptotic properties as the maximum likelihood (ML) estimator. Hence, we use Zellner’s (1963) iterative seemingly unrelated regressions (ISUR) approach to estimate the dynamic AIDS model. The adding up restriction is incorporated via deleting one of the. 7 第五屆全國實證經濟學論文研討會 The 5th Annual Conference of Taiwan's Economic Empirics.
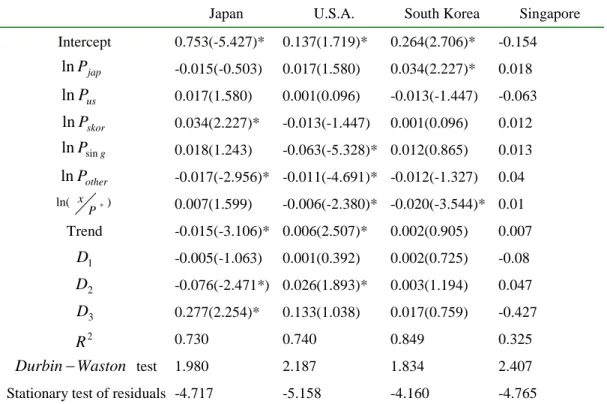
(8) equations from the estimation, and the restrictions of homogeneity and symmetry are included via imposing the required linear constraints on the appropriate parameters. In addition, parameters of the deleted equation are calculated using the adding up restrictions. IV. EMPIRICAL RESULTS Static AIDS An ISUR procedure is employed to estimate Egression (7). This procedure adjusts cross-equation contemporaneous correlation behind the demand system. The results of these equations are presented in Table 1, where the adjusted R 2 of each equation is high except Singapore. Moreover, the diagnostic tests relating to first order serial correlation in residuals cannot be rejected. That is, there exists first order serial correlation in residuals of the system. The standard augmented Dickey Fuller (ADF) test is applied to testing the stationary of residuals, because that residuals are stationary in each regression. The results indicate that all residual in four equations are stationary at 5% significant level. Table 1 shows that Wald. χ 2 chi-squared statistic for homogeneity and symmetry restrictions as given in Equation (7), cannot be rejected. This means that the model is consistent with consumer demand theory. Moreover, diagnostic tests relating to the significance of the trend effect and seasonal effect are jointly equal to zero and strongly rejected, which mean they have the trend effect and seasonal effect. As measured by effectively relative prices in Table 1, the coefficient of South Korea effectively relative price in Japan equation is significant at the 5% level. The coefficient of Singapore effectively relative price in U.S.A. equation is significant and the coefficient of U.S.A. effectively relative price in Singapore equation is significant. Moreover, the coefficient of Japan effectively relative price in South Korea equation is significant at the 5% level. Among the effectively relative prices, the own-price estimates for U.S.A., South Korea and Singapore show a positive relationship with their shares and the own-price estimate for Japan conversely gives a negative relationship. The coefficients for per capita real tourism receipts variables are insignificant negative in Japan and Singapore; but significant negative in U.S.A., and South Korea. The coefficients of trend variables indicate trend effect of tourist consumer on the market shares. The results of trend effect are significant and small, because that effects of Japan, U.S.A., South Korea, and Singapore are -1.5%, 0.6%, 0.2%, and 0.7%, respectively. The coefficients of dummy variables indicate seasonal effect. The results of seasonal effect are most insignificant except third quarter of the year in Japan equation and second quarter of the year in Japan and U.S.A.. However, these significant coefficients have small effects. For example the third quarter effect in Japan equation is 27.7%, which means that the autumn increase in U.S.A. tourism expenditure for Taiwan is more than the increase elsewhere. And the second quarter of the year in Japan and U.S.A. are –7.6% and 2.6%, respectively.. 8 第五屆全國實證經濟學論文研討會 The 5th Annual Conference of Taiwan's Economic Empirics.
(9) Table 1. Iterative seemingly unrelated regression of the static AIDS model of International tourism demand for Taiwan Japan. U.S.A.. South Korea. Singapore. Intercept. 0.753(-5.427)*. 0.137(1.719)*. 0.264(2.706)*. -0.154. ln Pjap. -0.015(-0.503). 0.017(1.580). 0.034(2.227)*. 0.018. ln Pus. 0.017(1.580). 0.001(0.096). -0.013(-1.447). -0.063. ln Pskor. 0.034(2.227)*. -0.013(-1.447). 0.001(0.096). 0.012. ln Psin g. 0.018(1.243). -0.063(-5.328)* 0.012(0.865). 0.013. ln Pother. -0.017(-2.956)* -0.011(-4.691)* -0.012(-1.327). ln( x. P. *. ). Trend. 0.007(1.599). 0.04. -0.006(-2.380)* -0.020(-3.544)* 0.01. -0.015(-3.106)* 0.006(2.507)*. 0.002(0.905). 0.007. D1. -0.005(-1.063). 0.002(0.725). -0.08. D2. -0.076(-2.471*) 0.026(1.893)*. 0.003(1.194). 0.047. D3. 0.277(2.254)*. 0.133(1.038). 0.017(0.759). -0.427. 0.730. 0.740. 0.849. 0.325. 1.980. 2.187. 1.834. 2.407. -5.158. -4.160. -4.765. R2 Durbin − Waston test. Stationary test of residuals -4.717. 0.001(0.392). (lag one period) (lag two periods) (lag one period) (lag one period) System test: values of the system squared error( number of parameters in brackets). χ2. P-value. Serial correlation: AR (1) 35.969. 0.000. Homogeneity. 2.659. 0.045. Symmetry. 6.182. 0.102. Trend effect. 75.833. 0.000. Seasonal effect. 72.242. 0.000. Notes: The Singapore equation is not estimated, which the parameters are calculated from the adding up restriction. The estimates in this table are based on an Iterative Seemingly Unrelated Regression (ISUR). t-statistics are in parentheses. The period of under study is from 1991 to 2002. Pother indicates other effectively relative prices. Tests for the Homogeneity and Symmetry restrictions, trend effect, and seasonal effects are a Wald test distributed χ 2 . ”*” denotes t-value is significance at the 5% levels.. Dynamic AIDS The long-run equilibrium modeling of dynamic AIDS in this study is based on a selected criterion which can be obtained from the above estimation and test reported in Tables 1. The criterion is as follows. First, we look at the fact that the symmetry restriction is accepted but the homogeneity restriction is rejected in static AIDS model. Second, we look at diagnostic 9 第五屆全國實證經濟學論文研討會 The 5th Annual Conference of Taiwan's Economic Empirics.
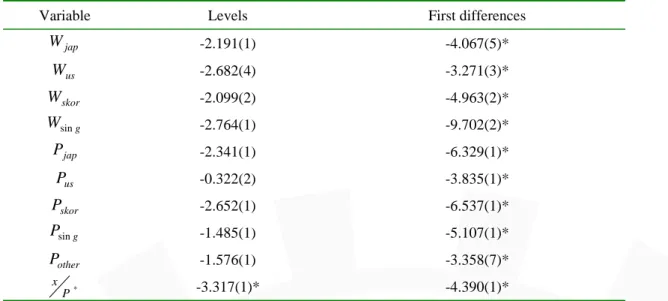
(10) tests of first order serial correlation of residual in the system, which rejected first order serial correlation of residuals in this system. Third, we consider a stationarity relationship between the dependent and explanatory variables, where all residuals are accepted stationary at 5% significant level. Hence, the dynamic AIDS model in this research can solve serial correlation of residuals in static AIDS system. In estimating the dynamic AIDS model, which is given by Equation (9), we first carry out stationary evaluation of the variables in the model. The stationarity of the series (including tourist consumption share of Japan, South Korea, Singapore, and U.S.A; effectively relative prices of tourism in each original country; real per capita expenditure of tourism) are examined using standard augmented Dickey-Fuller (ADF) test. The results are presented in Table 2. In Table 2, unit root tests for each variable are performed on levels and first differences of variables. The ADF statistics in levels of variables exceed the critical value at the 5% significance level, so that all variables in levels are not rejected null hypothesis of a unit root, except per capita real tourism receipts. However, the ADF statistics in first differences of variables are significance at the 5% significance level. Thus, all variables in levels are found to be first difference stationary. That is, all the variables in levels are found to be integrated of order one, or I(1), and their first differences are found to be integrated of order zero, or I(0). Therefore, all variables, by taking first differences, are transformed into stationary series. The dynamic AIDS is estimated using an ISUR procedure, and the results for the system are given in Table 3. The four models of international tourism demand for Taiwan have estimations from regression, which are associated with and without non-economic variables Table 2. Augmented Dickey-Fuller tests Variable. Levels. First differences. W jap. -2.191(1). -4.067(5)*. Wus. -2.682(4). -3.271(3)*. W skor. -2.099(2). -4.963(2)*. Wsin g. -2.764(1). -9.702(2)*. Pjap. -2.341(1). -6.329(1)*. Pus. -0.322(2). -3.835(1)*. Pskor. -2.652(1). -6.537(1)*. Psin g. -1.485(1). -5.107(1)*. Pother. -1.576(1). -3.358(7)*. x. -3.317(1)*. -4.390(1)*. P*. Notes:. τT. denote the Augmented Dickey-Fuller statistics with intercept. Lag lengths are in. parentheses Notation ”*” denotes the statistic value is significance at the 5% levels. The critical vale is taken from MacKinnon.. 10 第五屆全國實證經濟學論文研討會 The 5th Annual Conference of Taiwan's Economic Empirics.
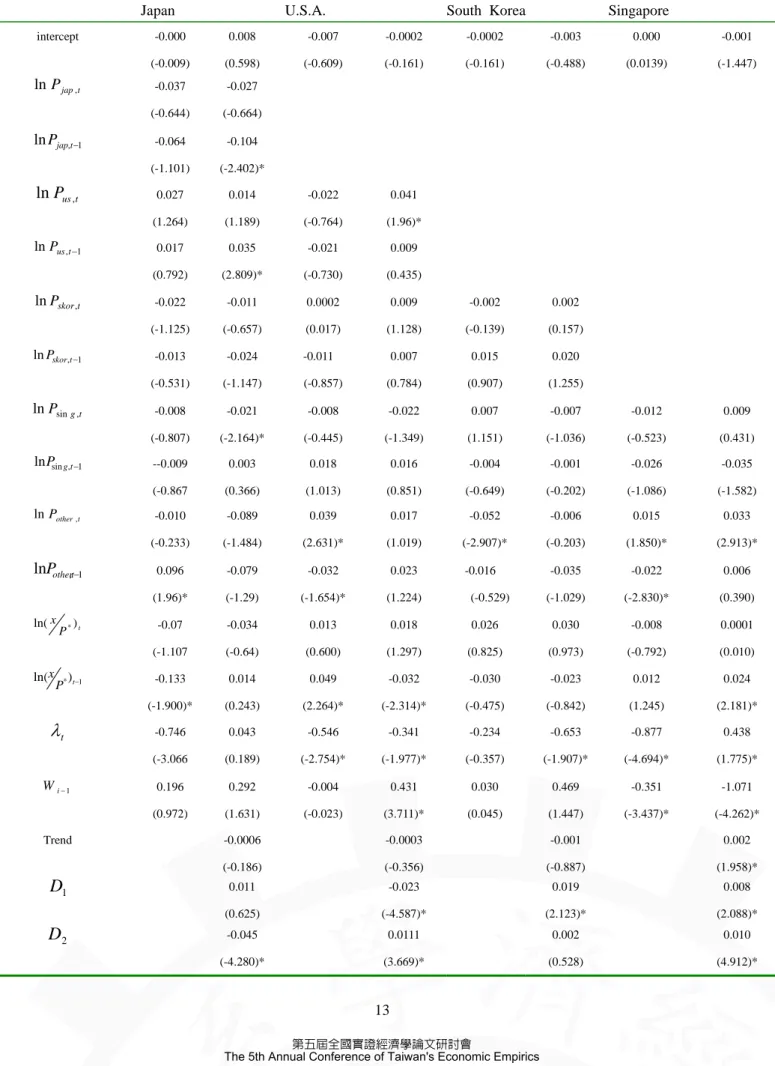
(11) (i.e. trend and dummy variables) in the regressions. In general, the equations including non-economics variables perform better in terms of stationary of the residuals and diagnostic tests. In each equation, the adjusted R 2 is higher when non-economic variables are included. Among these equations including non-economic, the explanatory power of Japan, South Korea, and Singapore regressions are significantly higher than U.S.A. regression. Moreover, the presence of serial correlation can be accepted when non-economic variables are included. The estimates of own-price effectively relative prices for U.S.A., South Korea and Singapore with non-economic variables have positive relationship with their shares. However, Japan with non-economic variables is negative relationship. The coefficient of the error correction terms λ is used to measure the speed of adjustment to restore equilibrium in dynamic AIDS models. The estimated coefficients for U.S.A., South Korea and Singapore regressions with non-economic variables are significant, but for Japan equation is insignificant and positive. Among coefficients of error correction term with non-economic variables (without non-economic variables), U.S.A. (Singapore) equation is higher than others. This implies that their speed of adjustment of restoring to long run equilibrium is rapid. The dynamic modeling indicates that consumer habits to international tourism demand for Taiwan are weak and insignificant, except Singapore equation, if we do not consider non-economic variables. However, if we consider non-economic variables, then consumer habit for U.S.A. (Singapore) equation is significant positive (negative) at 5% significant level. That is, past tourist consumption for U.S.A. (Singapore) partially followed (reversed) their previous consumption behavior. The results of the short run and long-run point elasticities are calculated using Equations (8) and (9) as shown in Table 4. For the purpose of comparison, the estimated long-run point elasticities are also reported. The short-run price elasticity of Japan and U.S.A. is similar to their long-run estimates. As we combine the error correction estimates of Japan and U.S.A. (Table 3) together, we find that the price elasticity of demand of Japan and U.S.A. does not move far from long-run estimate. In contrast, with a low coefficient estimate of the error correction term and a substantial change in the point estimate of the price elasticity, the price elasticity of demand of South Korea and Singapore tends to move substantially away from its long run level for long periods of time. Overall speaking, the international tourism demand of Japan and Singapore is elastic in long run and short run; however, for only the demand of Singapore changes from short-run elasticity to long-run inelasticity. For estimates of the income elasticity of demand, the long-run estimate is close to one for U.S.A., Japan and Singapore, with the estimate for South Korea at the higher level of 1.475. Furthermore, consumer demand of U.S.A. and South Korea is less responsive to a change in income in the short run.. 11 第五屆全國實證經濟學論文研討會 The 5th Annual Conference of Taiwan's Economic Empirics.
(12) V. CONCLUSIONS In calculating the short-run elasticities, we estimated a dynamic error correction form of the AIDS by employing a one lagged dynamic data generating process. The dynamic AIDS model based on selected criteria that included demand theory restrictions and stationarity of the long-run equilibrium relationship. We find that, in the short run, the own-price elasticities are elastic, except South Korea. However, for only the demand of Singapore changes from short-run elastic to long-run inelastic. The income elasticities for U.S.A. and South Korea are not sensitive to a change of income in the short run. In contrast, Japan and Singapore in the short run are sensitive to changes in income and higher than the long run. Using a dynamic generating process one is able to calculate speed of adjustment. Among coefficients of error correction term without non-economic variables (with non-economic variables), Singapore (U.S.A.) equation is higher than others. This implies that their speed of adjustment of restoring to long-run equilibrium is rapid. Among consumer habits effect, U.S.A. (Singapore) equation with non-economic variables is exist and is significantly positive (negative) at 5% significant level. This implies that past tourist consumption of U.S.A. (Singapore) partially followed (reversed) their previous consumption behavior. For the long-run elasticity, price inelasticity of Japan is higher but U.S.A. is smaller. This suggests that an increase in consumer price on Japan (U.S.A.) will instantly (slowly) decrease foreign receipts from Singapore. Hence, analysis of consumer demand both in the long run and in the short run is necessary in foreign receipts effects on tourism.. 12 第五屆全國實證經濟學論文研討會 The 5th Annual Conference of Taiwan's Economic Empirics.
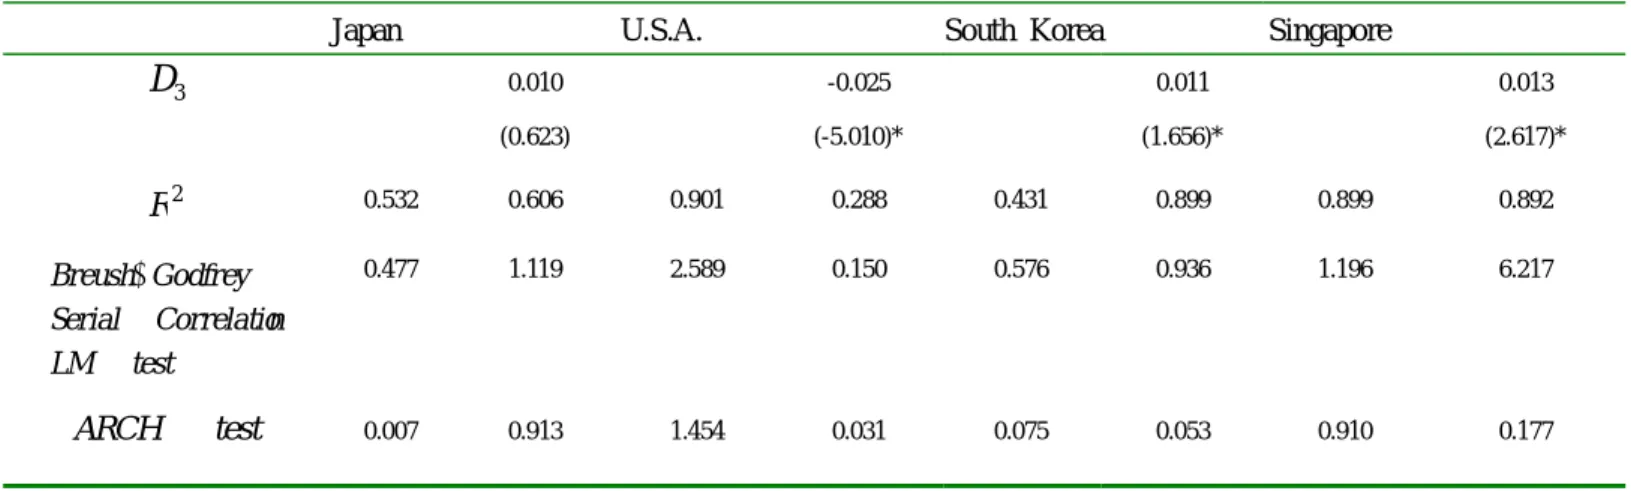
(13) Table 3.Iterative seemingly unrelated regression of the dynamic AIDS model of International tourism demand for Taiwan Japan intercept. ln P jap ,t ln Pjap,t −1. ln Pus ,t ln Pus ,t −1. ln Pskor ,t. ln Pskor,t −1. ln Psin g ,t ln Psin g,t −1. ln Pother ,t. lnPother,t−1 ln( x. ln(x. P*. P*. )t −1. λt W i −1. Trend. D1 D2. )t. U.S.A.. South Korea. Singapore. -0.000. 0.008. -0.007. -0.0002. -0.0002. -0.003. 0.000. -0.001. (-0.009). (0.598). (-0.609). (-0.161). (-0.161). (-0.488). (0.0139). (-1.447). -0.037. -0.027. (-0.644). (-0.664). -0.064. -0.104. (-1.101). (-2.402)*. 0.027. 0.014. -0.022. 0.041. (1.264). (1.189). (-0.764). (1.96)*. 0.017. 0.035. -0.021. 0.009. (0.792). (2.809)*. (-0.730). (0.435). -0.022. -0.011. 0.0002. 0.009. -0.002. 0.002. (-1.125). (-0.657). (0.017). (1.128). (-0.139). (0.157). -0.013. -0.024. 0.007. 0.015. 0.020. (-0.531). (-1.147). (-0.857). (0.784). (0.907). (1.255). -0.008. -0.021. -0.008. -0.022. 0.007. -0.007. -0.012. 0.009. (-0.807). (-2.164)*. (-0.445). (-1.349). (1.151). (-1.036). (-0.523). (0.431). --0.009. 0.003. 0.018. 0.016. -0.004. -0.001. -0.026. -0.035. (-0.867. (0.366). (1.013). (0.851). (-0.649). (-0.202). (-1.086). (-1.582). -0.010. -0.089. 0.039. 0.017. -0.052. -0.006. 0.015. 0.033. (-0.233). (-1.484). (2.631)*. (1.019). (-2.907)*. (-0.203). (1.850)*. (2.913)*. 0.096. -0.079. -0.032. 0.023. -0.035. -0.022. 0.006. (1.96)*. (-1.29). (-1.654)*. (1.224). (-1.029). (-2.830)*. (0.390). -0.07. -0.034. 0.013. 0.018. 0.026. 0.030. -0.008. 0.0001. (-1.107. (-0.64). (0.600). (1.297). (0.825). (0.973). (-0.792). (0.010). -0.133. 0.014. 0.049. -0.032. -0.030. -0.023. 0.012. 0.024. (-1.900)*. (0.243). (2.264)*. (-2.314)*. (-0.475). (-0.842). (1.245). (2.181)*. -0.746. 0.043. -0.546. -0.341. -0.234. -0.653. -0.877. 0.438. (-3.066. (0.189). (-2.754)*. (-1.977)*. (-0.357). (-1.907)*. (-4.694)*. (1.775)*. 0.196. 0.292. -0.004. 0.431. 0.030. 0.469. -0.351. -1.071. (0.972). (1.631). (-0.023). (3.711)*. (0.045). (1.447). (-3.437)*. (-4.262)*. -0.011. -0.016 (-0.529). -0.0006. -0.0003. -0.001. 0.002. (-0.186). (-0.356). (-0.887). (1.958)*. 0.011. -0.023. 0.019. 0.008. (0.625). (-4.587)*. (2.123)*. (2.088)*. -0.045. 0.0111. 0.002. 0.010. (-4.280)*. (3.669)*. (0.528). (4.912)*. 13 第五屆全國實證經濟學論文研討會 The 5th Annual Conference of Taiwan's Economic Empirics.
(14) Table 3.Iterative seemingly unrelated regression of the dynamic AIDS model of International tourism demand for Taiwan (continue) Japan. D3. U.S.A.. South Korea. Singapore. 0.010. -0.025. 0.011. 0.013. (0.623). (-5.010)*. (1.656)*. (2.617)*. R2. 0.532. 0.606. 0.901. 0.288. 0.431. 0.899. 0.899. 0.892. Breush− Godfrey Serial Correlation LM test. 0.477. 1.119. 2.589. 0.150. 0.576. 0.936. 1.196. 6.217. 0.007. 0.913. 1.454. 0.031. 0.075. 0.053. 0.910. 0.177. ARCH. test. Table 4. Estimates of long run and short run demand elasticities. Japan Own-Price. U.S.A. South Korea Singapore. Income. Japan U.S.A. South Korea Singapore. Long Run. Short Run. -1.038. -0.293. (0.008). (0.033). -0.701. -0.898. (0.019). (0.004). -0.998. -0.660. (0.018). (0.186). -0.763. -1.059. (0.024). (0.094). 0.908. 1.037. (0.029). (0.004). 1.138. 0.753. (0.008). (0.015). 1.475. 0.635. (0.279). (0.214). 1.002. 1.702. (0.0002). (0.064). Note: Standard errors are in parentheses.. REFERENCE 1. Alessie, R. and A. Kapteyn, Habit formation, interdependent preferences and demographic effects in the almost idea demand system, Economic Journal, 1991,101, 404-19. 2. Anderson, G. and R. Blundell, Estimation and hypothesis testing in dynamic singular equations systems, Econometrica, 1982, 50, 1559-71. 14 第五屆全國實證經濟學論文研討會 The 5th Annual Conference of Taiwan's Economic Empirics.
(15) 3. Browning, M., A simple nonadditive preference structure for models of household behavior over time, Journal of Political Economy, 1991, 99, 607-37. 4. Barten, A. P. Maximum likelihood estimation of a complete system of demand equations, European Economic Review, 1969, 1, 7–73. 5. Deaton, A., and J. Muellbauer, An almost ideal demand system, American Economic Review, 1980, 70, 513-527. 6. Green, R., and J. M. Alston, Elasticities in AIDS model, American Journal of Agriculture Economics, 1990, 72, 442-45. 7. Gunadhi, H. and C. Boey, Demand elasticities of tourism in Singapore, Tourism Management, 1986, 7, 239-53. 8. Klonaris S., and D. Hallam, Conditional and unconditional food demand elasticities in a dynamic multistage demand system, Applied Economics, 2003, 503-514. 9. Loeb, P. D., International travel to the united states: an econometric evaluation, Annals of Tourism Research, 1982, 9, 7-20. 10. Lim, C., The functional specification of international tourism demand models, Mathematic and Computer in Simulation, 1997, 43, 535-43. 11. Lim, C. and M. McAleer, Cointegration analysis of quarterly tourism demand by Hong Kong and Singapore for Australia, Applied Economics, 2001, 33, 1599- 619. 12. Lim, C. and M. McAleer, A cointegration analysis of annual tourism demand by Malaysia for Australia, Mathematics and Computers in Simulation, 2002, 59, 197–205. 13. O’Hagan, J. and M. Harrison, Market shares of US tourist expenditure in Europe: an econometric analysis, Applied Economics, 1984, 16, 919-31. 14. Papatheodorou, A., The demand for international tourism in the Mediterranean region, Applied Economics, 1999. 31, 619-30. 15. Song, H., P. Romilly and X. Liu, An empirical study of outbound tourism demand in the UK, Applied Economics, 2000, 32, 611-24. 16. Syriopoulos, T. and M.T. Sinclair, An econometric study of tourism demand: the AIDS model of US and European tourism in Mediterranean countries, Applied Economics, 1993, 25, 1541-52. 17. Syriopoulos, T., A dynamic model of demand for Mediterranean tourism, International Review of Applied Economics, 1995, 9, 318-36. 18. Tsai, P.L. and, K. L. Wang, Competitiveness of international tourism in Taiwan: US versus Japanese visitors, Applied Economics, 1998, 30, 631-41. 19. Uysal, M. and J. Crompton, Determinants of demand for international tourism ¯ows to Turkey, Tourism Management, 1984, 5, 288-97. 20. Vogt, M.G. and C. Wittayakorn, Determinants of the demand for Thailand’s exports of tourism, Applied Economics, 1998, 30, 711-15. 21. Weissenberger, E., An intertemporal system of dynamic consumer demand functions,. 15 第五屆全國實證經濟學論文研討會 The 5th Annual Conference of Taiwan's Economic Empirics.
(16) European Economic Review, 1986, 30, 859-91. 22. Witt, S. F., and C. A. Martin, Econometric models for forecasting international tourism demand. Journal of Travel Research, 1987, 25, 23-30. 23. Zellner, A., Estimators for seemingly unrelated regression equations: some exact finite sample results, Journal of American Statistical Associations, 1963, 58, 977-92.. 16 第五屆全國實證經濟學論文研討會 The 5th Annual Conference of Taiwan's Economic Empirics.
(17)
數據
相關文件
(A) South Korea sends the second largest number of students to America.. (B) India has the largest number of international students in
Miroslav Fiedler, Praha, Algebraic connectivity of graphs, Czechoslovak Mathematical Journal 23 (98) 1973,
Microphone and 600 ohm line conduits shall be mechanically and electrically connected to receptacle boxes and electrically grounded to the audio system ground point.. Lines in
When ready to eat a bite of your bread, place the spoon on the When ready to eat a bite of your bread, place the spoon on the under plate, then use the same hand to take the
The min-max and the max-min k-split problem are defined similarly except that the objectives are to minimize the maximum subgraph, and to maximize the minimum subgraph respectively..
Experiment a little with the Hello program. It will say that it has no clue what you mean by ouch. The exact wording of the error message is dependent on the compiler, but it might
implications for further research.. Characteristics of package tours in Europe. Tourists and aboriginal people. The performance-importance response function: Observations
The objective of the present paper is to develop a simulation model that effectively predicts the dynamic behaviors of a wind hydrogen system that comprises subsystems
