Carbon 41 (2003) 2427–2451
Letters to the Editor
C
olumn study of benzene adsorption onto activated carbon
a a ,
*
bC.L. Chuang , P.C. Chiang
, E.E. Chang
a
Graduate Institute of Environmental Engineering, National Taiwan University, Taipei, Taiwan
b
Department of Biochemistry, Taipei Medical University, Taipei, Taiwan Received 3 October 2001; accepted 26 March 2003
Activated carbon, due to its high specific surface area, zene vapor was generated by a VOC generator and carried has been used extensively as an adsorbate for removal of by dehydrated and dehydrocarboned nitrogen gas. The hazardous air pollutants. Most of the column adsorption packed column temperature and benzene temperature were studies were conducted at a specific temperature, and the controlled by a thermostat and maintained constant for major methods of data analysis include: a linear driving 3 h under nitrogen flow before the test. The flow rate was
21
force approximation [1–5], an empirical method [6], and controlled at 1.2 l min by a mass flow meter, and thermodynamic equilibrium [7,8]. The linear driving force benzene concentration was measured by gas chromatog-model considers adsorption as an irreversible reaction. As raphy with a flame ionization detector.
for the thermodynamic equilibrium method, an ideal Based on the Langmuir model, the reaction rate (R) in adsorbed solution theory was based on the thermodynamic the solid phase is equal to the adsorption rate (R ) minusa equivalence of each solute at equilibrium. desorption rate (R ), i.e.:d
These methods suffer from different disadvantages, e.g.
≠u
the thermodynamic equilibrium method considers only
] 5 R 2 R 5 k (1 2 u )C 2 k ua d a d (1)
≠t
adsorption under equilibrium conditions; the linear driving force method accounts for adsorption only, and an
empiri-where u is the saturation coverage of VOC on the cal method is always short of theoretical considerations. In
activated carbon surface, equal to adsorption capacity ( q) reality adsorption is rarely at equilibrium and both
ad-over monolayer capacity ( q ), k is the adsorption rate sorption and desorption occur at the same time. Conse- 0 a
3 21 21
constant (m s mol ), and k is the desorption rate quently, the objective of this investigation is to develop a d
21
constant (s ). The VOC concentration changes in the gas thermodynamic model with a non-linear driving force in
phase include gas phase transport, adsorption and desorp-conjunction with the Langmuir model for predicting the
tion process, assuming no diffusion limitations: effect of operating conditions. The developed model is also
able to predict adsorption isotherms and adsorption
break-≠C ≠C ≠u
through under different conditions, and provide the
de-]5 2 U]2]S (2)
tailed reaction rate changes in the adsorption process. ≠t ≠L ≠t
The original activated carbon (Sorbonorit 3, Norit, The
21
Netherlands) was ground and sieved to obtain 35–45 mesh Here U is the gas velocity (m s ) and L is the length of
23
particles and then was heated to 573 K and treated with adsorption bed (m). S is the exchange factor (g m ) nitrogen gas over 24 h to remove the contaminants. For between solid phase and gas phase, q W/(LA 2 W/r),0 each test, about 2 g of treated activated carbon was packed where W is the weight of activated carbon ( g), A the
2
in a small glass column, about 3 cm in length and 1.5 cm cross-sectional area of adsorption bed (m ), and r the
23
in diameter. The column diameter was designed as over 30 density of activated carbon (g m )
times the particle diameter to prevent the occurrence of Considering the activated carbon bed as a series of short circuiting, and the length of the 3-cm column was continuous-flow stirred tank reactors (CFSTRs), the ad-used to provide a well-developed adsorption zone. Ben- sorption process can be described by the Langmuir iso-therm and adsorption desorption process [9]. Let the activated carbon bed be a n-series (n 550) of CFSTRs, and
*Corresponding author. Fax: 1886-2-2366-1642.
E-mail address: [email protected] (P.C. Chiang). each reaction time in one unit is Dt. In the ith unit, the 0008-6223 / 03 / $ – see front matter 2003 Elsevier Ltd. All rights reserved.
2428 Letters to the Editor / Carbon41 (2003) 2427 –2451
Peterson model were used to simulate the isotherm (303
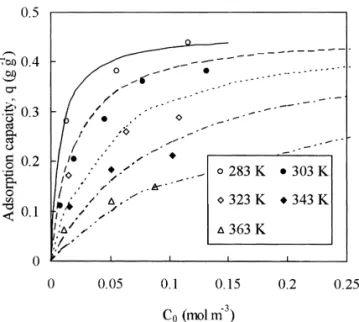
K): q K C 0 L 0 21 ]]] Langmuir: q( g g ) 5 1 1 K CL 0 0.46 3 39.8 3 C0 ]]]]] 5 ; 1 1 39.8 3 C0 2 R 5 0.99 (5) 21 n 0.38 Freundlich: q( g g ) 5 K C 5 0.88 3 CF 0 0 ; 2 R 5 0.97 (6) K CR 0 21 ]] Redlich–Peterson: q( g g ) 5 m B 1 C0 0.44 3 C0 ]]] 5 1.03; 0.03 1 C0
Fig. 1. Simulated breakthrough curve for two models (T 5303 K).
2
R 5 0.99 (7)
concentration change in solid and gas phases can be
determined by a finite difference method as follows: The results indicate that these models can reasonably describe the experimental data. For simplicity, the
Lang-t 1DLang-t t t t t
muir model was chosen to describe the state of adsorption
ui 5u 1 k 1 2 u C 2 k ui
f s
a id
i d ig
Dt (3)and desorption because the numerical model in this study was based on the Langmuir model.
Q Dt
t 1Dt t ]] t t
Ci 5 C 1i DV
s
C 2 Ci i 21d
The best fit was evaluated by the root mean square error,´, between breakthrough concentration, C , and predicted
t t t b
1 2 k 1 2 u C 1 k u S Dt
f
as
id
i d ig
(4) concentration, C9.]]]]
3 21 N
Here Q is the flow rate (m s ), equal to UA 2 UAW/ 1 1
2
3 ´ 5] ]
O
sC 2 C9d (8)b
( rLA); and V is the gas phase volume (m ) in each unit of C
œ
N0 n 51
CFSTR, equal to (LA 2 W/r) /n. Based on the above finite
difference equations and parameters ka and k , the ad-d where N is the measured number in each test.
sorption process in the activated carbon bed can be Fig. 1 presents the simulation result from this model, as
simulated. well as the Wheeler model at 303 K. The results are
In this study the Langmuir, Freundlich and Redlich– summarized in Table 1. Clearly, the model reasonably
T able 1
23 2
Adsorption conditions, parameters and statistics for each adsorption experiment at density of 880 kg m , bed cross-section area of 1.76 cm
21
and unit layer capacity of 460 mg g
Conditions and parameters Unit Run 1 Run 2 Run 3 Run 4 Run 5
Temperature, T K 283 303 323 343 363
Weight of carbon, W g 2.001 2.005 2.001 2.002 2.001
Length of carbon bed, L cm 3.0 3.1 3.0 3.0 3.0
23
Concentration, Co mmol m 116 133 108 103 88
23
Saturation concentration, Csat mol m 2.6 6.3 13.5 25.8 45.1
21
Flow rate, Q l min 1.14 1.20 1.30 1.38 1.46
Retention time**, t s 0.161 0.159 0.141 0.133 0.125
3 21 21
Adsorption rate constant, ka m s mol 0.013 0.016 0.019 0.040 0.060
21 24 24 24 23 22
Desorption rate constant, kd s 1.0310 4.4310 1.7310 5.0310 1.1310
3 21
Equilibrium constant, K m mol 130 36.6 11.7 8.0 5.4
2
Arrhenius equation ln(k ) 5 2 2005 /T 1 2.6; R 5 0.91a 2
ln(k ) 5 2 6.12 /T 1 12.5; R 5 0.99d
Measured number in each test, N – 27 29 41 32 26
Root mean square error, ´ – 0.02 0.03 0.03 0.05 0.04
(LA /Wr)
]]
* Ref. [10] ** t 5 Q
Letters to the Editor / Carbon41 (2003) 2427 –2451 2429
Fig. 2. Curve fitting of adsorption isotherm at different con-ditions.
Fig. 4. Adsorption and desorption rate changes with the progress of adsorption process. (Operation conditions: Table 1).
The adsorption and desorption rate constants can be used to predict the progress of the adsorption process. The trends in Fig. 4 are of course affected by temperature. The Fig. 3. Relationship between adsorption parameters and
tempera-ture. net reaction is also a function of temperature, and when the
adsorption process approaches equilibrium (i.e. R 5 R ),a d the adsorption rate (or desorption rate) at high temperature is higher than at low temperatures, as expected. At higher matches the observed data. As expected, both k and ka d
temperatures (3231, 343 and 363 K; Fig. 4, top), the increase with temperature along with a decrease in
equilib-adsorption rate appears to be slightly higher than the rium constant (K 5 k /k ). Fig. 2 shows the isotherma d
desorption rate. At low temperatures (283 and 303 K; Fig. simulation at various operating conditions.
4, bottom), the adsorption rate is much higher than the Based on the Arrhenius equation, the adsorption
activa-desorption rate. tion energy (E ) and the desorption activation energy (E )a d
21
An activated carbon bed adsorption process is also were determined as 4.0 and 12.2 kcal mol .
Conse-influenced by surface characteristics of the adsorbent and quently, the heat of adsorption of C H6 6 is 28.2 kcal
21
the characteristics and concentration of VOC. In this study, mol . Fig. 3 shows the relationship of rate constants with
the proposed mathematical model could predict the ad-temperature. Also the ln(K ) values of our model and the
sorption isotherms and breakthrough curves under various Langmuir model have a better relationship with 1 /T than
conditions. A high temperature would increase the rates those of the Wheeler model. Our equilibrium constants are
and thus decrease the adsorption efficiency. We not only of the same order of magnitude as those of the Langmuir
show the same trend as the Wheeler and Langmuir models, model.
2430 Letters to the Editor / Carbon41 (2003) 2427 –2451
[5] V ahdat N. Theoretical study of the performance of activated but also extract other pertinent parameters of the
ad-carbon: in the presence of binary vapor mixtures. Carbon sorption process.
1997;35(10):1545–57.
[6] Y oon YH, Nelson JH. Application of gas adsorption kinetics: I. A theoretical model for respirator cartridge service life. R
eferences Am Ind Hyg Assoc J 1984;45(8):509–16.
[7] M yers AL, Valenzuela DP. Computer algorithm and graphical method for calculating adsorption equilibria of gas mixtures. [1] V ahdat N, Swearengen PM, Johnson JS, Priante S, Mathews
J Chem Eng Jpn 1986;19(5):392–6. K, Neihart A. Adsorption capacity and thermal desorption
[8] P igram PJ, Lamb RN, Hibbert DB, Collins RE. Modeling of efficiency of selected adsorbents. Am Ind Hyg Assoc J
the desorption behavior of microporous amorphous hydro-1995;56(1):32–8.
genated carbon films. Langmuir 1994;10(1):142–7. [2] J onas LA, Rehmann JA. The Kinetics of adsorption of
[9] J ørgenson RB, Bjørseth O. Sorption behaviour of volatile organo-phosphorus vapors from air mixtures by activated
organic compounds on material surfaces—the influence of carbon. Carbon 1972;10(6):657–63.
combinations of compounds and materials compared to [3] M alek A, Farooq S. Kinetics of hydrocarbon adsorption on
sorption of single compounds on single materials. Environ activated carbon and silica gel. AIChE J 1997;43(3):761–76.
Int 1999;25(1):17–27. [4] M alek A, Faroog S, Rathor MN, Hidajat K. Effect of
[10] B oublik T, Fried V, Hala E, editors, The vapor pressure of velocity variation due to adsorption–desorption on
equilib-pure substances, New York: Elsevier Scientific Publishing rium data from breakthrough experiments. Chem Eng Sci
Company; 1973, p. 257. 1995;50(4):737–40.
O
ptical properties of pyrolytic carbon deposits deduced from
measurements of the extinction angle by polarized light
microscopy
a ,
*
b b c cE.G. Bortchagovsky
, B. Reznik , D. Gerthsen , A. Pfrang , Th. Schimmel
a
Institute of Semiconductor Physics, pr. Nauki 45, Kiev 03022, Ukraine
b
¨ ¨
Laboratorium f ur Elektronenmikroskopie, Universitat Karlsruhe, 76128 Karlsruhe, Germany
c
¨ ¨
Institut f ur Angewandte Physik, Universitat Karlsruhe, 76128 Karlsruhe, Germany Received 14 April 2003; accepted 12 June 2003
Keywords: A. Pyrolytic carbon; C. Optical microscopy; D. Optical properties
texture degree of such materials for a long time. The The physical properties of graphite are considered a
measured extinction angles A for deposits usually exhibit limit of the crystallization degree of pyrolytic carbon e
values up to A ¯248 [4], which are significantly higher
deposits. For instance, the spacing of basal planes of e
than the value of 16.38 reported for graphite [5] (Fig. 1). graphite is 0.335 nm while for pyrolytic carbon deposits it
As graphite is considered the limit of the texture degree of varies from 0.344 to 0.335 nm as annealing temperature
pyrolytic carbon, the extinction angle of pyrolytic carbon increases [1]. The ratio of p- and s-bonding electronic
is supposed to approach the value for graphite which is states in graphite is 1 / 3, and the deviation from this value
seemingly not the case. can be related to different texture degrees of pyrolytic
This article is devoted to clarifying this apparent con-carbon matrices of infiltrated con-carbon felts [2].
tradiction and presents a short discussion of the physical On the contrary to other optical investigations [3] this
meaning of the A value and its connection to the physical correlation between graphite and pyrolytic carbon is not e
parameters of the systems of interest. valid for polarized light microscopy, which is based on the
To compare values measured for graphite and pyrolytic optical anisotropy of pyrolytic carbon deposits and has
carbon, we have to consider the structure of samples and been a benchmark for the rapid characterization of the
the background of the applied methods. While graphite is a uniaxial crystal with the optical axis along the [001]
*Corresponding author. Tel.: 44-265-9706; fax:
1380-44-265-8342. direction (Fig. 2a), pyrolytic carbon is usually measured
E-mail address: [email protected] (E.G. being deposited on substrates with rotational symmetry
Bortchagovsky). like carbon fibers. Deposited carbon domains have
aro-0008-6223 / 03 / $ – see front matter 2003 Published by Elsevier Ltd. doi:10.1016 / S0008-6223(03)00282-3