Open Access
Software
miRExpress: Analyzing high-throughput sequencing data for
profiling microRNA expression
Wei-Chi Wang
1, Feng-Mao Lin
1, Wen-Chi Chang
1,5, Kuan-Yu Lin
2,3,
Hsien-Da Huang*
1,4and Na-Sheng Lin*
2,3Address: 1Institute of Bioinformatics and Systems Biology, National Chiao Tung University, Hsin-Chu 300, Taiwan, Republic of China, 2Institute
of Biotechnology, National Cheng Kung University, Tainan 701, Taiwan, Republic of China, 3Institute of Plant and Microbial Biology, Academia
Sinica, Nankang, Taipei 11529, Taiwan, Republic of China, 4Department of Biological Science and Technology, National Chiao Tung University,
Hsin-Chu 300, Taiwan, Republic of China and 5Institute of Tropical Plant Science, National Cheng Kung University, Tainan 701, Taiwan, Republic
of China
Email: Wei-Chi Wang - [email protected]; Feng-Mao Lin - [email protected]; Wen-Chi Chang - [email protected]; Kuan-Yu Lin - [email protected]; Hsien-Da Huang* - [email protected]; Na-Sheng Lin* - [email protected]
* Corresponding authors
Abstract
Background: MicroRNAs (miRNAs), small non-coding RNAs of 19 to 25 nt, play important roles in gene regulation in both animals and plants. In the last few years, the oligonucleotide microarray is one high-throughput and robust method for detecting miRNA expression. However, the approach is restricted to detecting the expression of known miRNAs. Second-generation sequencing is an inexpensive and high-throughput sequencing method. This new method is a promising tool with high sensitivity and specificity and can be used to measure the abundance of small-RNA sequences in a sample. Hence, the expression profiling of miRNAs can involve use of sequencing rather than an oligonucleotide array. Additionally, this method can be adopted to discover novel miRNAs.
Results: This work presents a systematic approach, miRExpress, for extracting miRNA expression profiles from sequencing reads obtained by second-generation sequencing technology. A stand-alone software package is implemented for generating miRNA expression profiles from high-throughput sequencing of RNA without the need for sequenced genomes. The software is also a database-supported, efficient and flexible tool for investigating miRNA regulation. Moreover, we demonstrate the utility of miRExpress in extracting miRNA expression profiles from two Illumina data sets constructed for the human and a plant species.
Conclusion: We develop miRExpress, which is a database-supported, efficient and flexible tool for detecting miRNA expression profile. The analysis of two Illumina data sets constructed from human and plant demonstrate the effectiveness of miRExpress to obtain miRNA expression profiles and show the usability in finding novel miRNAs.
Background
MicroRNAs (miRNAs), small non-coding RNAs of 19 to 25 nt, play important roles in gene regulation in both
ani-mals and plants. Generally, miRNAs hybridize to the 3'-untranslated region of mRNA to downregulate gene expression or to induce the cleavage of mRNA and can Published: 12 October 2009
BMC Bioinformatics 2009, 10:328 doi:10.1186/1471-2105-10-328
Received: 9 April 2009 Accepted: 12 October 2009 This article is available from: http://www.biomedcentral.com/1471-2105/10/328
© 2009 Wang et al; licensee BioMed Central Ltd.
This is an Open Access article distributed under the terms of the Creative Commons Attribution License (http://creativecommons.org/licenses/by/2.0), which permits unrestricted use, distribution, and reproduction in any medium, provided the original work is properly cited.
BMC Bioinformatics 2009, 10:328 http://www.biomedcentral.com/1471-2105/10/328
fully hybridize to the transcripts of target genes [1]. Previ-ous studies have suggested that miRNAs are strongly asso-ciated with various cancers and are considered tumor suppressors or oncogenes [2].
In the last few years, high-throughput and robust approaches for monitoring the expression of miRNAs have been used to understand how miRNAs are differen-tially expressed under various conditions. The oligonucle-otide microarray is one method for detecting miRNA expression [3,4]. This approach involves the design of probes based on known miRNAs that are collected in miRBase [5] for miRNA expression profiling studies [6,7]. However, the approach is restricted to detecting the expression of known miRNAs.
Second-generation sequencing is an inexpensive and high-throughput sequencing method. This new method is a promising tool with high sensitivity and specificity and can be used to measure the abundance of small-RNA sequences in a sample. Hence, the expression profiling of miRNAs can involve use of sequencing rather than an oli-gonucleotide array [8-15]. Additionally, this method can be adopted to discover novel miRNAs. Numerous investi-gations have applied second-generation sequencing for discovering and profiling miRNA in various species. Using small-RNA sequencing, Glazov et al. identified 449 novel miRNAs in chicken embryo and 32 differentially expressed known chicken miRNAs in three embryonic small RNA libraries [9]. Morin et al. discovered 104 novel miRNAs in human embryonic stem cells (hESCs) and 171 differentially expressed known human miRNAs in two developmental states [11]. Stark et al. identified 41 novel miRNA genes in Drosophila and used these sequencing reads to validate 28 of the genes [13]. Sunkar et al. identi-fied 23 novel miRNAs in rice and found 82 differentially expressed miRNAs in three libraries [14].
These sequencing schemes can generate millions of short sequences. Profiling miRNA expression levels with sec-ond-generation sequencing technologies involves align-ing sequences to those in a genome. However, alignalign-ing millions of sequences to those in a genome is less efficient than aligning to sequences of known miRNAs. Several previous studies apply next-generation sequencing to pro-file miRNA expression through aligning sequences against genomic sequence [9,11]. In their work, blat [16] or BLAST [17] are utilized to map sequencing reads of small-RNAs to genomic sequence and the sequences of known miRNAs. However, the alignment software, BLAST and blat, cannot efficiently handle a huge scale of short sequences. To solve this problem, other programs, such as RMAP [18], SeqMap[19], ZOOM [20], Maq [21] and SOAP [22], are developed for analyzing numerous short sequences and map millions of short sequences to
genomic sequences. However, these software cannot achieve their capability when the genomic sequences are not available. In detecting miRNA expression, aligning millions of sequencing reads to genomic sequences can be alternatively replaced by aligning these sequencing reads against the sequences of known miRNAs. Consequently, a tool designed for constructing miRNA expression profile through directly aligning millions of short sequences with the sequences of known miRNAs is certainly needed. This work presents a systematic method, miRExpress, for extracting miRNA expression profiles from sequencing reads generated by second-generation sequencing. miREx-press is the first stand-alone package that contains miRNA information from miRBase [5] and efficiently reveals miRNA expression profiles by aligning sequencing reads against the sequences of known miRNAs. This approach can be used to determine miRNA expression profiles when genomic sequences are unavailable and can greatly reduce the time spent aligning sequencing reads and genomic sequences. Furthermore, miRExpress can be used to find novel miRNA candidates by aligning reads with sequences of known miRNAs of various species. We used miRExpress to extract the miRNA expression profiles from two Illumina data sets constructed for the human and a plant species to demonstrate the utility of miRExpress. One data set is a publicly available Illumina sequencing data set of two developmental states of hESCs [11], and the other is a data set we generated in this work using Illu-mina sequencing for three inoculations of Arabidopsis.
Implementation
Figure 1 simplifies the system flow of the construction of miRNA expression profiles with use of miRExpress, which accepts second-generation sequencing data as inputs and constructs miRNA expression profiles by aligning sequences with those of known miRNAs. The second-gen-eration sequencing input data may define one or more experimental conditions. The process by which miREx-press constructs the miRNA exmiREx-pression profiles consists of three steps, as presented in Figure 2. The first step is the preprocessing of raw data obtained by second-generation sequencing. The second step is the alignment of all sequencing reads against those of known mature miRNAs. The third step is the construction of miRNA expression profiles from the results of the alignment.
In the first step, miRExpress merges the identical reads into a unique read and counts each unique read. Then, each unique read is checked to determine whether it con-tains a full or a partial adaptor sequence. In checking the full adaptor sequence, if the adaptor sequence is in the middle and at the beginning of the read, then the read is removed. If the adaptor sequence is at the end of the read, then the adaptor sequence is trimmed from the read
sequence. In checking the partial adaptor sequence, the last bases of the 5' adaptor are used as a probe to match the first bases of the reads. The first bases of the 3' adaptor are used as probes to match the last bases of the reads. If the sequence identities of the matched regions are greater than 70%, these regions are eliminated.
In the second step, each read is aligned with the sequences of known mature miRNAs. The information for known miRNAs was obtained from miRBase (Release 12.0). In miRExpress, the same sequences from different miRNAs are analyzed as a single sequence. For example, ath-miR157a, ath-miR157b and ath-miR157c have the same sequence. The proposed alignment algorithm is based on the Smith-Waterman algorithm and implemented by fol-lowing Single Instruction Multiple Data (SIMD) instruc-tions [23]. When miRExpress is executed on a PC machine
with an SSE3 instruction set, it can compare one miRNA with eight sequencing reads simultaneously. However, the proposed software is multiple-processor ready. For exam-ple, miRExpress can compare one miRNA with 64 sequencing reads simultaneously on a computer with eight processing cores. Another advantage is the use of a lookup table for scoring: the proposed algorithm can fea-sibly change the score or penalty for every pair of nucle-otides as easily as when changing the match score and mismatch of only one nucleotide pair.
In the third step, miRNA expression profiles are con-structed by computing the sum of read counts for each miRNA according to the alignment criteria (e.g., the length of the read equals the length of the miRNA sequence and the identity of the alignment is 100%). System flow of construction of miRNA expression profiles
Figure 1
System flow of construction of miRNA expression profiles. miRExpress can accept second-generation sequencing data and generate miRNA expression profiles by aligning sequences of known miRNAs.
BMC Bioinformatics 2009, 10:328 http://www.biomedcentral.com/1471-2105/10/328
Users can set the cutoff of alignment identity based on their requirements when using miRExpress.
Previous studies suggest that RNA editing occurred in miRNAs can affect their interactions to targets and regu-late the gene expression [24-27]. The sequence reads with high similarity to known miRNAs are valuable for further analysis of RNA editing and mutations occurred in miR-NAs. Hence, we also provide a function in miRExpress which can return the sequence reads that are highly simi-lar to known miRNAs including the nucleotide mismatch information.
Results
Evaluation of Illumina reads
In this work, we used two data sets generated using sec-ond-generation sequencing to evaluate the capability and effectiveness of miRExpress. The first data set was con-structed in this work. The Illumina sequencing reads were generated from three inoculations of Arabidopsis thaliana
(ecotype Columbia-0). For each inoculation, A. thaliana plants were inoculated with water (Mock), Bamboo mosaic virus (BaMV) alone, or co-inoculated with BSF4 satellite BaMV (satBaMV) (BaMV + satBaMV). SatBaMV is a subvi-ral agent and depends on BaMV for replication, encapsi-dation and movement. BaMV and satBaMV were prepared as described [28]. RNA extracted from three inoculated leaves of Arabidopsis was used for sequencing with the Illu-mina Genome Analyzer System following the instruction from FASTERIS which is a biotechnology company head-quartered in Geneva, Switzerland http://www.fast eris.com/.
The other data set consisted of Illumina sequencing reads taken from publicly available data generated by Morin et al. [11]. The sequencing of small-RNA libraries yielded 6,147,718 and 6,014,187 37-nt unfiltered sequencing reads from hESCs (before differentiation) and human cell aggregates called embryoid bodies (hEBs, after differenti-ation), respectively. The hESC sample was harvested by miRExpress system flow has three steps: 1) Preprocessing original Illumina reads; 2) aligning reads with sequences of known miRNAs and 3) constructing miRNA expression profiles
Figure 2
miRExpress system flow has three steps: 1) Preprocessing original Illumina reads; 2) aligning reads with sequences of known miRNAs and 3) constructing miRNA expression profiles.
use of trypsin under non-adherent conditions that induced hESCs to differentiate into cells in all three germ layers and form hEBs. We analyzed the data set to eluci-date the roles of miRNAs in the two developmental states (before and after differentiation) of hESCs.
miRNA expression profiles in Arabidopsis
Arabidopsis miRNA expression profiles were constructed under three experimental conditions based on an
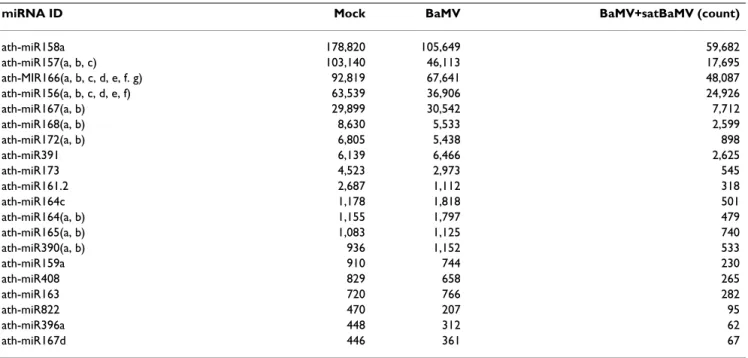
align-ment identity of 100% and a length of reads that equals the length of miRNA sequences. Table 1 presents the top 20 known Arabidopsis miRNAs expressed under three experimental conditions (full data are available in addi-tional file 1). For example, the miRNA with the top expression level (read count) is ath-miR158a, with 178,820, 105,649 and 59,682 read counts for Mock, BaMV and BaMV+satBaMV treatment, respectively. The results suggest that ath-miR158a might play critical roles
Table 2: Top twenty miRNAs expressed in human embryonic stem cells (hESCs) and human embryoid bodies (hEBs) obtained by miRExpress.
miRNA ID Pre-mRNA arm (5-p or 3-p) hESCs hEBs (count)
hsa-mir-25 3-p 24268 15875 hsa-mir-221 3-p 16275 8716 hsa-mir-302b 3-p 15169 8855 hsa-let-7a 5-p 11902 2951 hsa-mir-423 5-p 9844 5538 hsa-mir-302d 3-p 8599 5047 hsa-mir-1 3-p 7421 4051 hsa-mir-320 3-p 5967 2978 hsa-mir-363 3-p 5775 17912 hsa-mir-302a 3-p 5239 3237 hsa-mir-26a 5-p 4892 8530 hsa-mir-744 5-p 4166 1516 hsa-mir-130a 3-p 2334 4798 hsa-mir-340 5-p 2247 7198 hsa-let-7f 5-p 2004 1281 hsa-mir-372 3-p 1388 13653 hsa-mir-423 3-p 1225 560 hsa-mir-331 3-p 1129 434 hsa-mir-199a 3-p 1110 13163 hsa-mir-129 3-p 946 449
Table 1: Top 20 expressed miRNAs in Arabidopsis obtained by miRExpress.
miRNA ID Mock BaMV BaMV+satBaMV (count)
ath-miR158a 178,820 105,649 59,682 ath-miR157(a, b, c) 103,140 46,113 17,695 ath-MIR166(a, b, c, d, e, f. g) 92,819 67,641 48,087 ath-miR156(a, b, c, d, e, f) 63,539 36,906 24,926 ath-miR167(a, b) 29,899 30,542 7,712 ath-miR168(a, b) 8,630 5,533 2,599 ath-miR172(a, b) 6,805 5,438 898 ath-miR391 6,139 6,466 2,625 ath-miR173 4,523 2,973 545 ath-miR161.2 2,687 1,112 318 ath-miR164c 1,178 1,818 501 ath-miR164(a, b) 1,155 1,797 479 ath-miR165(a, b) 1,083 1,125 740 ath-miR390(a, b) 936 1,152 533 ath-miR159a 910 744 230 ath-miR408 829 658 265 ath-miR163 720 766 282 ath-miR822 470 207 95 ath-miR396a 448 312 62 ath-miR167d 446 361 67
BMC Bioinformatics 2009, 10:328 http://www.biomedcentral.com/1471-2105/10/328
in BaMV infection mechanism in Arabidopsis. Conse-quently, it demonstrates that miRExpress facilitates the detection of miRNA expressions from huge data generated by next-generation sequencing of small-RNAs.
miRNA expression profiles in human
The miRNA expression profiles of hESCs were constructed under two experimental conditions, hESCs and hEBs,
based on an alignment identity of 100% and read lengths that equaled the length of miRNAs. Table 2 presents the 20 known human miRNAs expressed under two experi-mental conditions (full data are available in additional file 2). For example, the expression levels (read counts) for hsa-mir-25-3p are 24,268 and 15,875 for hESCs and hEBs, respectively. We demonstrated that the expression The precursor of hsa-mir-putative-1
Figure 3
profiles of known miRNAs discovered by miRExpress can be comparable with the results provided by Morin et al. Discovery of novel human miRNAs by aligning reads to mammalian but not human miRNAs
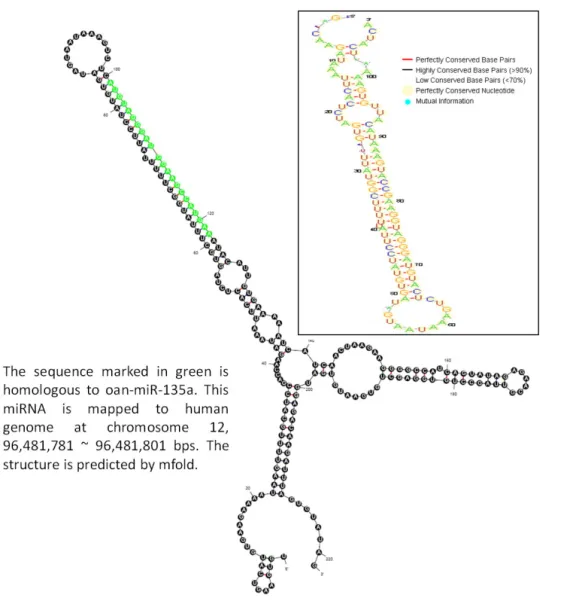
In hESCs and hEBs, 40 and 39 novel miRNAs, respec-tively, were detected by aligning reads that cannot be mapped to known human miRNAs for all mammals, excluding human miRNAs. The alignment criteria are an alignment identity of 100% and read lengths that equal the length of miRNAs. Table 3 gives the top 10 expressed miRNAs belong to different species (full data are available in additional file 3). For example, the most abundant sequencing reads matched to cfa-miR-1839 has 9,332 read counts in hESCs and 8,007 in hEBs. In order to assess the potential miRNA precursor of the putative miRNA, 100 nt 5'-flank and 100 nt 3'-flank are extracted from the matched region after aligning the putative miRNA against
the human genomic sequence. We use mfold [29], which is a software for folding secondary structure from a RNA
Table 3: Top 10 expressed miRNAs in human embryonic stem cells (hESCs) and human embryoid bodies (hEBs) detected by aligning reads with sequences from mammalian (but not human) miRNAs.
miRNA ID hESCs (count) hEBs (count)
cfa-miR-1839 9,332 8,007 oan-miR-135a 299 336 rno-miR-1 69 37 mmu-miR-452 58 52 oan-miR-365* 48 19 mmu-miR-302a* 45 5 rno-miR-135a*, cfa-miR-135 42 68 oan-miR-92b 38 201 oan-miR-301* 17 30 oan-miR-130c 11 37
The precursor of hsa-mir-putative-2 Figure 4
BMC Bioinformatics 2009, 10:328 http://www.biomedcentral.com/1471-2105/10/328
sequence, to obtain putative RNA secondary structures of miRNA precursor. Figure 3 shows the structure of a human putative miRNA (hsa-mir-putative-1), which is homologous to cfa-miR-1839. Another human putative miRNA (hsa-mir-putative-2) homologous to oan-miR-135a is presented in Figure 4. Moreover, we obtain the cross-species sequence information from UCSC Genome Browser [30] to observe the conservation of putative miR-NAs. From the RNA structural logo generated by RNALogo [31], the precursor of hsa-mir-putative-1 shows that it is highly conserved among dog, human, mouse and rat. Similarly, the precursor of hsa-mir-putative-2 is well con-served among six different species, i.e., platypus, opos-sum, human, mouse, chicken and lizard. Consequently, miRExpress can produce abundant sequencing reads of small-RNAs for discovery of novel miRNAs.
Discussion
Experimental errors associated with Illumina sequencing In human and Arabidopsis data sets, the middle 0.12%~0.87% of the sequencing reads have an adaptor
sequence (Table 4). The location of an adaptor in the mid-dle of the reads means that the start location of the full-length adaptor in the read is not the start of the read. For example, the read sequence "AAGCCAAGGTCGTAT-GCCGTCTTCTGCTTGGAAAAA" contains the full-length adaptor from 10 to 30. This condition reveals that Illu-mina sequencing has a few experimental errors, but these do not affect further analysis.
Comparing the results of the application of a trimming adaptor to Arabidopsis obtained by miRExpress with those obtained by other schemes
To confirm the workability of the trimming adaptor method in miRExpress, we compared the use of a trim-ming adaptor with miRExpress to that with another method, FASTERIS. Use of FASTERIS involves three steps. First, the adapter sequence is employed as a probe, which allows for exact match inserts to be identified. Second, if no adapter sequence is found, the last bases of the sequencing reads are probed successively with use of the first bases of the adapter (minimum five bases) until a
Table 4: Number of sequencing reads that have adaptors in the middle.
Experiment Total reads Adaptor in the middle of reads
hESC (human) 6,147,718 33,981
hB (human) 6,014,187 18,546
Mock(Arabidopsis) 5,265,076 46,110
BaMV(Arabidopsis) 4,039,593 22,298
BaMV+satBaMV(Arabidopsis) 2,865,495 3,542
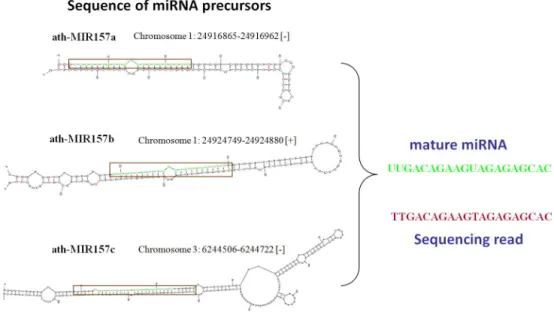
ath-MIR 157a, ath-MIR 157b and ath-MIR 157c are located in various genomic locations but have the same mature sequences Figure 5
ath-MIR 157a, ath-MIR 157b and ath-MIR 157c are located in various genomic locations but have the same mature sequences.
match is found, identifying inserts in up to 30 bases. Third, the remaining reads are searched to identify non-exact matches of the adapter. The first four bases of the adapter are used as a probe. The following properties are adopted to determine the presence of the adapter. Sev-enty-five percent of them must be identical to the adapter sequence. The read number distribution is consistent with the read length distribution (Additional file 4). The corre-lation coefficients of the read number distribution for the miRExpress and FASTERIS methods under Mock, BaMV and BaMV+satBaMV conditions are 0.999, 0.998 and 0.996, respectively. The correlation coefficients of the read count distribution under Mock, BaMV and BaMV+sat-BaMV conditions are 0.997, 0.996 and 0.986, respectively (Additional file 5). The high correlation coefficient indi-cates that the two methods of trimming the adaptor sequence yield the same results for different lengths of reads. Accordingly, the results of applying the trimming adopter sequences with these two methods are mutually consistent.
Comparing miRNA expression profiles produced by miRExpress and alignment of reads to genome sequences in Arabidopsis
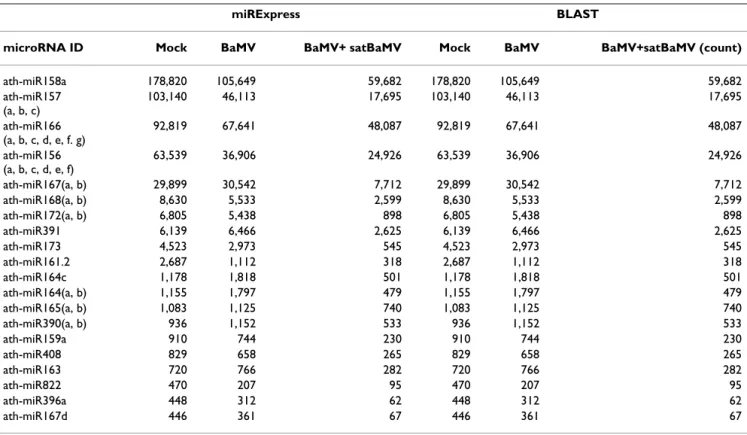
A comparison of miRNA expression profiles generated with miRExpress and the alignment of sequence reads to genome sequences of Arabidopsis suggests that the
con-struction of miRNA expression profiles by aligning sequence reads with those of known miRNAs is equiva-lent to aligning the reads to genome sequences. Table 5 shows the miRNAs with the top 20 expression levels under Mock, BaMV and BaMV+satBaMV treatment by both methods. Additionally, aligning reads with miRNA sequences can reduce the time required to profile the expression of miRNAs to less than that required for align-ing reads with genome sequences (all data are available in additional file 6). These two miRNA expression profiles are both constructed according to the criteria that the alignment identity must be 100% and the length of the reads must equal the length of miRNAs, such that miRNAs that have the same sequence are considered as a single sequence in the detection of the expression levels. For example, ath-miR157a, ath-miR157b and ath-miR157c have the same sequence but are generated from different chromosome loci. These miRNAs are regarded as one sequence in the determination of their expression levels because when reads can perfectly match these miRNAs, the miRNAs to which they belong cannot be identified (Figure 5).
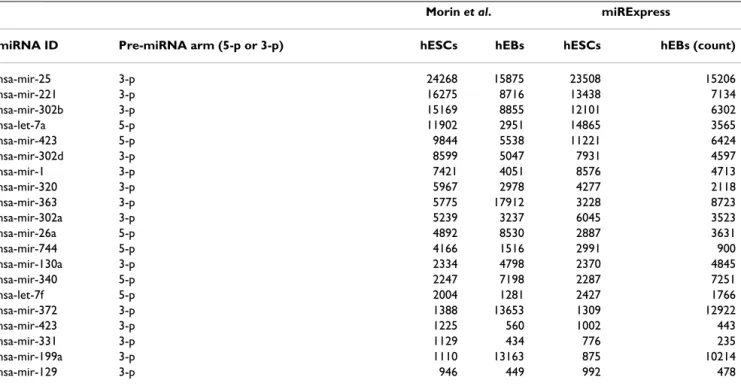
Comparing miRNA expression profiles generated by miRExpress and method of Morin et al
A comparison of miRNA expression profiles produced by miRExpress and Morin et al. for the human species
sug-Table 5: Top 20 expressed miRNAs in Arabidopsis under Mock, BaMV and BaMV+BSF4 conditions obtained with miRExpress and BLAST search of genomic sequences.
miRExpress BLAST
microRNA ID Mock BaMV BaMV+ satBaMV Mock BaMV BaMV+satBaMV (count)
ath-miR158a 178,820 105,649 59,682 178,820 105,649 59,682 ath-miR157 (a, b, c) 103,140 46,113 17,695 103,140 46,113 17,695 ath-miR166 (a, b, c, d, e, f. g) 92,819 67,641 48,087 92,819 67,641 48,087 ath-miR156 (a, b, c, d, e, f) 63,539 36,906 24,926 63,539 36,906 24,926 ath-miR167(a, b) 29,899 30,542 7,712 29,899 30,542 7,712 ath-miR168(a, b) 8,630 5,533 2,599 8,630 5,533 2,599 ath-miR172(a, b) 6,805 5,438 898 6,805 5,438 898 ath-miR391 6,139 6,466 2,625 6,139 6,466 2,625 ath-miR173 4,523 2,973 545 4,523 2,973 545 ath-miR161.2 2,687 1,112 318 2,687 1,112 318 ath-miR164c 1,178 1,818 501 1,178 1,818 501 ath-miR164(a, b) 1,155 1,797 479 1,155 1,797 479 ath-miR165(a, b) 1,083 1,125 740 1,083 1,125 740 ath-miR390(a, b) 936 1,152 533 936 1,152 533 ath-miR159a 910 744 230 910 744 230 ath-miR408 829 658 265 829 658 265 ath-miR163 720 766 282 720 766 282 ath-miR822 470 207 95 470 207 95 ath-miR396a 448 312 62 448 312 62 ath-miR167d 446 361 67 446 361 67
BMC Bioinformatics 2009, 10:328 http://www.biomedcentral.com/1471-2105/10/328
gests that different adaptor trimming schemes might result in different miRNA expression levels. Among 20 expressed miRNAs, the expression levels of hsa-mir-25, hsa-mir-221, hsa-mir-302b, hsa-mir-363, hsa-mir-372, hsa-mir-199a, hsa-mir-302d, hsa-mir-26a, hsa-mir-320, hsa-mir-744, hsa-mir-152 and hsa-let-7e in the study of Morin et al. exceed those obtained with miRExpress, but the levels of 423, hsa-let-7a, 1, 340, 302a, 130a, hsa-let-7f and hsa-mir-122 in the work by Morin et al. are lower than those obtained from miRExpress (Table 6) (full data are availa-ble in additional file 7). The method of trimming the adaptor sequence is largely responsible for the difference in miRNA levels detected. Morin et al. firstly trimmed all reads at 30 nt. The authors then aligned these reads against the genome and identified the longest alignment for every read. Finally, they determined whether the align-ment region of read contained a 3' adaptor. With miREx-press, the trimming adaptor sequence is completed before reads are aligned to miRNA sequences and reads that can perfectly match miRNAs are found. For example, in detecting hsa-mir-372 expression levels, Morin et al. trimmed reads at 30 nt and aligned them with the human genome. The 1~23 bases of some reads were mapped to the hsa-mir-372 chromosome location. The 24~30 bases of these reads were trimmed by the Morin's methods, and the counts of these reads were summed to represent this miRNA expression level. However, the 24~30 bases of some of these reads are not partial adaptor sequences (Fig-ure 6). For instance, the read sequence
"AAAGTGCT-GCGACATTTGAGCGTGCGTGTG" has the same sequence from bases 1 to 23 as that of mir-372, but bases 24~30 of its sequence "GCGTGCG" do not constitute a part of the adaptor sequence "TCGTATGCCGTCTTCTGCTTG". With miRExpress, after the adaptor sequence is trimmed and aligned with miRNA sequences, the perfectly matched read is determined. Therefore, we recommend that the analytical results of miRExpress are closer to the truth than the results generated by Morin's methods. Figure 6 clearly demonstrates that the method of Morin et al. but not miRExpress retains some reads whose 24~30 bases do not form a partial adaptor sequence. Accordingly, the detected expression level of hsa-mir-372 differs between the two methods.
Conclusion
This work develops miRExpress, which is a database-sup-ported, efficient and flexible tool for detecting miRNA expression profile. All previous programs are designed based on mapping high-throughput sequencing reads to genomic sequence. However, miRExpress is the first design for detecting miRNA expression profile from next-generation sequencing reads of small-RNAs without the need of sequenced genomes. The expression profiles of miRNAs can be monitored if the sequenced genomes are not available. Since miRExpress does not align the sequencing reads against genomic sequences, it can greatly reduce the computational time required for the analysis (See additional file 8). Notwithstanding, similar concepts have been demonstrated in prior studies
[32-Table 6: Twenty miRNAs expressed in human embryonic stem cells (hESCs) and human embryoid bodies (hEBs) obtained by miRExpress and Morin et al. methods.
Morin et al. miRExpress
miRNA ID Pre-miRNA arm (5-p or 3-p) hESCs hEBs hESCs hEBs (count)
hsa-mir-25 3-p 24268 15875 23508 15206 hsa-mir-221 3-p 16275 8716 13438 7134 hsa-mir-302b 3-p 15169 8855 12101 6302 hsa-let-7a 5-p 11902 2951 14865 3565 hsa-mir-423 5-p 9844 5538 11221 6424 hsa-mir-302d 3-p 8599 5047 7931 4597 hsa-mir-1 3-p 7421 4051 8576 4713 hsa-mir-320 3-p 5967 2978 4277 2118 hsa-mir-363 3-p 5775 17912 3228 8723 hsa-mir-302a 3-p 5239 3237 6045 3523 hsa-mir-26a 5-p 4892 8530 2887 3631 hsa-mir-744 5-p 4166 1516 2991 900 hsa-mir-130a 3-p 2334 4798 2370 4845 hsa-mir-340 5-p 2247 7198 2287 7251 hsa-let-7f 5-p 2004 1281 2427 1766 hsa-mir-372 3-p 1388 13653 1309 12922 hsa-mir-423 3-p 1225 560 1002 443 hsa-mir-331 3-p 1129 434 776 235 hsa-mir-199a 3-p 1110 13163 875 10214 hsa-mir-129 3-p 946 449 992 478
34], none of them implements user-friendly and rapid analysis software for miRNAs expression profiling. Besides, miRExpress produces abundant sequencing reads, which can be served as basis to discover novel miR-NAs, by aligning the sequencing reads to miRNAs in other species. However, people may argue that using known miRNAs from multiple species might miss some novel miRNAs that are yet to be discovered in any species. To address this issue, the highly expressed reads, which can-not be ancan-notated as the expressed evidences of known miRNAs, are listed in miRExpress output pages. The listed sequencing data can be mapped to the genomic sequences for further analysis. Actually, we plan to extend this func-tion in miRExpress in the near future. Moreover, the anal-ysis of two Illumina data sets constructed from human and plant demonstrate the effectiveness of miRExpress to obtain miRNA expression profiles and show the usability in finding novel miRNAs.
Availability and requirements
miRExpress software was written in C++ programming language and can be executed in 32 or 64 bit Linux machine. The software can be freely downloaded at http:/ /miRExpress.mbc.nctu.edu.tw.
Authors' contributions
HDH and NSL conceptualized the project. WCW and FML designed and built the database and web interface. WCW, FML, WCC, and KYL performed data analysis. NSL and
KYL generate Illumina sequencing reads from Arabidopsis thaliana. HDH, WCW and WCC wrote the draft. All authors tested the database and interfaces. All authors read and approved the final manuscript.
Additional material
Additional file 1
miRNA expressions profile in Arabidopsis. Arabidopsis miRNA
expres-sion profile in three experimental conditions
Click here for file
[http://www.biomedcentral.com/content/supplementary/1471-2105-10-328-S1.XLS]
Additional file 2
miRNA expressions profile in human embryonic stem cells. Human
embryonic stem cells miRNA expression profile in two experimental con-ditions
Click here for file
[http://www.biomedcentral.com/content/supplementary/1471-2105-10-328-S2.XLS]
Additional file 3
Novel miRNA candidate expression profiles in human embryonic stem cells. Using cross-species known miRNAs to construct novel miRNA
can-didate expression profiles in human embryonic stem cells
Click here for file
[http://www.biomedcentral.com/content/supplementary/1471-2105-10-328-S3.XLS]
Trimming adaptor sequences by Morin et al. and miRExpress methods yields different detected miRNA expression levels Figure 6
Trimming adaptor sequences by Morin et al. and miRExpress methods yields different detected miRNA expression levels.
BMC Bioinformatics 2009, 10:328 http://www.biomedcentral.com/1471-2105/10/328
Acknowledgements
The authors thank the National Science Council of the Republic of China for financially supporting this research under Contracts No. NSC 98-2311-B-009-004-MY3 and NSC 98-2627-B-009-005. Special thanks to the National Research Program for Genomic Medicine (NRPGM), Taiwan, for financial support. This work was also supported in part by MOE ATU. Fund-ing to pay the Open Access publication charges for this article was provided by the National Science Council of the Republic of China and MOE ATU.
References
1. He L, Hannon GJ: MicroRNAs: small RNAs with a big role in
gene regulation. Nat Rev Genet 2004, 5(7):522-531.
2. Esquela-Kerscher A, Slack FJ: Oncomirs - microRNAs with a role
in cancer. Nat Rev Cancer 2006, 6(4):259-269.
3. Davison TS, Johnson CD, Andruss BF: Analyzing micro-RNA
expression using microarrays. Methods Enzymol 2006, 411:14-34.
4. Liu CG, Spizzo R, Calin GA, Croce CM: Expression profiling of
microRNA using oligo DNA arrays. Methods 2008, 44(1):22-30.
5. Griffiths-Jones S, Saini HK, van Dongen S, Enright AJ: miRBase:
tools for microRNA genomics. Nucleic Acids Res 2008:D154-158.
6. Porkka KP, Pfeiffer MJ, Waltering KK, Vessella RL, Tammela TL, Visa-korpi T: MicroRNA expression profiling in prostate cancer.
Cancer Res 2007, 67(13):6130-6135.
7. Zhao JJ, Hua YJ, Sun DG, Meng XX, Xiao HS, Ma X: Genome-wide
microRNA profiling in human fetal nervous tissues by oligo-nucleotide microarray. Childs Nerv Syst 2006, 22(11):1419-1425.
8. Fahlgren N, Howell MD, Kasschau KD, Chapman EJ, Sullivan CM, Cumbie JS, Givan SA, Law TF, Grant SR, Dangl JL, et al.:
High-throughput sequencing of Arabidopsis microRNAs: evidence for frequent birth and death of MIRNA genes. PLoS ONE 2007, 2(2):e219.
9. Glazov EA, Cottee PA, Barris WC, Moore RJ, Dalrymple BP, Tizard ML: A microRNA catalog of the developing chicken embryo
identified by a deep sequencing approach. Genome Res 2008, 18(6):957-964.
10. Margulies M, Egholm M, Altman WE, Attiya S, Bader JS, Bemben LA, Berka J, Braverman MS, Chen YJ, Chen Z, et al.: Genome
sequenc-ing in microfabricated high-density picolitre reactors. Nature
2005, 437(7057):376-380.
11. Morin RD, O'Connor MD, Griffith M, Kuchenbauer F, Delaney A, Pra-bhu AL, Zhao Y, McDonald H, Zeng T, Hirst M, et al.: Application
of massively parallel sequencing to microRNA profiling and discovery in human embryonic stem cells. Genome Res 2008, 18(4):610-621.
12. Rajagopalan R, Vaucheret H, Trejo J, Bartel DP: A diverse and
evo-lutionarily fluid set of microRNAs in Arabidopsis thaliana. Genes Dev 2006, 20(24):3407-3425.
13. Stark A, Kheradpour P, Parts L, Brennecke J, Hodges E, Hannon GJ, Kellis M: Systematic discovery and characterization of fly
microRNAs using 12 Drosophila genomes. Genome Res 2007, 17(12):1865-1879.
14. Sunkar R, Zhou X, Zheng Y, Zhang W, Zhu JK: Identification of
novel and candidate miRNAs in rice by high throughput sequencing. BMC Plant Biol 2008, 8:25.
15. Yao Y, Guo G, Ni Z, Sunkar R, Du J, Zhu JK, Sun Q: Cloning and
characterization of microRNAs from wheat (Triticum aesti-vum L.). Genome Biol 2007, 8(6):R96.
16. Kent WJ: BLAT--the BLAST-like alignment tool. Genome Res 2002, 12(4):656-664.
17. Altschul SF, Madden TL, Schaffer AA, Zhang J, Zhang Z, Miller W, Lip-man DJ: Gapped BLAST and PSI-BLAST: a new generation of
protein database search programs. Nucleic Acids Res 1997, 25(17):3389-3402.
18. Smith AD, Xuan Z, Zhang MQ: Using quality scores and longer
reads improves accuracy of Solexa read mapping. BMC Bioin-formatics 2008, 9:128.
19. Jiang H, Wong WH: SeqMap: mapping massive amount of
oli-gonucleotides to the genome. Bioinformatics 2008, 24(20):2395-2396.
20. Lin H, Zhang Z, Zhang MQ, Ma B, Li M: ZOOM! Zillions of oligos
mapped. Bioinformatics 2008, 24(21):2431-2437.
21. Li H, Ruan J, Durbin R: Mapping short DNA sequencing reads
and calling variants using mapping quality scores. Genome Res
2008, 18(11):1851-1858.
22. Li R, Li Y, Kristiansen K, Wang J: SOAP: short oligonucleotide
alignment program. Bioinformatics 2008, 24(5):713-714.
23. Farrar M: Striped Smith-Waterman speeds database searches
six times over other SIMD implementations. Bioinformatics
2007, 23(2):156-161.
24. Amariglio N, Rechavi G: A-to-I RNA editing: a new regulatory
mechanism of global gene expression. Blood Cells Mol Dis 2007, 39(2):151-155.
25. Das AK, Carmichael GG: ADAR editing wobbles the microRNA
world. ACS Chem Biol 2007, 2(4):217-220.
26. Habig JW, Dale T, Bass BL: miRNA editing--we should have
ino-sine this coming. Mol Cell 2007, 25(6):792-793.
27. Kawahara Y, Megraw M, Kreider E, Iizasa H, Valente L, Hatzigeorgiou AG, Nishikura K: Frequency and fate of microRNA editing in
human brain. Nucleic Acids Res 2008, 36(16):5270-5280.
Additional file 4
Read number distributions between miRExpress and Fasteris.
Compar-ison of read number distributions obtained using miRExpress and Fasteris. The correlation coefficients of read number distribution in Mock, BaMV and BaMV+BSF4 are 0.999, 0.998 and 0.996, respectively.
Click here for file
[http://www.biomedcentral.com/content/supplementary/1471-2105-10-328-S4.PNG]
Additional file 5
Read count distributions between miRExpress and Fasteris.
Compari-son of read count distributions obtained using miRExpress and Fasteris. Correlation coefficients of read number distribution in Mock, BaMV and BaMV+BSF4 are 0.997, 0.996 and 0.986, respectively.
Click here for file
[http://www.biomedcentral.com/content/supplementary/1471-2105-10-328-S5.PNG]
Additional file 6
Compare miRNA expressions profile in Arabidopsis between miREx-press and aligning reads to genome. Compare Arabidopsis miRNA
expression profile in three experimental conditions by different methods. One is miRExpress. Another is aligning sequence to genome.
Click here for file
[http://www.biomedcentral.com/content/supplementary/1471-2105-10-328-S6.XLS]
Additional file 7
miRNA expressions profile in human embryonic stem cells between miRExpress and Morin et al. Compare human embryonic stem cell
miRNA expression profile in two experimental conditions by different methods. One is miRExpress. Another is Morin et al.
Click here for file
[http://www.biomedcentral.com/content/supplementary/1471-2105-10-328-S7.XLS]
Additional file 8
Spending time in constructing miRNA expression profiles between miRExpress and blast. The data sets of three experimental conditions in
Arabidopsis are used to compare spending time in constructing miRNA expression profiles between miRExpress and blast.
Click here for file
[http://www.biomedcentral.com/content/supplementary/1471-2105-10-328-S8.XLS]
Publish with BioMed Central and every scientist can read your work free of charge "BioMed Central will be the most significant development for disseminating the results of biomedical researc h in our lifetime."
Sir Paul Nurse, Cancer Research UK Your research papers will be:
available free of charge to the entire biomedical community peer reviewed and published immediately upon acceptance cited in PubMed and archived on PubMed Central yours — you keep the copyright
Submit your manuscript here:
http://www.biomedcentral.com/info/publishing_adv.asp
BioMedcentral 28. Lin NS, Lee YS, Lin BY, Lee CW, Hsu YH: The open reading frame
of bamboo mosaic potexvirus satellite RNA is not essential for its replication and can be replaced with a bacterial gene. Proc Natl Acad Sci USA 1996, 93(7):3138-3142.
29. Zuker M: Mfold web server for nucleic acid folding and
hybrid-ization prediction. Nucleic Acids Res 2003, 31(13):3406-3415.
30. Kuhn RM, Karolchik D, Zweig AS, Wang T, Smith KE, Rosenbloom KR, Rhead B, Raney BJ, Pohl A, Pheasant M, et al.: The UCSC
Genome Browser Database: update 2009. Nucleic Acids Res
2009:D755-761.
31. Chang TH, Horng JT, Huang HD: RNALogo: a new approach to
display structural RNA alignment. Nucleic Acids Res
2008:W91-96.
32. Creighton CJ, Nagaraja AK, Hanash SM, Matzuk MM, Gunaratne PH:
A bioinformatics tool for linking gene expression profiling results with public databases of microRNA target predic-tions. RNA 2008, 14(11):2290-2296.
33. Reid JG, Nagaraja AK, Lynn FC, Drabek RB, Muzny DM, Shaw CA, Weiss MK, Naghavi AO, Khan M, Zhu H, et al.: Mouse let-7 miRNA
populations exhibit RNA editing that is constrained in the 5'-seed/cleavage/anchor regions and stabilize predicted mmu-let-7a:mRNA duplexes. Genome Res 2008, 18(10):1571-1581.
34. Creighton CJ, Reid JG, Gunaratne PH: Expression profiling of
microRNAs by deep sequencing. Brief Bioinform 2009, 10(5):490-497.