Corporate Governance and Long-Run Performance of Equity Issues:
The Role of Foreign Ownership in Taiwan
Yenn-Ru Chen*, Jeng-Ren Chiou, Ting-Kai Chou, Ming-Sian Syue
Department of Accountancy and Graduate Institute of Finance and Banking, National Cheng Kung University, Taiwan
Accepted 10 June 2008 Abstract
It is widely argued that foreign shareholding is a mechanism for improving corporate governance in emerging markets. We provide the evidence of the monitoring benefits of foreign ownership of equity issues, a setting where we argue the effects of monitoring are likely to be important. We analyze the relationship between foreign ownership and stock price, as well as operating performance following public equity issues, by using a sample of Taiwanese firms conducting seasoned equity offerings (SEOs) from 1991 to 2002. Empirical results show that post-issue stock returns and changes in operating performance are positively and significantly related to the post-issue level of foreign ownership. The effects of domestic institutional investors such as family and business affiliations are insignificant. We empirically exclude the argument that the findings are due to sophisticated investment strategies or momentum propensity of foreign investors. To our knowledge, this result has not been previously documented.
Keywords: Corporate governance, seasoned equity offerings, long-run performance, foreign
ownership
1. Introduction1
The literature documents declining long-run stock performance (Loughran and Ritter, 1995; Spiess and Affleck-Graves, 1995; Ritter and Welch, 2002) and poor operating performance (Hansen and Crutchley, 1990; Loughran and Ritter, 1997) following equity offerings. McLaughlin et al. (1996) suggest that the poor operating performance is a result of the agency problem of free cash flows, which is mostly observed in cash-rich firms (Jensen, 1986), and equity offerings is the major infusion of company capital. Firms with effective corporate governance have fewer agency problems of free cash flows (Richardson, 2006), and managers in these firms are less likely to misallocate and overspend corporate resources. Thus, ineffective corporate governance may explain the negative long-run financial performance after equity issues.
The literature indicates that corporate structure and the governance mechanisms in many countries, especially in emerging markets, are very different from those in the US and UK (La Porta et al., 1999; Claessens et al., 2000). In Asia, for example, company ownership is relatively concentrated and companies are more likely to be controlled by certain groups or families. The controlling shareholders actively participate in business operations through active board involvement and management appointments. Thus, agency problems mainly occur between inside controlling shareholders and outside minority shareholders. Through
cross-holding and pyramid structures, controlling shareholders enjoy more votes than their ownership and thus have an incentive to pursue their own benefits at the expense of atomistic outside shareholders (Shleifer and Vishny, 1997).
Therefore, outside institutional investors are critical in mitigating managerial opportunism or value expropriation by insiders. Dahlquist and Robertsson (2001) argue that the role of foreign investors essentially resemble that of institutional investors. We posit that foreign ownership can better explain a firm’s performance after equity issues for two reasons. First, by holding company shares, foreign investors have an incentive to monitor managerial actions regarding capital spending. Second, foreign investors are usually less associated with corporate insiders than domestic institutional investors, and thus monitor insiders more independently and effectively, suggesting a positive relation between their ownership and post-issue performance.
The literature suggests that the ownership of Taiwanese corporations is generally concentrated in the hands of some families or groups. These controlling shareholders possess more control than their ownership via cross-holding and pyramid corporate structures (Yeh et al., 2001). Meanwhile, although the ownership of foreign investors in Taiwan’s market is not higher than that of domestic institutional investors, the trading activities of foreign investors affect the investment decisions of domestic investors. Although prior studies investigate some governance issues in Asia, the governance role of foreign institutional investors remains unknown. Therefore, this study examining whether the governance role of foreign investors can explain the long-run performance after equity issues in Taiwan competents the studies of corporate governance and capital markets in Asian emerging countries.
In this paper, we first analyze the long-run stock and operating performance of 383 seasoned equity issuers listed on the Taiwan Stock Exchange (TSE) from 1991 to 2002. We find a negative long-run performance after equity issues as in other developed markets. Then, we investigate the monitoring effects of foreign institutional investors by examining the relation between foreign ownership and post-issue performance. We find that firms with lower foreign ownership show significant and negative long-run abnormal stock performance. We also find that firms with higher foreign ownership do not significantly outperform or underperform their benchmarks after equity issues; however, issuers with the highest foreign ownership perform better over several long-run horizons than those with the lowest foreign shareholdings. In addition, firms with lower foreign ownership exhibit relatively inferior performance after their equity issues, and the decline of post-issue operating performance is less pronounced for firms with higher foreign investment. Overall, our empirical evidence supports our hypothesis that foreign ownership plays a critical role in mitigating the post-issue long-run underperformance suggested by the agency cost of free cash flows. On the other hand, domestic institutional investors do not appear to possess similar monitoring effects.
To avoid the argument of the “smart investment” hypothesis, whereby foreign institutions use their information advantage to invest in equity issuers with better long-term prospects, we analyze whether foreign investors invest more in SEO firms with better future performance. Contrary to the smart-investment hypothesis, our findings indicate that the long-term abnormal returns or operating performance of firms experiencing an increase in foreign ownership around the time of the offerings is statistically indifferent from that of firms in which foreign ownership decreases. Thus, we can rule out the argument that foreign institutions are better ex-ante screeners.
Regarding the monitoring role of foreign investors, we find that the market reacts to equity issue announcements more significantly for firms with higher foreign ownership. We further find that firms with higher foreign ownership are more likely to invest the SEO funds in core businesses and less likely to change investment projects or to underinvest. These
findings are consistent with our expectation that foreign investors efficiently monitor managers and improve firm value. In addition, the results reject the argument that the long-run performance of firms with high foreign ownership is due to momentum behavior of foreign institutions.
The remainder of the paper is organized as follows: Section 2 discusses the background of foreign investments in Taiwan and develops our hypotheses; Section 3 demonstrates data selection and methodology; Section 4 discusses the empirical analyses; Section 5 performs the additional tests; and Section 6 concludes the study.
2. Background and hypothesis
Taiwan is classified as a developed country based on its GDP and stock market capitalization. Since the Taiwan stock market opened to foreign investors in 1991, foreign investments have increased from about US$ 1 billion in 1991 to US$ 38 billion in 2002. Although Taiwan’s market plays a significant role in international investment portfolios, it is still an emerging financial market and characteristically differs from the developed markets due to weak corporate governance and inadequate shareholder protection.
In 2002, local individual investors, domestic institutional investors, and foreign institutional investors owned 83.4%, 10.5%, and 6.1% of listed shares in Taiwan’s stock markets, respectively (Lu, 2003). Many of the individual shareholdings were controlled by some families or affiliated members who actively participate in business operations through board involvements and management appointments (Yeh et al., 2001). These controlling shareholders mostly pursue their own interests rather than the best interests of all shareholders, and thus the existence of large shareholders does not improve corporate governance as it does in the US firms.
Domestic institutional shareholders include brokerage houses and security investment trust companies, and the press often points out that domestic institutional investors such lack credibility, rarely engage in firm research, and are periodically embroiled in scandals. As a result, foreign institutional investors play a critical role in improving governance practices. The media has even alluded to overseas monitoring as a device for controlling firms’ insiders. A reason for this is that the foreign investors in Taiwan tend to be long-term investors, which is consistent with the expectation of the Securities and Futures Commission when it opened Taiwan markets to global inventors. Meanwhile, domestic investors highly value foreign institutional investment and the media regularly reports news that positively associates the level of foreign equity ownership with stock price performance. Much of this attention (such as Business Weekly (April 19, 2004) and Business Today (July 4, 2005)) may be attributed to foreign investors’ ability to monitor corporate strategy, capital usage, and personnel.
Foreign institutional investors monitor capital spending decisions through periodic involvements in corporate governance, major corporate decisions, and business operations, which better integrate local firms into global markets. With great influence on capital markets, corporations pay more attention to the concerns of foreign investors. Foreign investors may express such things as their displeasure with decisions that are harmful to small investors, their opposition to an expansion of non-core businesses, or their wariness of excessive perquisites. If their concerns are unheeded by a firm’s management, foreign investors will “vote with their feet” and sell their shares, thus driving the stock prices down. Thus foreign investment shepherds the stock market to be the adequate check on corporate managerial decisions. In particular, foreign investors are prohibited from short selling in Taiwan. This prohibition restricts foreign investors from yielding profit by identifying losers, and instead places emphasis on actively selecting investments and closely monitoring them.
This study concentrates on the monitoring role of foreign ownership, and examines whether foreign ownership can explain stock performance after equity issues. The large cash infusions from equity issues may increase the agency cost of free cash flow. With excess cash infusions, managers may overinvest in negative net present value (NPV) projects to pursue pecuniary benefits or other personal rewards. Evidence consistent with this agency problem is presented in Blanchard et al. (1994) and Lang et al. (1995), who examine firms that receive large infusions of cash from lawsuits and asset sales. This overinvestment dissipates issuers’ subsequent profit and stock return performance. Because foreign investors play an effective monitoring/disciplinary role in improving corporate governance and encouraging value-enhancing strategies, we expect foreign ownership to mitigate agency problems of free cash flows from equity issues, leading to better long-run performance.
Hypothesis: The post-issue level of foreign ownership is positively related to post-issue stock returns and the changes in operating performance.
3. Data and methodology
3.1 Taiwanese SEO sample and data sources
We analyze all listed companies that conducted seasoned equity offerings on the Taiwan Securities Exchange (TSE) from 1991 to 2002, and that are available in the database of the Taiwan Economic Journal (TEJ). We limit our sample to equity issues prior to 2002 because three-year post-issue data is needed. We further exclude financial companies and firms with incomplete returns and financial data. We measure foreign ownership by the Qualified Foreign Institutional Investors (QFII) classified in the TEJ. Foreign investors include banks, insurance companies, securities firms, mutual funds and other investment institutions. Accordingly, the sample contains 383 seasoned equity offerings.
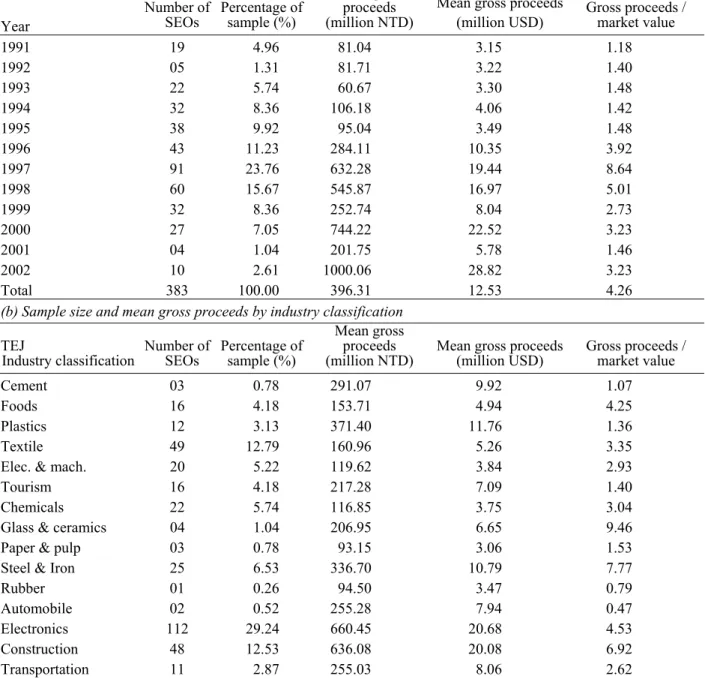
For the 383 SEOs sample, issuing firms sell a mean of 9.84% of total shares outstanding (including the new shares issued). The mean gross proceeds are NT$ 393.31 million or US$ 12.53 million, which is much smaller than that in other developed capital markets such as the U.S. and Japan. The mean increase in issuers’ total assets is 10.87% from one year before to one year after the offerings. Table 1(a) and (b) summarizes the mean ratio of gross proceeds to market value, the mean gross proceeds by calendar year and by TEJ industry classification respectively. Most of the offerings occur from 1996 to 1998. Given the economic recession in Taiwan, there are only 14 offerings during the 2001-2002 period and the relative issue size decreases to only 1.46, the smallest since 1994. Table 1(b) shows that the sample size varies by industry, from 112 offerings in the electronics industry to one in the rubber industry.
3.2 Research methodology
3.2.1 Post-issue stock return performance
Based on the study of Barber and Lyon (1997), we use the buy-and-hold abnormal return approach to measure the long-run stock returns following the SEOs and to compare our results with previous studies. The long-run returns are monthly compounded for 36 months following the SEOs and adjusted by the benchmark return as follows:
∏
∏
= = + − + = T 1 t t B, T 1 t t i, T i, (1 R ) (1 R ) BHARwhere Ri,t is the return for firm i in event month t, RB,t is the return on the benchmark during
the corresponding time period and T is the number of months. BHARi,T represents the total
return for issuing firm i, from a buy and hold strategy where a stock is purchased at the first closing market price after equity offering and held for T months (T = 12, 24, and 36), adjusted
Table 1. Summary of Taiwan SEO sample size and gross proceeds
(a) Sample size and mean gross proceeds by calendar year
Year
Number of
SEOs Percentage of sample (%)
Mean gross proceeds (million NTD)
Mean gross proceeds
(million USD) Gross proceeds / market value
1991 19 4.96 81.04 3.15 1.18 1992 05 1.31 81.71 3.22 1.40 1993 22 5.74 60.67 3.30 1.48 1994 32 8.36 106.18 4.06 1.42 1995 38 9.92 95.04 3.49 1.48 1996 43 11.23 284.11 10.35 3.92 1997 91 23.76 632.28 19.44 8.64 1998 60 15.67 545.87 16.97 5.01 1999 32 8.36 252.74 8.04 2.73 2000 27 7.05 744.22 22.52 3.23 2001 04 1.04 201.75 5.78 1.46 2002 10 2.61 1000.06 28.82 3.23 Total 383 100.00 396.31 12.53 4.26
(b) Sample size and mean gross proceeds by industry classification TEJ
Industry classification Number of SEOs Percentage of sample (%)
Mean gross proceeds
(million NTD) Mean gross proceeds (million USD) Gross proceeds / market value
Cement 03 0.78 291.07 9.92 1.07
Foods 16 4.18 153.71 4.94 4.25
Plastics 12 3.13 371.40 11.76 1.36
Textile 49 12.79 160.96 5.26 3.35
Elec. & mach. 20 5.22 119.62 3.84 2.93
Tourism 16 4.18 217.28 7.09 1.40
Chemicals 22 5.74 116.85 3.75 3.04
Glass & ceramics 04 1.04 206.95 6.65 9.46
Paper & pulp 03 0.78 93.15 3.06 1.53
Steel & Iron 25 6.53 336.70 10.79 7.77
Rubber 01 0.26 94.50 3.47 0.79 Automobile 02 0.52 255.28 7.94 0.47 Electronics 112 29.24 660.45 20.68 4.53 Construction 48 12.53 636.08 20.08 6.92 Transportation 11 2.87 255.03 8.06 2.62 Tourism 03 0.78 95.47 3.14 1.17
Wholesale & retail 12 3.13 325.92 10.37 4.07
Other industries 24 6.27 251.55 7.92 3.07
Notes: The sample consists of 383 SEOs conducted by Taiwanese firms during the 1991-2002 period. The summary reports the sample size, percentage of sample, the mean gross proceeds in terms of December 2002 purchasing power, and the mean ratio of gross proceeds to firm size (gross proceeds/market value at the end of the offering month) by calendar year and by TEJs’ industry classification.
The mean buy-and-hold abnormal returns for a sample of N equity issuers during a period
T is defined as
∑
= = N 1 i T i, T N) BHAR 1 ( BHARTo test the null hypothesis of zero mean buy-and-hold return, we prefer the skewness-adjusted t statistic advocated by Neyman and Pearson (1928) and recently used by Lyon et al.
(1999). The t-statistic is defined as γˆ) 6n 1 S γˆ 3 1 (S n
t= × + 2 + , where S is calculated as the mean buy-and-hold abnormal returns for a period T, divided by its standard deviation, and γˆ is an estimate of the coefficient of skewness.
To ensure that our results are not driven by potential benchmark problems, we follow Loughran and Ritter’s (1995) procedure to construct three different benchmarks in measuring abnormal returns: (a) size-matched, (b) B/M-matched, and (c) size-and-B/M-matched nonissuing firms. Note that we choose not to consider matching by industry because an industry can time its offers to take advantage of industry-wide misevaluations. Controlling for industry effects will reduce the ability to identify abnormal performance (Loughran and Ritter, 1995). We conduct a single-firm matching procedure based on the work of Barber and Lyon (1997). Barber and Lyon documents that new-listing bias, rebalancing bias, and skewness problems are significantly reduced if the abnormal returns are calculated using the returns of a sample firm less the return of a single control firm (versus calculating returns using a reference portfolio composed of a number of stocks).
Accordingly, we match each firm with a nonissuing firm that has not issued stock within the last three years. Portfolios are constructed according to their size and/or book-to-market ratio (B/M) at the end of the issuing calendar month. We measure firm size as the market value of equity, which is defined as the number of common equity shares outstanding multiplied by the stock price at the end of the issuing month, and B/M is defined as book value of equity divided by the market value of equity in previous year. As for size-matched portfolios, each SEO firm is matched with a non-issuing firm that has a similar market value at the end of the issuing calendar month. The procedure for matching by B/M is the same except that the book value for the issuing firm also includes the issuing proceeds. To control for both size and B/M effects, a non-issuing firm is chosen such that the absolute%age difference between size and B/M is minimal.
3.2.2 Post-issue operating performance
Following earlier studies (e.g. Jain and Kini, 1994; Loughran and Ritter, 1997), our measure of operating performance include ordinary income scaled by total assets and common equity, as well as profit margins. Ordinary income is operating income minus depreciation plus interest income and expenses before taxes. We examine SEO firms’ operating performance over time and compare their performance to the performance of the industry median. To report the change in operating performance over time, we calculate the median difference between the operating performances of each firm during the year before the SEO (t = -1) to the SEO year (t = 0), and each of the three years after the SEO (t = +1, +2, +3). Significance levels are tested using the Wilcoxon signed rank test. The industry-adjusted performance of a SEO firm is the difference between its change in operating performance and that of the industry median. This procedure follows the suggestion of Barber and Lyon (1996) that an industry benchmark reduces potential mean-reversion disturbances in the operating performance and control for industry effects.
3.3 Descriptive statistics
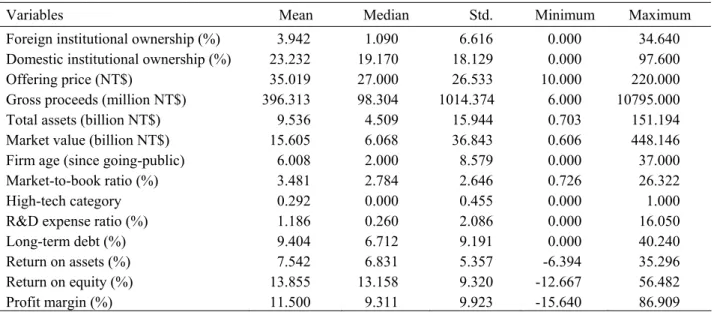
Table 2 reports descriptive statistics of institutional ownership and financial figures for equity-issuing firms. Foreign institutional ownership is 3.94% when the issue is completed, but domestic institutions own on average 23.23% of the issuers. The mean offering price is NT$ 35.02. The mean gross proceeds are approximately NT$ 396 million, but the median value of these proceeds are only about NT$98 million, suggesting that the sample contains many large fund-raising cases. The total assets of firms that conduct SEO vary from NT$ 0.70
billion (minimum) to NT$ 151.19 billion (maximum), with a mean of NT$9.54 billion. The mean (median) listing age of the sample firms is 6.01 (2.00) years.
Table 2. Summary characteristics of SEO firms in 1991-2002
Variables Mean Median Std. Minimum Maximum
Foreign institutional ownership (%) 3.942 1.090 6.616 0.000 34.640 Domestic institutional ownership (%) 23.232 19.170 18.129 0.000 97.600 Offering price (NT$) 35.019 27.000 26.533 10.000 220.000 Gross proceeds (million NT$) 396.313 98.304 1014.374 6.000 10795.000 Total assets (billion NT$) 9.536 4.509 15.944 0.703 151.194 Market value (billion NT$) 15.605 6.068 36.843 0.606 448.146 Firm age (since going-public) 6.008 2.000 8.579 0.000 37.000 Market-to-book ratio (%) 3.481 2.784 2.646 0.726 26.322
High-tech category 0.292 0.000 0.455 0.000 1.000
R&D expense ratio (%) 1.186 0.260 2.086 0.000 16.050
Long-term debt (%) 9.404 6.712 9.191 0.000 40.240
Return on assets (%) 7.542 6.831 5.357 -6.394 35.296 Return on equity (%) 13.855 13.158 9.320 -12.667 56.482 Profit margin (%) 11.500 9.311 9.923 -15.640 86.909 Notes: Foreign (domestic) institutional ownership is the ratio of the number of shares held by foreign (domestic)
institutional investors to the total number of shares outstanding as of the issuing year. Gross Proceeds is the proceeds raised from a SEO, measured as the product of the number of shares issued and the offering price. Total Assets is measured as the book value of assets in the fiscal year prior to the SEO. Market Value represents the market value of equity and is defined as the number of common equity shares outstanding multiplied by the stock price at the end of the issuing month. Firm age is measured as the number of years that has elapsed from the year of IPO of the issuer. Market-to-book ratio is defined as the ratio of market value of equity to the book value of common equity. High-tech category is a dummy variable that equals 1 if the issuing firm is in electronics industry, and is 0 otherwise. R&D expense ratio is defined as the firm’s R&D expenditure divided by total sales in the fiscal year prior to the SEO. Long-term debt represents the long-term debt leverage and is measured as the ratio of long term debt divided by assets in the fiscal year prior to the SEO. Return on Assets (Equity) is operating income minus depreciation plus interest income and expenses before taxes relative to total assets (common equity) in the fiscal year prior to the SEO. Profit Margin is the ratio of operating income to net sales in the fiscal year prior to the SEO.
The mean market-to-book ratio of the equity offerings is 3.48, higher than that of seasoned stocks (Huang et al., 2003). This is implicitly consistent with results in the equity-issuance literature that firms take advantage of market overvaluation to conduct equity issues. In addition, 31.93% of the firms are belonging to electronic-related high-tech companies. The average R&D intensity ratio, defined as research and development expense divided by sales is 1.19%. The median long-term debt to total assets ratio is 9.40%. The median pre-issue return on assets, return on equity, and profit margin are 6.83%, 13.16%, and 9.31%, respectively.
4. Empirical analyses
4.1 Post-issue buy-and-hold abnormal returns
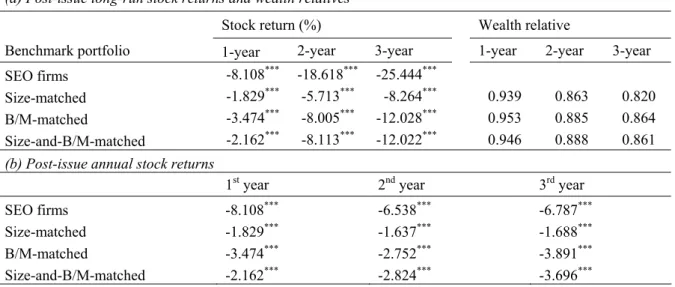
Buy-and-hold returns over one-, two- and three-year windows are created by compounding the monthly returns of issuing firms and benchmark portfolios. Table 3(a) reports the average buy-and-hold returns and wealth relatives of issuing firms for one-, two-, and three-years after the offerings. A wealth relative is defined as the average gross buy-and-hold return on the issuing firms divided by the average gross buy-and-buy-and-hold return on the benchmarks. Over the three-year window, the average buy-and-hold return is -25.44% for
issuing firms versus -8.26% for non-issuing firms of similar market capitalization, with a wealth relative of 0.82. Our evidence is similar to the underperformance of equity issues in the U.S. For example, using the same benchmark, Loughran and Ritter (1995) report a three-year wealth relative of 0.78. Spiess and Affleck-Graves (1995) report a wealth relative of 0.88 during the three years after the seasoned offering. Furthermore, the underperformance is robust to alternative benchmarks.
To examine when the underperformance occurs, Table 3(b) reports the annual returns of issuing firms and benchmarks for each of the three years following equity issues. The underperformance is relatively conspicuous in the first two years after the offerings. For example, in the first year following the offerings, seasoned equity issuers experience an average return of less than -8% while the mean return is -2.5% for all of the benchmarks. The geometric average annual return is -7.14% for issuing firms versus -1.72% for the size-matched benchmark, and the difference in annual return between SEOs and the matching firms is significant at the conventional statistical level.
Table 3. Long-run stock returns for Taiwan SEOs, relative to alternative benchmarks
(a) Post-issue long-run stock returns and wealth relatives
Stock return (%) Wealth relative
Benchmark portfolio 1-year 2-year 3-year 1-year 2-year 3-year SEO firms -8.108*** -18.618*** -25.444***
Size-matched -1.829*** -5.713*** -8.264*** 0.939 0.863 0.820
B/M-matched -3.474*** -8.005*** -12.028*** 0.953 0.885 0.864
Size-and-B/M-matched -2.162*** -8.113*** -12.022*** 0.946 0.888 0.861
(b) Post-issue annual stock returns
1st year 2nd year 3rd year
SEO firms -8.108*** -6.538*** -6.787***
Size-matched -1.829*** -1.637*** -1.688***
B/M-matched -3.474*** -2.752*** -3.891***
Size-and-B/M-matched -2.162*** -2.824*** -3.696***
Notes: (a) Summarizes the mean stock returns of post-issue 1-, 2- and 3-year buy-and-hold strategies and wealth relatives for Taiwanese SEO firms in 1991-2002, relative to the following three benchmark portfolios including size-, book-to-market-, and size-and-book-to-market-matched portfolios. Holding period returns are measured from the first closing market price after the SEO date until the earlier of the 1-year (2-year ) (3-year) anniversary of the SEO. Wealth relatives are defined as the average gross buy-and-hold return on the issuing firms divided by average gross buy-and-hold return on the benchmarks. (b) summarizes the mean stock returns of post-issue annual buy-and-hold strategies. ***, **,
and * represent significant difference in returns from the SEO firms at the 1%, 5% and 10% levels
respectively. To taken into account the cross-dependence of sample observations, the t-statistics are skewness-adjusted as in Lyon et al., (1999).
4.2 Post-issue operating performance
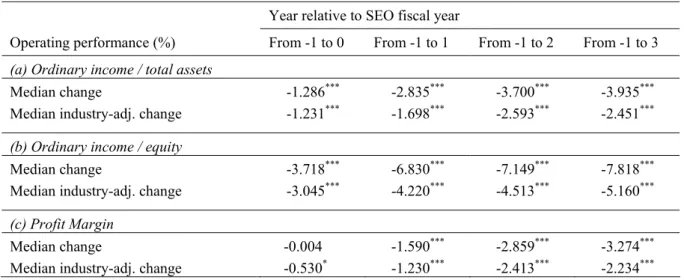
The long-term downward drift of stock returns leads to questions about the issuing firms’ profitability. Table 4 reports the median changes and the Wilcoxon tests for both the raw and industry-adjusted operating performance.
Table 4(a) reports that median changes in raw ordinary income relative to total assets are -1.29%, -2.84%, -3.77% and -3.94% from year -1 to year 0, +1, +2 and +3, respectively, all at the significant levels. The median industry-adjusted operating performance shows a similar post-issue decline. Using various performance measures, such as ordinary income relative to equity and profit margin, the results still exhibit a declining long-run performance over the
post-issue three-year windows. The magnitude of the post-issue decline is greater than that for the SEO firms in the U.S. and Japan. This reflects the fact that the TSE-listed Taiwan SEOs tend to be small, young firms, as suggested by Spiess and Affleck-Graves (1995).
Table 4 Post-issue operating performance of Taiwan SEO firms
Year relative to SEO fiscal year
Operating performance (%) From -1 to 0 From -1 to 1 From -1 to 2 From -1 to 3 (a) Ordinary income / total assets
Median change -1.286*** -2.835*** -3.700*** -3.935***
Median industry-adj. change -1.231*** -1.698*** -2.593*** -2.451***
(b) Ordinary income / equity
Median change -3.718*** -6.830*** -7.149*** -7.818***
Median industry-adj. change -3.045*** -4.220*** -4.513*** -5.160***
(c) Profit Margin
Median change -0.004 -1.590*** -2.859*** -3.274***
Median industry-adj. change -0.530* -1.230*** -2.413*** -2.234***
Notes: Median changes in raw and industry-adjusted operating performance are reported for Taiwanese SEO firms over the period 1991-2002. Operating performance measures include ordinary income relative to total assets, ordinary income relative to common equity and operating income to net sales. Ordinary income is operating income minus depreciation plus interest income and expenses before taxes. The changes in operating performance are measured from years -1 to 0, +1, +2 and +3, relative to the offering fiscal year 0. ***, **, and * indicate significance at the 1%, 5% and 10% levels
respectively. The significance levels are based on the Wilcoxon signed rank test, which assumes that observations are independent.
4.3 Institutional ownership and post-issue long-run stock returns
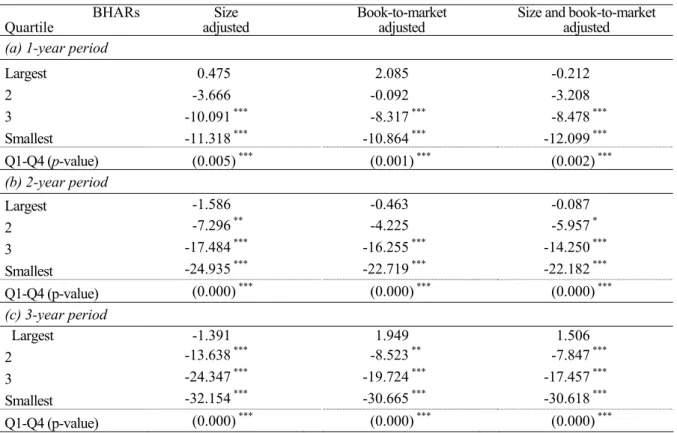
In this section, we test whether foreign ownership can explain the performance deterioration of Taiwan’s SEOs. We argue that firms with higher foreign ownership should experience better post-issue performance due to better governance practice. In Table 5, we classify the firms into four quartiles based on the foreign ownership reported at the end of the year immediately following their offerings. Quartile 1 consists of firms with the largest level of foreign ownership and quartile 4 consists of firms with the smallest level of foreign ownership.
Table 5 (a) (b) and (c) report average long-term abnormal returns across the quartiles for one-, two-, and three-year windows after the offerings, respectively. The buy-and-hold abnormal returns show that the mean 3-year BHARs of the lower foreign ownership subsamples (Q4, Q3 and Q2) are significantly negative for various matched portfolios. In sharp contrast, the abnormal returns for the highest foreign ownership sub-sample are insignificantly different from zero. This implies that post-SEO long-term underperformance is concentrated among companies with less foreign ownership.
In addition, firms in Q1 consistently outperform firms in Q4 over the three-year period. Note that the post-issue performance deteriorates uniformly across the least three quartiles and becomes worse over time. For example, firms in Q1 outperform firms in Q4 by 11.79% over a one-year window period and by 18.9% over a three-year window period in size-adjusted estimation. The difference between these two quartiles is statistically significant at the 1% level. Similar results are observed in the B/M-adjusted and size-and-B/M-adjusted returns. Overall, the positive relationship between foreign ownership and subsequent returns
persists, regardless of whether adopted benchmark or period, and is consistent with the monitoring hypothesis.
Table 5. Average long-run abnormal returns after SEO grouped by foreign ownership
BHARs
Quartile adjusted Size Book-to-market adjusted Size and book-to-market adjusted (a) 1-year period
Largest 0.475 2.085 -0.212 2 -3.666 -0.092 -3.208 3 -10.091 *** -8.317 *** -8.478 *** Smallest -11.318 *** -10.864 *** -12.099 *** Q1-Q4 (p-value) (0.005) *** (0.001) *** (0.002) *** (b) 2-year period Largest -1.586 -0.463 -0.087 2 -7.296 ** -4.225 -5.957 * 3 -17.484 *** -16.255 *** -14.250 *** Smallest -24.935 *** -22.719 *** -22.182 *** Q1-Q4 (p-value) (0.000) *** (0.000) *** (0.000) *** (c) 3-year period Largest -1.391 1.949 1.506 2 -13.638 *** -8.523 ** -7.847 *** 3 -24.347 *** -19.724 *** -17.457 *** Smallest -32.154 *** -30.665 *** -30.618 *** Q1-Q4 (p-value) (0.000) *** (0.000) *** (0.000) ***
Notes: (a), (b) and (c) summarize the mean 1- (2-) (3-)year size, book-to-market, and size-and-book-to-market adjusted holding period abnormal returns, respectively. Holding period returns are measured from the first closing market price after equity issuing date until the earlier of the 1-year (2-year ) (3-year) anniversary of the SEO. The sample includes Taiwanese SEO firms in 1991-2002, divided into quartiles based on the level of foreign ownership as of the issuing year-end. Quartile 1 contains firms with the highest level in foreign ownership and quartile 4 contains firms with the lowest ownership.
***, **, and * represent significant difference from zero in abnormal returns at the 1%, 5% and 10%
levels respectively. The last low gives the p-value for the difference in mean abnormal returns between quartiles 1 and 4.
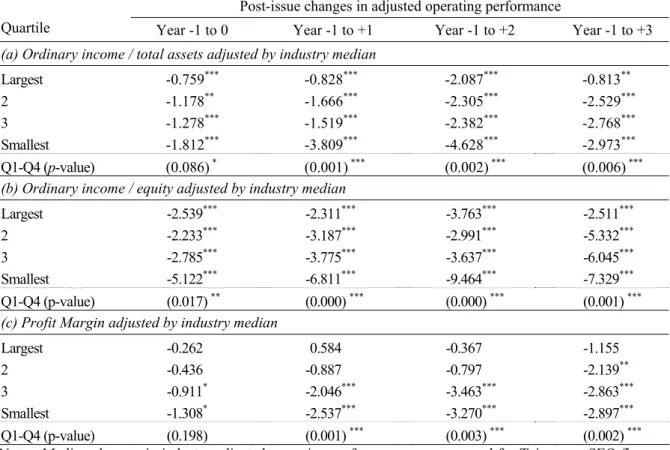
4.4 Institutional ownership and post-issue operating performance
Table 6 reports the change in the industry-adjusted operating performance of SEO firms surrounding the issuing years consistent with the argument that foreign institutional investors play a critical role in monitoring insiders, the results indicate that firms in Q1 exhibit the least decline in operating performance (e.g. return on assets, return on equity, and profit margin), yet firms in Q4 experience the greatest postissue deterioration. Furthermore, relative to year -1, the median change in operating performance of the highest foreign ownership sub-sample is consistently and significantly higher than that of the lowest foreign ownership sub-sample for year +1, +2, and +3. Overall, the results suggest that the declining post-issue operating performance is mitigated for firms with higher foreign institutional monitoring.
Table 6. Post-issue operating performance of SEOs grouped by foreign ownership
Post-issue changes in adjusted operating performance
Quartile Year -1 to 0 Year -1 to +1 Year -1 to +2 Year -1 to +3 (a) Ordinary income / total assets adjusted by industry median
Largest -0.759*** -0.828*** -2.087*** -0.813**
2 -1.178** -1.666*** -2.305*** -2.529***
3 -1.278*** -1.519*** -2.382*** -2.768***
Smallest -1.812*** -3.809*** -4.628*** -2.973***
Q1-Q4 (p-value) (0.086) * (0.001) *** (0.002) *** (0.006) ***
(b) Ordinary income / equity adjusted by industry median
Largest -2.539*** -2.311*** -3.763*** -2.511***
2 -2.233*** -3.187*** -2.991*** -5.332***
3 -2.785*** -3.775*** -3.637*** -6.045***
Smallest -5.122*** -6.811*** -9.464*** -7.329***
Q1-Q4 (p-value) (0.017) ** (0.000) *** (0.000) *** (0.001) ***
(c) Profit Margin adjusted by industry median
Largest -0.262 0.584 -0.367 -1.155
2 -0.436 -0.887 -0.797 -2.139**
3 -0.911* -2.046*** -3.463*** -2.863***
Smallest -1.308* -2.537*** -3.270*** -2.897***
Q1-Q4 (p-value) (0.198) (0.001) *** (0.003) *** (0.002) ***
Notes: Median changes in industry-adjusted operating performance are compared for Taiwanese SEO firms, divided into quartiles based on the level of foreign ownership as of the issuing year-end. Operating performance measures include ordinary income relative to total assets, ordinary income relative to common equity and operating income to net sales. The changes in operating measures are from years -1 to 0, +1, +2 and +3, respectively, relative to the offering fiscal year 0. ***, **, and * represent
significance at the 1%, 5% and 10% levels respectively. The significance levels for median changes are based on the Wilcoxon signed rank test. The last low gives the p-value for the difference in median changes between quartiles 1 and 4, based on the Wilcoxon two-sample signed rank test.
4.5 Does foreign investors’ sophistication play a role?
It is possible that cross-sectional differences in the long-term performance of firms that conduct seasoned equity issues are due to the foreign investors’ ex-ante screening, which translates into heavy investment in SEOs with better prospects. Indeed, foreign institutions may have information advantages, particularly in the new issues market. For example, because institutions typically invest in a large number of different stocks, they are able to exploit the economies of scope when evaluating the future prospects of an equity issuer and further identify good targets. In addition, many institutions are invited to road shows where they receive firm-specific information. They also have connections to underwriters and accountants who may provide them with more in-depth information than the average investor.
Furthermore, some studies contend that sophisticated institutions use their information advantage to invest selectively in equity issues with better future prospects. This idea is dubbed “smart investment” by Gibson et al. (2004), who find that firms with an increase in institutional ownership around the time of their SEOs outperform their portfolio benchmarks in the year following the offering, and also outperform firms associated with a decrease in institutional ownership around the time of the offerings. Using a dataset of institutional trades, Seasholes (2000) find that foreign investors in Taiwan obtain higher returns than local investors because of their superior information and screening skills.
should avoid the equity issues of overvalued firms and poorly performed firms. We would therefore expect stock returns to increase when foreign institutional investors purchase more shares of an equity issue. For each firm, we measure foreign participation as the number of shares held by foreign institutional investors in the year after the issue date minus the number held by the foreign investors in the year before the equity issue was announced, divided by the change in the total number of shares outstanding during the two years. Besides, this participation measure incorporates purchases and sales undertaken by foreign investors in open markets upon the equity issue announcement. If foreign investors participate in equity issues but not on a pro-rata basis, their post-issue ownership would still decrease. To take into account the potential measurement error of participation, we also measure the changes of foreign holdings as the difference in ownership from the year before the announcement to the year after the equity issue, following Gibson et al. (2004). Although this participation measure may understate (overstate) true participation in firms with high (low) prior levels of total foreign ownership, we find that our main findings statistically remain. In the interest of brevity, results are not reported here but are available upon request from the authors. Next, we divide the sample of seasoned issues with institutional data into two sub-samples according to the participation by foreign institutions in the equity issues. The institutional
increase subsample contains firms in which foreign institutions purchase shares either in the
equity issue or in the secondary market during the period between the announcement date and the end of the issue year. The institutional decrease subsample contains firms in which foreign investors either did not buy any shares in the equity issue or actually sold some of their holdings after the announcement of the issue. There are 218 firms in the institutional
increase subsample and 165 firms in the institutional decrease subsample.
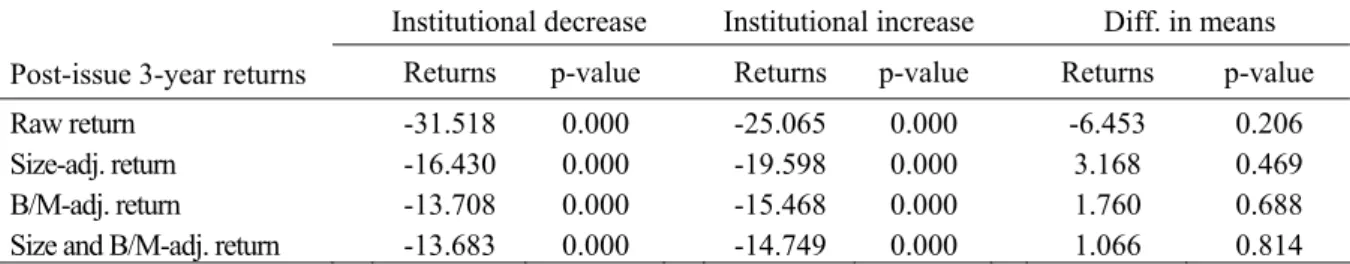
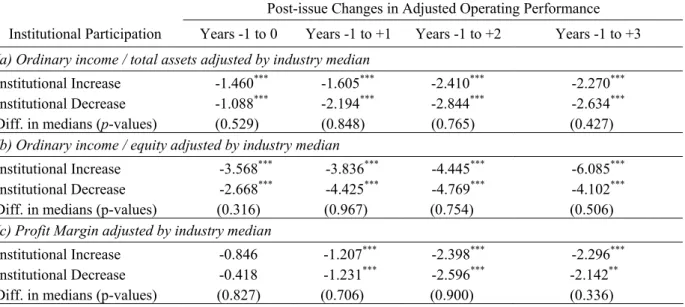
Table 7 shows the post-issue three-year buy-and-hold abnormal returns for our sub-samples. For example, the mean three-year BHARs for the institutional decrease subsample are -16.43%, -13.71%, and -13.68% for the size-matched, B/M-matched, and size-and-B/M-matched portfolios, respectively. The mean three-year BHARs for the institutional increase subsample are -19.60%, -15.47%, and -14.75% for the matched, B/M-matched, and size-and-B/M-matched firms, respectively. However, returns do not differ significantly between the two sub-samples. The results of Table 8 also show that, over a two-year window after issues, the operating performance of the institutional increase subsample is similar to or even better than that of the institutional decrease subsamples. The evidence contradicts the prediction of the smart-investment hypothesis that foreign institutions are better able to find issues with superior long-term prospects than are other investors.
Table 7. Foreign investor participation in SEO and post-issue stock performance
Institutional decrease Institutional increase Diff. in means Post-issue 3-year returns Returns p-value Returns p-value Returns p-value Raw return -31.518 0.000 -25.065 0.000 -6.453 0.206 Size-adj. return -16.430 0.000 -19.598 0.000 3.168 0.469 B/M-adj. return -13.708 0.000 -15.468 0.000 1.760 0.688 Size and B/M-adj. return -13.683 0.000 -14.749 0.000 1.066 0.814 Notes: Foreign participation is the number of shares held by foreign investors in the year immediately after the
issue date minus the number held by foreign investors in the year before the announcement date divided by the difference between the total number of shares outstanding in the two time periods. Raw return is the average unadjusted holding period return over the 3-year period starting from the first closing market price after equity issuing date. The size-, B/M-, and size-and-B/M-adjusted returns are the average 3-year size, book-to-market, and size-and-book-to-market adjusted holding period abnormal returns, respectively. The sample is divided into two groups based on the sign of foreign investor participation. The last two columns provide the mean difference in returns and the p-values for the mean
Table 8. Foreign investor participation in SEO and post-issue operating performance
Post-issue Changes in Adjusted Operating Performance Institutional Participation Years -1 to 0 Years -1 to +1 Years -1 to +2 Years -1 to +3 (a) Ordinary income / total assets adjusted by industry median
Institutional Increase -1.460*** -1.605*** -2.410*** -2.270***
Institutional Decrease -1.088*** -2.194*** -2.844*** -2.634***
Diff. in medians (p-values) (0.529) (0.848) (0.765) (0.427) (b) Ordinary income / equity adjusted by industry median
Institutional Increase -3.568*** -3.836*** -4.445*** -6.085***
Institutional Decrease -2.668*** -4.425*** -4.769*** -4.102***
Diff. in medians (p-values) (0.316) (0.967) (0.754) (0.506) (c) Profit Margin adjusted by industry median
Institutional Increase -0.846 -1.207*** -2.398*** -2.296***
Institutional Decrease -0.418 -1.231*** -2.596*** -2.142**
Diff. in medians (p-values) (0.827) (0.706) (0.900) (0.336)
Notes: Foreign participation is the number of shares held by foreign investors in the year immediately after the issue date minus the number of shares held by foreign investors in the year before the announcement date, scaled by the difference of total shares outstanding between the two time periods. The changes in operating measures are from years -1 to 0, +1, +2 and +3, respectively, relative to the offering fiscal year 0. Operating performance measures include ordinary income relative to total assets, ordinary income relative to common equity and operating income to net sales. The sample is divided into two groups based on the sign of foreign investor participation. ***, **, and * represent significance at the 1%, 5% and
10% levels respectively. The significance levels for median changes are based on the Wilcoxon signed rank test. The last row gives the p-values for the difference in the median change in operating performance between the two groups, based on the Wilcoxon two-sample signed rank test.
4.6 Multivariate analysis
To further examine the monitoring effects of foreign ownership on post-issue long-run performance, we employ the OLS regression model to control for other important factors. The model is specified as follows:
i 7 i 6 i 5 i 4 3 i 2 i 1 0
i β β FINST β FINST β DINST β RD β LTD β MB β LNTA
e Performanc = + + Δ + + + + + i i 9 i 8TECH β ISIZE ε β + + + (1) where performance is measured by post-issue stock and operating performance. Stock performance is the three-year buy-and-hold abnormal return after equity issues, adjusted for size-matched, B/M-matched, and size-and-B/M-matched portfolios. Operating performance is estimated by the change of industry-adjusted return on assets, return on equity, and profit margin from year -1 to +3. Post-issue one-year and two-year abnormal returns, as well as operating performance changes from year -1 to +1, and +2, are all examined by regression analysis, but the results are qualitatively similar to the reported post-issue three-year results, as we will discuss later. FINST is the ownership held by the foreign institutional investors after the SEO. ΔFINST is the change in foreigne holdings as the difference in ownership from the year before the equity issue to the end of issuing year, as a proxy for foreign institutional participation in order to control for the noise of the alternative smart-investment theory.
Additionally, we include several control variables used in Mikkelson et al., (1997). DINST is measured as the percentage of stocks held by domestic institutions. RD is a proxy for R&D intensity, defined as the SEO firm’s R&D expenditure divided by total sales. LTD is the ratio of long-term debt to total assets. MB is measured by the total market equity value at the end of the issuing month divided by the previous year’s book equity. LNTA is the natural logarithmic
of total assets. The TECH dummy variable is equal to one if the SEO firm is in an electronics-related industry and zero otherwise. ISIZE reflects the SEO proceed, measured by the natural logarithm of the issuing price multiplied by the number of shares issued.
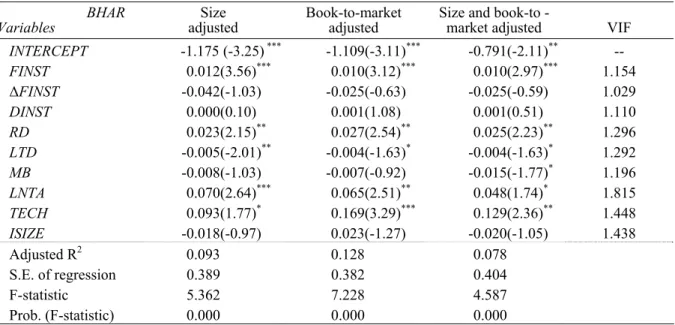
The results of the post-issue stock abnormal-return model are reported in Table 9. The
F-statistics of the three regression models show that, jointly, independent variables
significantly explain abnormal returns. All variance-inflation factors (VIFs) are less than two, suggesting no multicollinearity problem (Kennedy, 1998). The coefficient of R&D intensity is significantly positive. Furthermore, high-tech firms tend to perform better after the issue. We also find that firm size and leverage can significantly explain the variation of post-SEO stock returns.
Table 9. Regressions relating post-issue stock returns to foreign ownership
BHAR
Variables adjusted Size Book-to-market adjusted Size and book-to -market adjusted VIF INTERCEPT -1.175 (-3.25) *** -1.109(-3.11)*** -0.791(-2.11)** -- FINST 0.012(3.56)*** 0.010(3.12)*** 0.010(2.97)*** 1.154 ΔFINST -0.042(-1.03) -0.025(-0.63) -0.025(-0.59) 1.029 DINST 0.000(0.10) 0.001(1.08) 0.001(0.51) 1.110 RD 0.023(2.15)** 0.027(2.54)** 0.025(2.23)** 1.296 LTD -0.005(-2.01)** -0.004(-1.63)* -0.004(-1.63)* 1.292 MB -0.008(-1.03) -0.007(-0.92) -0.015(-1.77)* 1.196 LNTA 0.070(2.64)*** 0.065(2.51)** 0.048(1.74)* 1.815 TECH 0.093(1.77)* 0.169(3.29)*** 0.129(2.36)** 1.448 ISIZE -0.018(-0.97) 0.023(-1.27) -0.020(-1.05) 1.438 Adjusted R2 0.093 0.128 0.078 S.E. of regression 0.389 0.382 0.404 F-statistic 5.362 7.228 4.587 Prob. (F-statistic) 0.000 0.000 0.000
Notes: This table presents cross-sectional OLS regressions with post-issue 3-year abnormal returns as the dependent variable for a sample of 383 Taiwanese SEOs over 1991-2002. The independent variables are defined as follows. FINST is the ratio of the number of shares held by foreign institutional investors to the total number of shares outstanding as of the issuing year. ΔFINST is the the number of shares held by foreign investors in the year immediately after the issue date minus the number held by foreign investors in the year before the announcement date divided by the difference between the total number of shares outstanding in the two time periods. DINST is the ratio of the number of shares held by domestic institutional investors to the total number of shares outstanding as of the issuing year. RD is defined as the firm’s R&D expenditure divided by total sales in the fiscal year prior to the SEO. LTD represents the long-term debt leverage and is measured as the ratio of long term debt divided by assets in the fiscal year prior to the SEO. MB is defined as the ratio of market value of equity to the book value of common equity. LNTA is measured as the natural logarithm of book value of assets in the fiscal year prior to the SEO. TECH is a dummy variable that takes on the value 1 if the issuing firm is classified as electronic industry, and is 0 otherwise. ISIZE is the natural logarithm of the product of the number of shares issued and the offering price. Values in parentheses represent t-statistics. ***, **, and *
represent significance at the 1%, 5%, and 10% levels, respectively.
The positive and significant coefficients of foreign ownership suggest foreign investment has a positive impact on the long-run stock performance of equity issuers, implying that higher foreign ownership may increase the benefits of monitoring and reduce agency problems. More importantly, the coefficient of the change of foreign ownership around the issues is insignificant, indicating that the smart investment hypothesis—the idea that foreign investors have the ability to screen the quality of SEOs and to avoid those SEOs that will subsequently perform poorly—is not supported. This in turn supports our hypothesis that foreign ownership leads to better monitoring effects and thus enhances firm performance. The
level of domestic institutional ownership does not significantly affect abnormal returns. This may be explained by the fact that a greater proportion of domestic institutional ownership is associated with business affiliations or controlling families/groups that have substantially compromised monitoring roles.
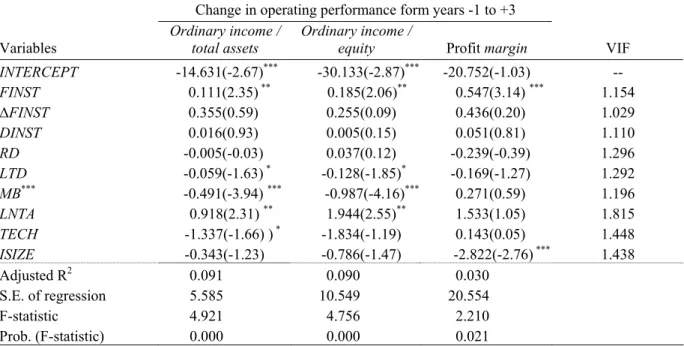
Table 10 shows the relation between the foreign ownership and subsequent operating performance of SEO issuers. The regression results indicate that SEO firms with higher post-issue foreign ownership have significantly superior long-term operating performance than their counterparts with lower foreign ownership. Again, our findings strongly support our hypothesis that foreign investors play a critical role in monitoring and then improving the operating performance of SEO firms.
Table 10 Regressions relating post-issue operating performance to foreign ownership
Change in operating performance form years -1 to +3
Variables Ordinary income / total assets Ordinary income / equity Profit margin VIF
INTERCEPT -14.631(-2.67)*** -30.133(-2.87)*** -20.752(-1.03) -- FINST 0.111(2.35) ** 0.185(2.06)** 0.547(3.14) *** 1.154 ΔFINST 0.355(0.59) 0.255(0.09) 0.436(0.20) 1.029 DINST 0.016(0.93) 0.005(0.15) 0.051(0.81) 1.110 RD -0.005(-0.03) 0.037(0.12) -0.239(-0.39) 1.296 LTD -0.059(-1.63) * -0.128(-1.85)* -0.169(-1.27) 1.292 MB*** -0.491(-3.94) *** -0.987(-4.16)*** 0.271(0.59) 1.196 LNTA 0.918(2.31) ** 1.944(2.55)** 1.533(1.05) 1.815 TECH -1.337(-1.66) ) * -1.834(-1.19) 0.143(0.05) 1.448 ISIZE -0.343(-1.23) -0.786(-1.47) -2.822(-2.76) *** 1.438 Adjusted R2 0.091 0.090 0.030 S.E. of regression 5.585 10.549 20.554 F-statistic 4.921 4.756 2.210 Prob. (F-statistic) 0.000 0.000 0.021
Notes: This table presents cross-sectional OLS regressions with post-issue change in operating performance as the dependent variable for a sample of 383 Taiwanese SEOs over 1991-2002. The changes in operating measures are defined as the operating performance in year +3 minus the operating performance in year -1 minus the change in industry median over this period, relative to the offering fiscal year 0. The independent variables are defined as follows. FINST is the ratio of the number of shares held by foreign institutional investors to the total number of shares outstanding as of the issuing year. ΔFINST is the the number of shares held by foreign investors in the year immediately after the issue date minus the number held by foreign investors in the year before the announcement date divided by the difference between the total number of shares outstanding in the two time periods. DINST is the ratio of the number of shares held by domestic institutional investors to the total number of shares outstanding as of the issuing year. RD is defined as the firm’s R&D expenditure divided by total sales in the fiscal year prior to the SEO. LTD represents the long-term debt leverage and is measured as the ratio of long term debt divided by assets in the fiscal year prior to the SEO. MB is defined as the ratio of market value of equity to the book value of common equity. LNTA is measured as the natural logarithm of book value of assets in the fiscal year prior to the SEO. TECH is a dummy variable that takes on the value 1 if the issuing firm is classified as electronic industry, and is 0 otherwise. ISIZE is the natural logarithm of the product of the number of shares issued and the offering price. Values in parentheses represent t-statistics. ***, **, and * represent
significance at the 1%, 5%, and 10% levels, respectively.
In addition, we use the fraction of foreign institutional ownership relative to domestic ownership to test for the impact of the relative power of different categories of institutional investors on the post-issue performance. When we add the relative ownership measure and re-estimate the regression models, the results remain largely similar. Note that the coefficients on the relative ownership variable are all insignificant for all models, suggesting that the
monitoring benefits of foreign investors stems from the absolute shareholding level regardless of its relative size to domestic ownership.
It should be noted that the adjusted R2 reported is relatively low in Table 9 and10, ranging between 3.0 to 12.8%. This indicates that independent variables, though statistically significant, explain only a small proportion of the variance of the post-issue long-run performance. However, a low adjusted-R2 is a common feature in many SEO studies, perhaps due to structural shifts that are not captured in time-series cross-sectional data. For example, Mikkelson et al., (1997) and Carter et al., (1998) report much lower adjusted R2 ranging between 1 to 4%.
5. Additional tests
We conduct four additional tests to verify the robustness of our main results. First, we examine the marginal impact of foreign ownership on abnormal announcement returns. Second, we test the extent to which the results are robust to the alternative proxy of monitoring effect. Third, we address the possible reverse-causality relation between financial performance and foreign ownership. Finally, we consider the potential influence of multiple equity issuers. For brevity, the results are only outlined.
5.1 The market’s ex-ante reaction to the monitoring benefits of foreign ownership
We analyze the monitoring role of foreign investors by examining the relation between foreign ownership and abnormal returns around the SEO announcement dates. If markets believe that foreign ownership provides monitoring benefits, we should observe a relatively positive reaction to equity issues in firms with higher foreign ownership. We measure abnormal announcement returns as the market-adjusted returns around the announcement dates of equity issues. We use the TSE value-weighted index as a proxy for the market. For the sample of equity issues, the average abnormal returns are cumulated over a three-day interval (-1, +1) around the announcement dates of the event. As a robustness check, we also use the two-day (-1, 0) and five-day (-2, +2) intervals. The results are qualitatively the same. Our findings indicate that pre-issue foreign ownership is positively related to announcement returns, suggesting that the post-issue free cash flow problems that investors are concerned with can be mitigated by the monitoring role of foreign ownership.
5.2 The impact of foreign ownership on investment efficiency of SEO proceeds
We examine whether the monitoring power of foreign ownership makes issuers use the raised funds more efficiency. First, we analyze whether SEO-funds are used in the issuers’ existing core business. Many recent papers (Berger and Ofek, 1995; Gillan et al., 2000) indicate that a diversification strategy has a negative impact on firm value and shareholders’ wealth. The core business should be the firm’s steadiest source of profit. We argue that devoting the funds to businesses outside of the existing core business jeopardizes the firm’s ability to build profit and shareholder wealth. Empirically, we consider SEO funds to be invested in the issuer’s core business when the proportion of the actual funds invested in the existing core business is higher than 70%. The observation period extends to the end of the third year after a SEO.
Second, changes in the expected use of SEO funds may affect financial performance. If the issuers have no feasible projects at all, or the projects laid out in the prospectus are only illusive, then changes in the use of SEO-funds are inevitable and may have a negative impact on the firms’ competitiveness and shareholder wealth. Changes in the use of SEO funds include (a) abandonment of projects laid out in the prospectus or additions of new projects, and (b) changes of investment size for more than 20%. And, in order to eliminate the
small-amount and regular plan adjustment corresponding to the economic environment change, we define that “the SEO investment plan is changed” when the amount changes more than 50%.
Third, many listed firms use SEO funds to repay debt, supplement working capital, finance related parties, or keep as cash on hand. This implies that these SEO firms have no favorable investment projects—the SEO funds are not invested in business but are instead returned to banks and secondary markets. Thus, some SEOs do not improve firms’ long-term growth; they may in fact lower firm values and investor returns.
As discussed earlier, the level of foreign ownership help monitor managers in spending SEO funds at the best interests of shareholders. That is, institutions often prevent firms from spending SEO funds in non-core businesses, changing investment projects subsequently, and misusing funds. The data regarding the use status of SEO funds are hand-collected from prospectuses. However, the prospectus information provided by the SFI online database is only available from 1995, so we only have fund-use information for a subset of our sample. We find that SEO funds are more likely to be invested in core businesses when the number of foreign investors is high, and issuers with higher foreign ownership are less likely to subsequently change their investment plans or under-invest. Overall, a higher level of foreign ownership shows a significant effect on subsequent investment efficiency of SEO firms.
5.3 Taking into account endogenous foreign ownership
Another issue challenging the positive relation between SEO firms’ performance and foreign ownership is the potential endogeneity between ownership and performance (Himmelberg et al., 1999). Briefly speaking, foreign institutions have a propensity to increase or maintain their ownership stakes when a SEO firm is performing well. Conversely, they tend to hold fewer shares when a SEO firm is performing poorly. Thus, Equation (1) possibly contains an endogenous explanatory variable (i.e. FINST). In such cases, using an OLS regression to estimate the parameters may result in biased and inconsistent estimates. We therefore re-examine the relation between foreign ownership and post-issue performance using a two-staged instrumental variable (2SLS) method. The regression set is as follows:
i 7 i 6 i 5 i 4 i 3 i 2 i 1 0
i β β Performance(-1) β RD β MB β LEV β LNTA β SIZE β TECH
FINST = + + + + + + + i i 8AGE φ β + + (2) i 7 i 6 i 5 i 4 3 i 2 i 1 0
i β β FINST β FINST β DINST β RD β LTD β MB β LNTA
e Performanc = + + Δ + + + + + i i 9 i 8TECH β ISIZE μ β + + + (3) where Performance(-1) indicates the abnormal returns to investors for the year before the beginning of the issuing year in the stock performance model, and is the industry-adjusted return on assets in year -1 in Equation (3), the operating performance model. If foreign investors increase their shareholdings of past winners or decrease their holdings of past losers, the coefficient of the lagged performance variable should be significantly positive. AGE is the natural log of firm listing age. Other variables are defined as in Equation (1).
We find that, in Equation (2), foreign ownership at the end of the issuing year is unrelated to the prior year’s stock returns (the coefficient is 0.002 with a t-statistic of 1.21) or operating performance (the coefficient is 0.023 with a t-statistic of 0.85). This indicates that foreign investment is not significantly related to past performance, and that the positive relation between foreign ownership and post-issue performance is not due to the investment tendency of foreign investors to invest in winner stocks. On the other hand, the results of Equation (3) show that the model may have a specification problem. R2 between observed and predicted values is just 5%, implying that foreign ownership may not be endogenous. We conduct a
the critical value of 11.161, suggestting that foreign ownership is not endogenous and the OLS estimations (Equation (1)) are not biased.
5.4 Offering frequency
In the above, we treat each equity issue as individual observation. However, some firms may have multiple issues and long-run performance measures might be sensitive to such identification of SEO observations for multiple issuing firms. To clarify the credibility of our results, we include only the first SEO of a firm within a three-year window, and the sample size is thus reduced. The coefficient of foreign ownership remains significantly positive, in all post-issue holding periods. Last, we examine the impact of foreign ownership for firms that conduct only one issue over the three-year holding period, and we find consistent results.
6. Conclusion
This study examines whether corporate governance can explain the negative long-run stock performance after equity issues in one emerging market: Taiwan. As in many other emerging markets in Asia, the ownership of Taiwanese firms is often concentrated in some families or groups that have more control right than their ownership. Under a concentrated ownership structure, domestic institutional investors are often associated with controlling shareholders and the interests of minority shareholders may therefore not be protected.
Since Taiwan opened its stock markets to foreign investors in 1991, foreign investments have affected the market performance dramatically. Foreign investors have an incentive to monitor managerial actions more closely than domestic institutional investors. They are less associated with controlling shareholders, and thus can make their investment decisions and monitor managerial actions independently. Accordingly, we posit that foreign ownership mitigates the agency problems of free cash flows, provides appropriate monitoring, and optimizes the use of corporate resources for equity-issuing firms. Therefore, foreign ownership should be able to explain the long-run performance after equity issues in Taiwan.
Using a sample of 383 firms conducting SEOs from 1991 to 2002 in Taiwan, we find the evidence consistent with the expectations. SEO firms with higher foreign ownership subsequently outperform those with lower foreign ownership after equity issues. On the other hand, domestic institutions such as family businesses or affiliations show insignificant effects. Moreover, foreign institutions’ monitoring role is reflected in the efficient use of SEO funds. Robustness tests indicate that the positive relation between foreign ownership and long-run performance is not due to sophisticated investment strategies or the momentum propensity of foreign investors. Thus, the governance role of foreign investors is further confirmed.
This study provides an important implication for emerging markets undergoing the transition to open, transparent, and efficient markets. Foreign equity investors can improve the monitoring and discipline of capital markets when domestic institutional investors cannot. Foreign investors play a critical role in the process of capital market liberalization in Taiwan.
Reference
Barber, B.M., Lyon, J.D. (1996) Detecting abnormal operating performance: The empirical power and specification of test statistics. Journal of Financial Economics, 41(3), 359-399. Barber, B.M., Lyon, J.D. (1997) Detecting long-run abnormal stock returns: The empirical
power and specification of test statistics. Journal of Financial Economics, 43(3), 341-372. Berger, P.G., Ofek, E. (1995) Diversification’s effect on firm value. Journal of Financial
Economics, 37(1), 39-65.
Business Today (2005) Stock market report. 445 (July 4), 140-142.
Business Weekly (2004) Wall Street has taken position in Taiwan. 856 (April 19), 76-84. Carter, R., Dark, F., Singh, A. (1998) Underwriter reputation, initial returns, and the long-run
performance of IPO stocks. Journal of Finance, 53(1), 285-311.
Claessens, S., Djankov, S., Lang, L.H.P. (2000) The separation of ownership and control in East Asian corporations. Journal of Financial Economics, 58(1-2), 81-112.
Dahlquist, M., Robertsson, G. (2001) Direct foreign ownership, institutional investors, and firm characteristics. Journal of Financial Economics, 59(3), 413-440.
Gibson, S., Safieddine, A., Sonti, R. (2004) Smart investments by smart money: Evidence from seasoned equity offerings. Journal of Financial Economics, 72(3), 581-604.
Gillan L.S., Kensinger, J.W., Martin, J.D. (2000) Value creation and corporate diversification: The case of Sears, Roebuck & Co. Journal of Financial Economics, 55(1), 103-137.
Hansen, R.S., Crutchley, C. (1990) Corporate earnings and financing: An empirical analysis. Journal of Business, 63(3), 347-371.
Hausman, J.A. (1978) Specification tests in econometrics. Econometrica, 46(6), 1251-1271. Himmelberg, C.P., Hubbard, R.G., Palia, D. (1999) Understanding the determinants of
managerial ownership, the link between ownership and performance. Journal of Financial Economics, 53(3), 353-384.
Huang, I.H., Wang, Y.J., Ho, C.C., Hsu, C.H. (2003) On the beta estimation and cross-sectional analysis of expected stock returns in Taiwan. Journal of Financial Studies, 11(3), 1-32.
Jain, B.A., Kini, O. (1994) The post issue operating performance of IPO firms. Journal of Finance, 49(5), 1699-1726.
Jensen, M.C. (1986) Agency costs of free cash flow, corporate finance, and takeovers. American Economic Review, 76(2), 323-329.
Kennedy, P. (1998) A Guide to Econometrics, 4th edition. The MIT Press, Cambridge.
La Porta, R., Lopez-de-Silanes, F., Shleifer, A. (1999) Corporate ownership around the world. Journal of Finance, 54(2), 471-517.
Lang, L.H.P., Poulsen, A., Stulz, R. (1995) Asset sales, firm performance, and the agency costs of managerial discretion. Journal of Financial Economics, 37(1), 3-37.
Loughran T., Ritter, J. (1997) The operating performance of firms conducting seasoned equity offerings. Journal of Finance, 52(5), 1823-1850.
Loughran, T., Ritter, J. (1995) The new issues puzzle. Journal of Finance, 50(1), 23–51. Lu, K. (2003) An overview of the Taiwanese qualified foreign institutional investor system.
BIS Paper, 15(2), 141-151.
Lyon, J.D., Barber, B.M., Tsai, C. (1999) Improved methods for tests of long-run abnormal stock returns. Journal of Finance, 54(1), 165-201.
McLaughlin, R., Safieddine, A., Vasudevan, G. (1996) The operating performance of seasoned equity issuers: Free cash flow and post-issue performance. Financial Management, 25(4), 41-53.
Mikkelson, W.H., Partch, M.M., Shah, K. (1997) Ownership and operating performance of companies that go public. Journal of Financial Economics, 44(3), 281-307.
Neyman, J., Pearson, E.S. (1928) On the use and interpretation of certain test criteria for purposes of statistical inference. Biometrika, 20(3-4), 175-240.
Richardson, S. (2006) Over-investment of free cash flow. Review of Accounting Studies, 11(2-3), 159-189.
Ritter, J.R., Welch, I. (2002) A review of IPO activity, pricing, and allocations. Journal of Finance, 57(4), 1795-1828.
Seasholes, M.S. (2000) Smart foreign traders in emerging markets. Working paper, Harvard University.
Shleifer, A., Vishny, R.W. (1997) A survey of corporate governance. Journal of Finance, 52(2), 737–783.
Spiess, D.K., Affleck-Graves, J. (1995) Underperformance in long-run stock returns following seasoned equity offerings. Journal of Financial Economics, 38(3), 243-268. Yeh, Y.H., Lee, T.S., Woidtke, T. (2001) Family control and corporate governance: Evidence