國立交通大學
光電工程學系 顯示科技研究所
碩士論文
利用金奈米粒子之電漿效應提升有機太陽能
元件之特性
Plasmonic-Enhanced Organic Solar Cells
Incorporating Gold Nanoparticles
研究生:李佳霖
指導教授:陳方中 博士
元件之特性
學生:李佳霖 指導教授:陳方中 博士
國立交通大學
顯示科技研究所
摘 要
本研究主要在探討在緩衝層中掺雜金奈米粒子之後的有機光伏特元件特 性。我們可以發現,在掺雜金奈米粒子後能使元件的短路電流、填充係數,及功 率轉換效率有明顯的提升,而元件的開路電壓則不受影響。在掺雜金奈米粒子後 能使元件的激子產生率提升,同時激子也能有效的被分離成電子與電洞,因而使 短路電流及填充係數提升有了明顯提升。由於局部表面電漿共振會使局部電場提 升,因此我們推論,激子產生率及激子分離率的提升是來自於局部表面電漿共振 的關係。在掺雜金奈米粒子後能使元件的功率轉換效率從3.48%提升到 4.19%。Incorporating Gold Nanoparticles
Student : Chia-Ling Lee Advisor : Dr. Fang-Chung Chen
Display Institute
National Chiao Tung University
Abstract
In this study, we after investigated the device characteristics of organic photovoltaics (OPVs) incorporating Au nanoparticles (NPs) in the buffer layers. We found that the addition of Au NPs improved the device performances obviously. The short-circuit current (Jsc), the fill factor (FF), and the power conversion efficiency (PCE) were improved while the open-circuit voltage (Voc) remained unchanged. The addition of Au NPs increased the rate of exciton generation and the probability of exciton dissociation, thereby enhancing the short-circuit current and the fill factor. We attribute the improvement in device performance to the local enhancement of the electromagnetic field originating from the excitation of the localized surface plasmon resonance (LSPR). The incorporating of plasmonic Au NPs in the buffer layer resulted in an increase in power conversion efficiency from 3.48% to 4.19%. We have demonstrated that the improvement is due to the presence of the resulting LSPR, not to the change of the conductivity of the buffer layers.
在這兩年的碩士研究生涯中,我受到許多人的幫助,無論是研究內容或是生 活態度上的建議,都令我獲益良多,以此文獻給我由衷感謝的人。 首先,我要感謝指導教授陳方中博士,在兩年的研究中傳授了我許多課業上 的知識以及實驗中的技巧,使我得以突破研究上的困境,讓我在研究上能事半功 倍。除此之外,老師在處事態度上的叮嚀更是深刻的教誨,相信我學到的將會對 我未來有很大的幫助。 感謝志力學長及洪毅,我們就像是三兄弟一樣,時常一起討論在實驗上遇到 的疑問,一起為研究打拼,這兩年的研究過程中讓我收獲很多也很開心。特別要 感謝志力學長,將自己的研究經驗及技巧毫不保留地傳授教導,且在討論過程中 總是以輕鬆愉快的心情解答我實驗上的困惑,在研究上給了我許多指點。 感謝上屆學長,呈祥、煒祺、永軒、政豪、昱仁及信展,在我碩一時帶我熟 悉實驗流程及環境,讓我能很快的進入研究狀況,感謝你們的教導。 感謝上傑、志平、兆峰博班學長,及柄瑞、冠霖、威寬、文哲同屆夥伴,謝 謝大家在實驗上的互相配合及扶持鼓勵,讓每個人都能順利完成研究,並分享研 究上的成果,謝謝你們,一起問實驗奮鬥的感覺真的很棒。 感謝實驗室學弟們,名凱、宗翰、宗達、浩智、紹棠,有你們的加入,讓實 驗室充滿更多歡笑氣氛與活力,多虧你們處理實驗室的大小事務,讓我們能心無
最後,我要感謝最親愛的父親、母親及哥哥,在求學過程中,你們一直都是 我最大的精神支柱,不斷的給我鼓勵及給我無憂無慮的環境,才使我得以順利完 成學業。在此,將此研究成果獻給所有幫助過我的人,謝謝你們!!
摘 要 ... I ABSTRACT...II ACKNOWLEDGEMENT... III TABLE OF CONTENTS...V LIST OF FIGURES AND TABLES ...VII
1. INTRODUCTION TO ORGANIC PHOTOVOLTAIC DEVICES (OPVS) ..1
1.1 DEVELOPMENT OF OPVS...1
1.2 WORKING PRINCIPLE OF OPVS...6
1.3 STRUCTURE OF OPVS...9
1.4 MODELING OF OPVS...12
1.4.1 Equivalent circuit of solar cells ...12
1.4.2 Fundamental characteristics of solar cells...14
1.5 SOLAR SPECTRUM...17
2. INTRODUCTION TO SURFACE PLASMON ...19
2.1 DEVELOPMENT OF SURFACE PLASMON...19
2.2 BASICS OF SURFACE PLASMON...20
2.6 APPLICATION OF METAL NANOPARTICLES...29
2.7 MOTIVATIONS...30
3. EXPERIMENTAL ...32
3.1 MATERIALS...32
3.1.1 Substrate (ITO glass) ...32
3.1.2 Buffer layer ...32
3.1.2.1 PEDOT:PSS ...32
3.1.2.2 Gold nanoparticles ...34
3.1.3 Active layer (P3HT:PCBM) ...36
3.2 DEVICE FABRICATION...38
3.2.1 ITO substrate cleaning...38
3.2.2 Spin coating of buffer layer...38
3.2.3 Spin coating of active layer...40
3.2.4 Cathode electrode deposition...40
3.3 DEVICE CHARACTERIZATION...42
4. RESULT AND DISCUSSION ...43
4.1 DEVICE PERFORMANCE...43
4.2 THE IPCE CURVES AND ABSORPTION SPECTRA...49
4.3 GENERATION RATE AND DISSOCIATION PROBABILITY...52
5. CONCLUSION ...56
Figures
Figure 1.1 The first PN junction OPV fabricated by Yang in 1986. Device structure (a), current density-voltage characteristic (b), chemical structure of donor and acceptor (c), (d). ...2 Figure 1.2 The device energy level by using exciton-blocking layer (EBL) concept. .3 Figure 1.3 The schematic description of the working principle of OPVs, which
includes (1) Light absorption, (2) Exciton generation, (3) Exciton diffusion, (4) Exciton dissociation, (5) Charge transport, and (6) Charge collection. ...6 Figure 1.4 The schematic description of the bilayer heterojunction structure in the
photovoltaic devices. ...10 Figure 1.5 The schematic description of the bulk heterojunction structure in the
photovoltaic devices. ...11 Figure 1.6 Equivalent circuit diagram for a typical solar cell. ...12 Figure 1.7 The current density-voltage characteristics of a solar cell under
illumination...14 Figure 1.8 Solar irradiation spectra for AM 0, AM 1.0, and AM 1.5 illumination...18 Figure 1.9. Solar spectral photon flux for AM 0 and AM 1.5 sunlight...18 Figure 2.1 (a) The electromagnetic wave of surface plasmon between a metal and a dielectric material. (b) The dispersion curve for a surface plasmon mode.
...21 Figure 2.2 Surface plasmon wave is an evanescent wave in parallel and perpendicular
of the conduction electron charge cloud relative to the nuclei. ...24 Figure 2.4 An incident light wave excites a dipole surface plasmon on a spherical
metal nanoparticle...25 Figure 3.1 Chemical structure of PEDOT(left) and PSS(right)...33 Figure 3.2 (a) Au nanoparticle solution we used. (b) SEM of the Au nanoparticles. (c) The absorption spectrum of the Au nanoparticle solution...35 Figure 3.3 Chemical structures of the materials used in the polymer solar cells,
containing (a) poly(3-hexylthiophene) (P3HT) and (b) [6,6]-phenyl C61-butyric acid methyl ester (PCBM)...36 Figure 3.4 The SEM image of (a) pristine PEDOT:PSS and (b) PEDOT:PSS with
doping 20% Au NPs solution ...39 Figure 3.5 (a) The schematic structure of OPVs and (b) the picture of the device in this study. ...41 Figure 4.1 The structures of the reference device and the device doped with Au
nanoparticles...43 Figure 4.2 J–V characteristics of OPVs with different concentration of doped Au
nanoparticles solution:without doping (■); with 10% Au NPs solution doping (●); with 20% Au NPs solution doping (▲); with 30% Au NPs solution doping (▼). All devices were measured under illumination of 100 mW/cm2 (AM 1.5) and room temperature...45 Figure 4.3 The power conversion efficiency (PCE) of the devices prepared with
different concentrations of Au NPs...46 Figure 4.4 The AFM images show the surface morphology of (a) the pristine
PEDOT:PSS and doping with different concentration of Au NPs solution: (b) 10%, (c) 20%, and (d) 30%...48
Figure 4.6 Absorption spectra of Au NPs embedded in the PEDOT:PSS matrix (solid line) and in solution (dashed line). A neat PEDOT:PSS film was used as the baseline for measurement of the absorption of the PEDOT:PSS composite films...51 Figure 4.7 Plots of photocurrent density (Jph) with respect to the effective bias (Veff)
for devices incorporating pristine PEDOE:PSS and PEDOT:PSS containing 20% Au NP solution. ...53 Figure 4.8 Plots of Jph/ Jsat for devices incorporating pristine PEDOE:PSS and
PEDOT:PSS containing 20% Au NP solution. ...54
Tables
Table 1. Summary of the characteristics of PEDOT:PSS, depending on the ratio of PEDOT to PSS. ...33 Table 2. The performance of ITO/PEDOT:PSS/P3HT:PCBM/Ca/Al photovoltaic
devices with different concentration of Au NPs solution under illumination of 100 mw/cm2 (AM 1.5). ...47
1. Introduction to organic photovoltaic devices (OPVs)
1.1 Development of OPVs
In 1986 [1], the first organic photovoltaic devices (OPVs) was reported by Tang. It the device copper phthalocyanine (CuPc) as the donor material and perylene tetracarboxylic derivatives (PV) as the accepter material to create the bilayer heterojunction structure (Fig.1.1). The main drawback of this structure is the low dissociation probability due to the small donor-acceptor interfacial area. In order to solve this problem, the concept of bulk heterojunction (BHJ) was reported by Yu et al. firstly in 1994 [5]. They used poly(2-methoxy-5-(2’-ethylhexyloxy)-1,4-phenylene vinylene) (MEH-PPV) as the donor and fullerene molecules (C60) as the acceptors to fabricate polymer photodiodes exhibiting a photosensitivity of 5.5 mA/W. This value is an order of magnitude large than that of the device made of pristine polymers. C60 has been proposed to be one of commonly used acceptor materials due to its high electron affinity as well as the relatively long exciton diffusion length (LD~40nm) [6,7]. However, the soluble C60 derivative, typically [6,6]-phenyl C61-butyric acid methyl ester (PCBM) has been developed to replaced C60 because of its high solubility [8].
(a) (b)
(c) (d)
Figure 1.1 The first PN junction OPV fabricated by Yang in 1986 [1]. Device structure (a), current density-voltage characteristic (b), chemical structure of donor and acceptor (c), (d).
In 1995, Yu et al. fabricated organic photovoltaic cells consisting of a layer of MEH-PPV : PCBM blend sandwiched between the ITO anode and calcium (Ca) cathode [8]. The cells showed an excellent power conversion efficiency (PCE) of
2.9% under 20 mW/cm2 illumination at 430 nm. The comparison between the bilayer heterojunction and bulk heterojunction structures will be expressed in greater detail later on.
In 2000, Peumans et al. introduced the concept of exciton-blocking layer (EBL) for improving the device performance [9]. An exciton-blocking layer with a large energy bandgap of 3.5 eV can effectively prevent exciton quenching at the interface between the silver (Ag) cathode and organics due to the blocking of exciton diffusion. Besides, the presence of such a can provide a spacer which protects the underlying organic from the damage caused by deposition and enhance the light intensity at the donor-acceptor interface due to the spatial redistribution of optical field. In the device of ITO/CuPc/PTCBI/BCP/Ag, as in Fig.1.2, a PCE of 2.4±0.3% was achieved. Later, the authors replaced PTCBI with C60 and deposited Al as the cathode; the device exhibited a PCE of 3.6±0.2% [10].
Figure 1.2 The device energy level by using exciton-blocking layer (EBL) concept [9].
In 2005, Xue et al. inserted a mixed layer of donor and acceptor molecules between two the donor layer and the acceptor layer to form the structure of hybrid planar-mixed molecular heterojubction (PM-HJ) and successfully improved the PCE of hybrid PM-HJ photovoltaic cells to 5.0±0.3% [6]. The authors demonstrated the enhancement, its because the thickness of each homogenous layer is approximately lose to LD, exciton generated across the entire heterojunction structure have a high probability of diffusing to a nearby interface of donor and acceptor. Efficient exciton dissociation occurs throughout the mixed layer as well as at the interfaces between the mixed layer and the adjacent homogeneous layers. The state-of-art of high efficiency polymer-based photovoltaic cells are fabricated based on the BHJ structure which is consist of a light absorbing polymer as a donor and a soluble C60 derivative as an acceptor, typically poly (3-hexylthiophene) (P3HT) and [6,6]-phenyl C61-butyric acid methyl ester (PCBM). In the same year, Li et al. demonstrated that slow growth of the P3HT:PCBM film can strongly enhance the degree of polymer self-organization, reducing the device series resistance [12]. After spin-coating, the wet active layer was transfered into a glass Petri dish for slow drying. Before the deposition of the cathode, the active layer was thermally annealing at 110℃ for 15 minutes. After thermally annealing, the PCE can be enhanced to 4.4%. In the same year, the post-annealing treatment was applied in OPVs to improve the device performance by Reyes et al. and Ma et al. The PCE for the post-annealed devices was improved up to 5% [13,14].
In 2006, Kim et al. used titanium oxide (TiOx) as an optical spacer to tune the spatial distribution of optical intensity inside the device, giving rise of the enhancement of light absorption [15]. In the device of
short-circuit current is 11.1 mA/cm2, the fill factor is 0.66, and the corresponding PCE is 5.0%.
In 2007, Ko et al. reported an approach to reduce the series resistance and that improve the device performance of OPVs [16]. They doped mannitol, an isomer of sorbitol, into the buffer layer of PEDOT:PSS. After doping, both the series resistance of OPVs and the resistivity of PEDOT:PSS were significantly reduced. Under the optimum dopping condition (60 mg/ml mannitol in PEDOT:PSS), the PCE was improved from 4.5% to 5.2%. In the same year, Heeger et al. reported tandem polymer solar cells fabricated by all-solution processing. They used a tandem structure, which is inverted structure containing a low band-gap polymer-fullerene composite as the charge-separating layer in the front cell and the other high band-gap polymer blended with C60 derivatives in the back cell. The performance of the polymer tandem solar cell is summarized as follows, Jsc is 7.8 mA/cm2, Voc is 1.24 V, FF is 0.67, and PCE is 6.5%. Power conversion efficiencies of more than 6% were achieved [17].
1.2 Working principle of OPVs
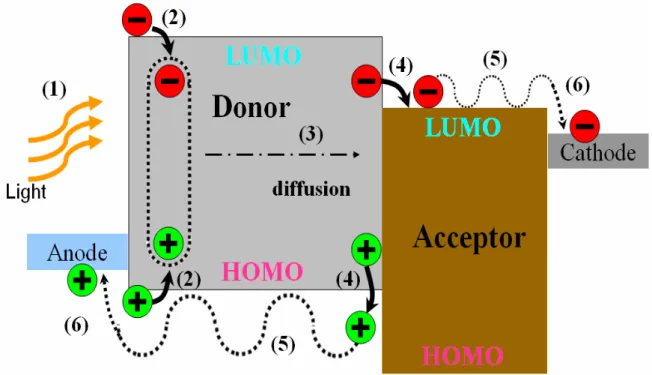
The processes of the conversion of photons into free carriers in OPVs were described as followings [18,19]. For more detail describes the working principle for OPVs, it can be simply expressed as six steps, which are shown in Fig. 1.3 [35]:
Figure 1.3 The schematic description of the working principle of OPVs, which includes (1) Light absorption, (2) Exciton generation, (3) Exciton diffusion, (4) Exciton dissociation, (5) Charge transport, and (6) Charge collection.
(1) Light absorption:The first step of the photovoltaic effect is light absorption. The requirement for this step is the energy matching condition. It means that the
incident photo energy. For organic photovoltaic cells, the energy gap corresponds to the energy difference between the lowest unoccupied molecular orbital (LUMO) and the highest occupied molecular orbital (HOMO). Typically, the light absorption length (LA) is 50~100nm [6].
(2) Exciton generation:After the light absorption, a Coulomb-attracted electron-hole pair, which is called exciton, is generated. The exciton is in an excited but neutral state. The bonding energy of exciton which is the energy required to separate the electron from the hole [21].
(3) Exciton diffusion:Once the exciton is generated, it can diffuse through the material. Meanwhile, it may decay or be trapped during the diffusion process. The average distance of exciton can travel within its lifetime is defined as the exciton diffusion length (LD). Typically, the LD range from 5nm to 70nm for excitons in organics [7].
(4) Exciton dissociation:If the LD is sufficiency long so that the exciton can meet the interface between electron donors and acceptors. Since the donor material possesses a lower ionization potential (IP) and the acceptor material has a higher electron affinity (EA), the electrons subsequently transfer from the donor to the acceptor. Accordingly, the exciton dissociates into free carriers.
(5) Charge transport : After dissociation, these photo-generated free holes and electrons are then transport through the donor and acceptor materials, respectively. This process usually involves the hopping mechanism. Moreover, the free carrier may also recombines or be trapped in the defect sites. Both recombination and
trapping are therefore believed to contribute to the carrier loss.
(6) Charge collection:When the free carriers arrive at the interface between the electrodes and organics, they would be collected by the electrodes and enter the outer circuit. It is believed that an ohmic contact can effectively improve the efficiency of charge collection and thus improve the device performance.
1.3 Structure of OPVs
Organic single layer devices usually consist of a thin organic layer, sandwitched by two metallic electrodes of different work functions. They were two kind of single structure, including bilayer and bulk heterojunction of single layer device.
The bilayer heterojunction structure consist of a donor layer and an acceptor layer sandwiched by an anode and an cathode (Fig.1.4). Although the bilayer heterojunction structure provides the better paths for the charge transport, the exciton dissociation would be a big problem. As stated above, an exciton can dissociate into free carriers only when it meats the donor-acceptor interface. Consequently, only the excitons created near the donor-acceptor interface can contribute to the photocurrent owing to the short diffusion length (LD) for the excitons in organic semiconductors [22]. This leads to large losses of photons absorbed by donor or acceptor materials far away from the interface and thus limits the efficiency of the bilayer solar cell drastically.
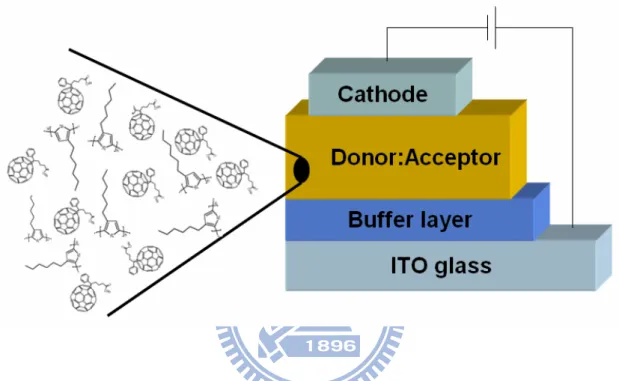
In order to maximize the dissociation probability of excitions, the interfacial area of the donor-acceptor interfaces needs to be increased. This can be achieved by using the bulk heterojunction (BHJ) concept, as illustrated in Fig.1.5 [5,9,10], where the donors and acceptors form a three dimensional network. Hence, the main advantage of the BHJ over the bilayer heterojunction is the tremendous increase of the interface area between donor and acceptor. Nowadays, most efficient OPVs are fabricated based on the BHJ structure [13,16]. However, the nanomorphology of the donor-acceptor blend in the BHJ structure governs the dissociation probability of excitons as well as the collection efficiency of free carriers, thus becoming a key issue
to the performance of organic solar cells [23].
Rather than using a single junction architecture, the fundamental BHJ concept involves the self-assembly of nanoscale heterojunctions by spontaneous phase separation of the donor (polymer) and the acceptor (fullerene). As a result of this spontaneous phase separation, charge-separating heterojunctions are formed throughout the bulk of the material.
Figure 1.4 The schematic description of the bilayer heterojunction structure in the photovoltaic devices.
Figure 1.5 The schematic description of the bulk heterojunction structure in the photovoltaic devices.
1.4 Modeling of OPVs
1.4.1 Equivalent circuit of solar cells
A equivalent circuit diagram (ECD) is usually used to describe the electric behavior of complex devices in term of basic ideal components such as current or voltage sources, resistors, diodes, and capacitors. Figure 1.6 shows the ECD typically used for inorganic solar cells. Since the physical mechanisms are basically the same for organic and inorganic solar cells, the ECD can be applied to organic devices, even though the specific physical processes are still different in many respects. The components can be described as followings [34]:
Figure 1.6 Equivalent circuit diagram for a typical solar cell.
(1) The current source (G) generates a photo current (IG), which is resulted from
the dissociation of exciton into electrons and holes after photon absorption. IG does not take into account any recombination but only depends on the
(2) The shunt resistor (Rsh) is govered by the lateral leakage current, which is
probably due to the recombination of electrons and holes near the exciton dissociation sites.
(3) The series resistor (Rs)takes into account the mobility of charge carriers in
the bulk of the solar cell. The mobility will be influenced by defects as well as space charges in the device. Rs increases with thickness of the device since
the distance that the charges have to travel increases.
(4) The diode (D) describes the asymmetric conductivity in the solar cell. In inorganic devices, this is due to the p-n junction and its blocking behavior in one current direction. In organic cells, it is due to a blocking contact as the semiconductor/electrode interfaces or a built-in electric field resulting from a donor-acceptor interface.
(5) The resistor (RL) results when the solar cell is contacted by an external load.
Alternatively, a source-measure unit can be connected to measure the I-V characteristics of the solar cell.
For an ideal solar cell, Rsh would be infinitely large and Rs would be zero. For
inorganic cells, typical value of Rsh is large than 1000 Ohms and Rs is typically a few
Ohms. These value can be significantly different in organic devices since the mobility is usually lower and charge recombination can be an issue.
1.4.2 Fundamental characteristics of solar cells
The typical current-voltage characteristic of a solar cell are shown in Fig. 1.7. There are five important parameters which describe the cell characteristics, open-circuit voltage (VOC), short-circuit current (JSC), fill factor (FF), power conversion efficiency (PCE), and incident photon to current conversion efficiency (IPCE).
Figure 1.7 The current density-voltage characteristics of a solar cell under illumination.
Open-circuit voltage (Voc) is the maximum voltage could be obtained, which is measured by connecting the illuminated solar cell to a voltmeter. In Fig. 1.7, the intersection of the curve with x-axis (voltage-axis) is called the open-circuit voltage, Voc.
Short-circuit current (Jsc) is the maximum current could be obtained under a given illumination power without an external voltage source connected. It is measured by connecting both electrodes to an ammeter. In Fig. 1.7, the intersection of the curve with y-axis (current-axis) is referred as the short-circuit current, Jsc.
VMP and JMP are the voltage and current at the point of maximum output power (Pout) of the device, respectively. VMP and JMP can be determined by calculating the output power of the device at each point between Voc and Jsc. Fill factor (FF) is the ratio of the rectangles given by the maximum power point of VOC and JSC. Therefore, the FF is defined as SC OC MP MP SC OC out J V J V J V P FF × × = × =
The theoretical value of FF are between 0.25 (ohmic non-rectifying behavior of the solar cell) and 1.
Power conversion efficiency (PCE) is the overall efficiency of the device, which is defined as the ratio of the electric output power of the cell at the maximum power point to the incident optical power. PCE can be expressed as
in SC OC in out P FF J V P P PCE = = × ×
Apart from PCE, the incident photon to current conversion efficiency (IPCE) is often used, which also known as the external quantum efficiency (EQE). The IPCE compares the number of charge carriers collected at zero bias to the number of incident monochromatic photons. Measuring the IPCE at different wavelength result in a spectral response of the cell. Owing to the JSC is not necessarily increases linearly with the incident light power, the absolute IPCE is depended on the incident light power of the monochromatic light. Therefore, the IPCE is defined as
λ λ λ λ λ × × × = = ) ( ) ( 10 24 . 1 ) ( ) ( 5 in SC P J EQE IPCE
The efficiency should be measured under standard conditions because of the wavelength and light intensity depend on the photovoltaic response. The standard measure conditions include the room temperature of the cell (25℃), the light intensity (100 mW/cm2), and the spectral distribution of light (AM 1.5) [27].
1.5 Solar spectrum
In the case of polychromatic efficiencies such as the power conversion efficiency and the current efficiency, it is crucial to use a well-defined and reproducible light spectrum. The AM-solar spectra are certainly the standard light spectra for outdoor photovoltaic applications [28]. According to the incident angle from the zenith, different kinds of solar spectral are defined, as illustrated in Fig. 1.8.
The AM 0 spectrum stands for the solar spectrum without passing through the atmosphere with an incident angle of 0° from the zenith. The spectra of solar radiation through the atmosphere with the incident angles of 0°, and 48.2° are defined as AM 1.0 and AM 1.5.
The solar spectral photon flux of the AM 0 and the global AM 1.5 spectra are shown in Fig. 1.9.
Figure 1.8 Solar irradiation spectra for AM 0, AM 1.0, and AM 1.5 illumination [28].
2. Introduction to surface plasmon
2.1 Development of surface plasmon
Metal nanoparticles have mainly been studied because of their unique optical properties. The electromagnetic properties of the interface between metal and dielectric have attracted scholar research since the work of Mie and Ritchie for small particles and flat interface, respectively.
In 1908, Mie was the first person who described surface plasmon (SP) quantitatively by solving Maxwell’s equation with the appropriate boundary conditions for spherical particles that describes the extinction spectra (extinction= scattering + absorption) of spherical particles of arbitrary size [2]. For the nanoparticles, the optical absorbance spectrum has been obtained by directly solving Maxwell’s equations for scattering of electromagnetic waves by spherical objects as carried out by Mie. The Mie theory has the advantage of being conceptually simple and has found wide applicability in explaining experimental results [25].
Surface plasmon were widely recognized in the field of surface science following pioneering work of Ritchie in the 1950s [1]. The surface plasmons are waves that propagate along the surface of a conductor, which is usually a metal, these are essentially light wave that are trapped on the surface because of their interactions with the free electrons of conductor.
2.2 Basics of surface plasmon
The properties of nanoparticles have been of interest for centuries, and scientific research on metal nanoparticles dates at least to Michael Faraday.
Solving Maxwell’s equations under appropriate boundary conditions yields the SP dispersion relation, that is, the frequency-dependent SP wave-vector,
k
sp ,m d m d o sp
k
k
=
ε
ε
+ε
ε
where
k
ois a free-space wave vector,ε
m is the frequency-dependent permittivity of themetal;
ε
d is the permittivity dielectric material. This condition is satisfied for metals becauseε
m is both negative and complex. The position of the plasmonic resonance0
/ 2π k
λ = for normal incidence of light upon a grating can roughly be estimated by the following relation: m d m d o
k
d
ε
ε
ε
ε
π
+=
2
Where d is the period of the grating. To trigger a surface plasmon between metal and dielectric interface with a period nanostructure it is further essential that the aspect ratio of the metal structure.
Figure 2.1 (a) The electromagnetic wave of surface plasmon between a metal and a dielectric material. (b) The dispersion curve for a surface plasmon mode.[4]
SPs at the interface between a metal and a dielectric material have a combined electromagnetic wave and surface charge character as shown in Figure 2.1(a). They are transverse magnetic in character (H is in the y direction), and the generation of surface charge requires an electric field normal to the surface. This combined character also leads to the field component perpendicular to the surface being enhanced near the surface and decaying exponentially with distance away from it.
Figure 2.1(b), shows dispersion curve for a SP mode and the momentum mismatch problem that must be overcome in order to couple light and SP modes. The SP mode always lying beyond the light line; that is, it has greater momentum, hksp, than a free space photon,
o
k
h , of the same frequency, ω .
(b)
(a)
2.3 Surface Plasmon resonance (SPR) in thin films
When light shoots on a metallic thin film, some light will be reflected from the metal surface. Some light will not be reflected but might be extremely absorbed or trapped on the surface of the metal and this occurrence of the phenomenon is caused by surface plasmon resonance (SPR). This phenomenon is related to surface morphology, light frequency, properties of medium adjacent to the metal and the, properties of the metal.
Figure 2.2 Surface plasmon wave is an evanescent wave in parallel and perpendicular direction [4].
The SPR introduces non-linear enhancement of the electric field locally based on the interaction between light and matter. The fields associated with the surface plasmon not only attenuate in the propagation direction due to losses arising from absorption in the metal, but also in the direction extending to the media adjacent to the surface, as shown in Figure 2.2. This character leads to the field component perpendicular to the surface being enhanced near
direction is said to be evanescent, reflecting the bound, non-radiative nature of surface plasmon, and prevents power from propagating away from the surface. In the dielectric medium above the metal, typically air or glass, the decay length of the field, δd, is of the
order of half wavelength of light involved[4].
This attenuation depends on the dielectric function of the metal at the oscillation frequency of the SP. The attenuation along the interface depends on the dielectric function of the metal at the frequency of the surface palsmon polariton. The propagation length, δsp, is defined as 2 2 1 2 3 1 1
ε
ε
ε
ε
ε
ε
ω
δ
⎟⎟
⎠
⎞
⎜⎜
⎝
⎛ +
=
m m spc
Where ε and 1 ε are real and imaginary part of the dielectric constant of the metal, and 2
m
ε is that of surrounding materials. For example, silver is the metal with the lowest losses in the visible spectrum, propagation length are typically in the range 10–100 nm. [4].
2.4 Dipole surface plasmon resonance
When a small spherical metallic nanoparticle is irradiated by light, the oscillating electric field causes the conduction electrons to oscillate coherently. This is schematically pictured in Figure 2.3. When the electron cloud is displaced relative to the nuclei, a restoring force arises from Coulomb attraction between electrons and nuclei that results in oscillation of the electron cloud relative to the nuclear framework. The oscillation frequency is determined by four factors: the density of electrons, the effective electron mass, and the nanoparticles shape and size of the charge distribution. The collective oscillation of the electrons is called the dipole plasmon resonance of the particle (sometimes denoted “dipole particle plasmon resonance” to distinguish from plasmon excitation that can occur in bulk metal or metal surfaces). [2]
Figure 2.3 Schematic of plasmon oscillation for a sphere, showing the displacement of the conduction electron charge cloud relative to the nuclei [2].
We assume that conduction electrons are free moving and the corresponding positive charge are fixed in position, so we can estimate the resonance frequency of a surface plasmon
electron cloud
electric field, E
on a spherical metal nanoparticles. Figure. 2.4 shows the nanoparticle which is placed in an electric field and the electrons are displaced from the fixed positive charge. The resonance frequency of oscillation is due to the restoring force of the positive and negative charges.
Figure 2.4 An incident light wave excites a dipole surface plasmon on a spherical metal nanoparticle [19].
Such quasistatic theories have historically only considered dipole plasmon resonance effects, but Kelly et al. have demonstrated that they can be generalized to quadrupole resonances. Although quadrupole resonances are mostly known for spherical and nearly spherical particles, they have demonstrated that they are surprisingly important for triangular prisms.[2]
2.5 Light scattering by metal particles
Owing to the collective oscillation of the conduction electrons in the metal, metal nanoparticles have strong scattering of light at wavelengths near the plasmon resonance. For particles, which with diameters below the wavelength of light, a point dipole model describes the absorption and scattering of light well. The scattering and absorption cross-sections
equation are given by
α
λ
π
π
2 42
6
1
⎟
⎠
⎞
⎜
⎝
⎛
=
scatC
,[ ]
α
λ
π
Im
2
=
absC
Eq. (1) Where⎥
⎥
⎦
⎤
⎢
⎢
⎣
⎡
+
−
=
2
/
1
/
3
m p m pV
ε
ε
ε
ε
α
Eq. (2)is the polarizability of the particle. Here V is the particle volume, εpis the dielectric function
of the particle andεmis the dielectric function of the embedding medium. The particle polarizability will become very large whenεp =−2εm. This is known as the surface plasmon resonance. At the surface plasmon resonance, the scattering cross-section can well exceed the geometrical cross section of the particle. For example, a small silver nanoparticle in air has a scattering cross-section that is around ten times the cross-sectional area of the particle at resonance.
The red-shift and broadening of the surface plasmon resonance with increased particle size would generally be expected to be an advantage for solar cell applications, since light-trapping should occur over a relatively broad wavelength range and at wavelengths that are long compared with the quasistatic values of the surface plasmon resonance wavelengths of noble metal particles.
Particle shape also plays an important role in the effect of metal nanoparticles on a photovoltaic device. Particle shapes such as disks that have a large fraction of their volume close to the semiconductor can lead to a very high fraction of light scattered into the substrate. Conversely, Sundararajan et al. have shown that aggregating of nanoparticle can lead to a reduction of photocurrent, a point that must be considered in colloidal fabrication of nanoparticle assemblies. They have also shown that nanoshells can lead to optical vortexing, which resulted in a reduction in photo-generated current [3].
For metals with low interband absorption, the dielectric function can be described by the Drude model, which describes the response of damped, free electrons to an applied electromagnetic field of angular frequency, ω,
γω ω ω ε i p + − = 2 2 1 Eq. (3)
Here ωp is the bulk plasmon frequency, given by
0 2 2 ε ω m Ne
p = , where N is the density of
free electrons, e is the electronic charge, m is the effective mass of an electron andε0is the free-space dielectric constant. Inserting Eq. (3) in Eq. (2) leads to (in free space)
γω ω ω ω α i V p p − − = 2 2 2 3 3 Eq. (4)
Thus the surface plasmon resonance frequency for a sphere in free space occurs at
p
sp ω
ω = 3 , and mainly depends on the density of free electrons in the particle. The density of free electrons is highest for aluminum and silver, leading to surface plasmon resonances in
the ultra-violet, and lower for gold and copper, leading to surface plasmon resonances in the visible. The resonance frequency can be tuned by varying the dielectric constant of the embedding medium: a higher index leads to a red-shift of the resonance.[3]
2.6 Application of metal nanoparticles
The recent development of metal nanoparticles with surface plasmon excitation has been used to improved the performance of both silicon devices and organic solar cell devices. For noble metal particles in the dimension range of 10–100 nm, surface plasmon resonance occurs at wavelengths in the visible and near infrared regions of the electromagnetic spectrum. Greatly enhanced optical absorption and scattering occurs at these surface plasmon resonance wavelengths.
Therefore, surface plasmon resonances in metal nanoparticles are of interest for a variety of applications including ultrafast optical switches, optical tweezers, labels for biomolecules, optical filter, biosensors, surface enhanced spectroscopies, chemical sensors, near-field optical microscopy, light-emitting diodes, electrochromic devices, and solar cells due to the large electromagnetic field enhancement near the metal surface and strong dependence of the resonance wavelength on size, shape, and local dielectric environment of the metal nanostructures.
2.7 Motivations
The power conversion efficiency of organic solar cells is defined as the ratio of the number of carriers swept into the external circuit to the number of photons absorbed in the organic material and could be represented further as follow [18,20]:
CC CT ED A t ex η η η η η = × × ×
where absorption efficiency (η ) is defined as the ratio of the number of excitons generated A to the number of photons absorbed in the organic material. The exciton diffusion efficiency (η ) is the ratio of the number of excitons diffused to dissociation interface to the number ED of excitons generated. The charge transfer efficiency (ηCT) is defined as the probability that photogenerated excitons could be dissociated into bound electron-hole pairs in the interface. Finally, the carrier collection efficiency (ηCC) defines as the ratio of the number of charge carriers which reach the electrode to the number of bound electron-hole pairs generated in the interface.
To optimizedη , which is a material intrinsic property, one can shift the most intense A
part of the spatially profile of optical field intensity to the most efficient exciton dissociation region by proper device design. The charge transfer efficiency (ηCT ) affects external quantum efficiency (ηext) little in general. In contrast to the ηCT, the situation is more
complicated when we discuss the case of the carrier collection efficiency (ηCC). As we mentioned before, this bound electron-hole pair can either decay to the ground state or dissociate into free carriers.
the light absorption from incorporating gold nanoparticles. Because the metallic nanoparticles have strong interaction with visible light and induce localize surface plasmon resonance (LSPR), they will lead to the local enhancement of the electromagnetic field, and it probably enhances light harvesting and improves the performance of the devices.
In this study, we investigate the device performance after blending Au nanoparticles. The enhancement mechanism is also studied.
3. Experimental
3.1 Materials
3.1.1 Substrate (ITO glass)
Indium tin oxide (ITO) has many desirable properties such as good electrically conductivity (low surface resistance) and ITO glass is a transparent and near colorless material (optically transparent), high VIS-NIR light transmission, low roughness, uniform transmission homogeneity and good barrier properties towards molecular oxygen [29]. Therefore, it is a commonly used as transparent electrodes and conductive materials.
The thickness of the ITO glass in our organic solar cell is 0.7 cm, in which the ITO-layer thickness is 170 nm. The surface resistivity is 10 Ω/□., and the work function is 4.7 eV.
3.1.2 Buffer layer
3.1.2.1 PEDOT:PSS
Poly (3,4-ethylendioxythiophene) (PEDOT:PSS) doped with poly(styrenesulfonate) is the buffer layer material (Fig. 3.1), which was purchased from H. C. Starck. PEDOT:PSS is a stable, water soluble, high p-doped conjugated
transparency throughout the visible region. On the other hand, PEDOT:PSS exhibits a rather high work function, which can reduce the hole-injection barrier. This buffer layer also can smooth the surface of ITO layer. Therefore, PEDOT:PSS can serves as the hole conducting and electron blocking layer.
The characteristic of PEDOT:PSS governed by the ratio of PEDOT to PSS, which are summary in Table 1. In this study, we select PEDOT:PSS (Al 4071) as a buffer layer since high conductivity is required for photovoltaic devices.
Figure 3.1 Chemical structure of PEDOT(left) and PSS(right) [30].
Table 1. Summary of the characteristics of PEDOT:PSS, depending on the ratio of PEDOT to PSS.[32,33]
Ratio (PEDOT:PSS) Conductivity (S/cm) Work function (eV)
Al 4071 1:2.5 1 4.75
Al 4083 1:6 10-3 4.85
3.1.2.2 Gold nanoparticles
A large number of methods for the preparation of metal nanoparticle films have been developed, including vapor deposition, electrochemistry, laser ablation, citric reduction, wet chemical synthesis, gold cluster formation, self-assembly of nanoparticle arrays, electron beam lithography, scanning tunneling microscopy assisted nano-structure formation, and nanosphere lithography.
We choose Au nanoparticle not only because it is not oxidized easily in the air compared to other metals which can generate surface plasmon resonance (SPR) easily, such as copper and silver, but also due to its obvious SPR phenomenon.
The gold nanoparticles were supplied by Prof. Michael H. Huang’s group in National Tsing Hua University. The gold nanoparticle solution was prepared
following the procedures describe in reference [31]. Au nanoparticls solution we used is red as shown in Fig. 3.2 (a). The diameter we choose is ~ 20~30nm, which was measured by scanning electron microscope (SEM), shown in Fig. 3.2 (b). The
absorption peak of gold nanoparticle solution located at ~ 520nm as shown in Fig. 3.2 (c). The density of Au NPs solution is ~ 1012 number/ml.
(a) (b)
400
600
800
1000
1200
0.0
0.2
0.4
0.6
Absorbance
Wavelength(nm)
Au Particles
(c)Figure 3.2 (a) Au nanoparticle solution we used. (b) SEM of the Au nanoparticles. (c) The absorption spectrum of the Au nanoparticle solution.
3.1.3 Active layer (P3HT:PCBM)
Poly(3-hexylthiophene) (P3HT) was obtained from Rieke Met. Inc. The chemical structure is shown in Fig. 3.3(a). It is widely used as a donor material in organic photovoltaics. The highest occupied molecular orbital (HOMO) is 4.8eV and lowest unoccupied molecular orbital (LUMO) is 2.7eV. The side-chains induce self-organization in P3HT, resulting in higher hole mobility than any other known conjugated polymers.
[6,6]-phenyl-C61-butyric acid methyl ester (PCBM) was purchased from Nano C. The chemical structure is shown in Fig. 3.3(b). It is a highly soluble derivative of C60 and behaves, as an electron acceptor material in OPVs. PCBM can be dissolved in many organic solvents due to its side chain attachment. The HOMO and LUMO of PCBM are 6.1eV and 3.8eV, respectively.
Figure 3.3 Chemical structures of the materials used in the polymer solar cells, containing (a) poly(3-hexylthiophene) (P3HT) and (b) [6,6]-phenyl C61-butyric
We used the active layer blend consisting of P3HT and PCBM. They were dissolved in 1, 2-dichlorobenzene (DCB). The weight ratio of 1 : 1 at a concentration of 1.7 wt%. The blend was then stirred at 40 for at least 12 hours i℃ n the glove box filled with nitrogen (less than 1 ppm O2 and less than 1 ppm H2O) since most organics are susceptible to degradation in presence of water and oxygen.
3.2 Device fabrication
3.2.1 ITO substrate cleaning
The cleaning of indium-tin-oxide (ITO) glass substrates was performed in a laminar flow hood. In order to keep away from the dust. The ITO substrates were cleaned in an ultrasonic bath with detergent for 15 minutes sequentially, acetone for 30 minutes, and deionized water for 10 minutes, then finally rinsed in isopropanol for 15 minutes. After cleaning, ITO-glass substrates were dried at 120 in an oven for at ℃ least 12 hours. Before spin coating buffer layer, the ITO glass substrate were treated with UV-ozone for 20 minutes to remove the hydrocarbons from the surface.
3.2.2 Spin coating of buffer layer
To prepare the composite buffer layer, a Au NP solution was blended into the PEDOT:PSS solution at various concentrations; the volume ratios of the Au solution were 10, 20, and 30%. After substrate cleaning, the composite buffer layer was spin-coated onto an ITO-glass substrate by spin coating at 4000 rpm for 60 sec, and then thermal annealed at 120 °C for 1 h. Fig. 3.4 displays an SEM image of the pristine PEDOT:PSS layer and the resulting film with its embedded Au NPs .
Figure 3.4 The SEM image of (a) pristine PEDOT:PSS and (b) PEDOT:PSS with doping 20% Au NPs solution .
3.2.3 Spin coating of active layer
After the fabrication of the buffer layer, the substructure were transfered into the glove box. To deposit photoactive layer, a solution of P3HT and PCBM with 1:1 weight ratio dissolve in DCB, was spin coated onto the buffer layer at 600 rpm for 60 sec.
After spin coating, the wet active layer was put into a glass Petri dish to solvent annealing slowly solidify for at least 3 hours, which enhances the degree of polymer self-organization. Before to deposit cathode, the active film was thermally annealed at 110 for 15 minutes.℃
3.2.4 Cathode electrode deposition
To complete the device, 30-nm-thick calcium (Ca) and 100-nm-thick aluminum (Al) were deposited as the cathode by thermal evaporation under a vacuum of ~ 3 × 10⁻⁶ torr. The device area, defined through a shadow mask, was 0.12 cm2. The schematic structure of the devices as well as the picture of the cells in this study are shown in Fig. 3.5
(a)
(b)
Figure 3.5 (a) The schematic structure of OPVs and (b) the picture of the device in this study.
3.3 Device characterization
The current density–voltage (J–V) characteristics of the OPVs were measured using a Keithley 2400 source measure unit. The photocurrent response was obtained under illumination from a 150W Thermal Oriel solar simulator (AM 1.5G). The illumination intensity was calibrated using a standard Si photodiode with a KG-5 filter (Hamamatsu, Inc.). The absorption spectra of Au nanoparticles were measured using a Perkin Elmer Lamda 950 ultraviolet/visible/near infrared spectrometer. The resistivity of the PEDOT:PSS films were determined employing the four-point probe method.
4. Result and Discussion
4.1 Device performance
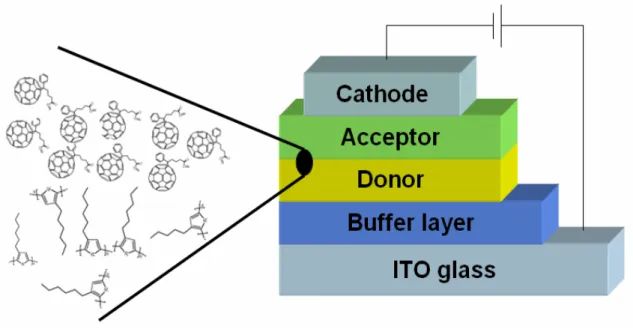
The structures of the reference device (ITO/PEDOT:PSS/P3HT:PCBM/Ca/Al) prepared with pristine PEDOT:PSS and the devices made of Au NPs were shown in Fig. 4.1.
Figure 4.1 The structures of the reference device and the device doped with Au nanoparticles.
Fig. 4.2 shows the current density and voltage (J–V) characteristics of organic photovoltaic devices which were prepared with or without Au NPs incorporated under 100 mW/cm2 illumination (AM 1.5G). The reference device exhibited a open-circuit voltage (Voc) of 0.59 V, a short-circuit current (Jsc) of 8.95 mA /cm2, a fill factor (FF) of 65.9%, and the calculated power conversion efficiency (PCE) was 3.48%.
the value of Voc remained unchanged (0.59 V), but the FF and Jsc were improved considerably (Table 2). For the devices incorporating Au NPs, we can observe evidently up ward trend in the value of Jsc; the Jsc was enhanced to 9.50 mA/cm2 and 10.18 mA/cm2; FF was enhanced to 69.2% and 69.8%, the PCE was also improved to 3.89% and 4.19%, which the concentration used was 10% and 20% respectively.
However, the efficiency slightly decreased to 3.87% after doping 30% Au NPs solution. The further increase in the concentration of the Au NP solution to 30% led to a decrease in the value of Jsc. We presume that the decrease was due to enhanced backward scattering and/or increased resistivity of the buffer layer. The enhanced backward scattering is presumably due to the dense distribution of Au nanoparticles. This caused less light to enter the active layer, thus reducing the light absorption in the active layer as well as the short-circuit current density (Fig.4.3).
0.0
0.2
0.4
0.6
-12
-8
-4
0
J (
m
A/
cm*2)
V (V)
Pristine PEDOT:PSS
With 10% Au sol.
With 20% Au sol.
With 30% Au sol.
Figure 4.2 J–V characteristics of OPVs with different concentration of doped Au nanoparticles solution:without doping (■); with 10% Au NPs solution doping (●); with 20% Au NPs solution doping (▲); with 30% Au NPs solution doping (▼). All devices were measured under illumination of 100 mW/cm2 (AM 1.5) and room temperature.
Pristine 10% Au 20% Au 30% Au 3.4 3.5 3.6 3.7 3.8 3.9 4.0 4.1 4.2 PCE (%) Concentration of Au nanoparticles
Figure 4.3 The power conversion efficiency (PCE) of the devices prepared with different concentrations of Au NPs.
Resistivity of the buffer layers were measured by using a four-point probe.We found that the resistivity increased after blending Au NPs in the PEDOT:PSS layer; the resistivity measures from 32.0 Ω-cm (pristine PEDOT:PSS) to 47.5Ω-cm (blending 30% Au NP solution). Besides, the values of the device series resistance (Rs), which extracted from the inverse slopes of the dark J–V curves at a voltage of
1.5 V, also increased after incorporating the Au NPs in buffer layer. The result of Rs
calculation revealed that the enhanced performance of the organic photovoltaic devices was not resulted from a reduction in device resistance. For this data, we presume that it is owing to the change of morphology of buffer layer. Table I summarizes the device characteristics.
Atomic force microscopy (AFM) measurement was performed to investigate the underlying surface morphology. To determine the change of resistivity and series resistance (Rs) after doping Au NP solution, we scanned surface of the PEDOT:PSS films prepared with/without Au nanoparticles. The AFM images are shown in Fig.4.4. The root-mean-square roughness (Ra) of the pristine PEDOT:PSS was 2.012 nm. After blending of 10%, 20%, and 30% Au NP solutions, the Ra values were increased to 2.296 nm, 2.647 nm, and 4.970 nm, respectively. The increased Ra, probably led to the increased series resistance (Rs). Therefore, we can demonstrate that the enhancement of the power conversion efficiency (PCE) of devices was not due to the improved the performance of buffer layers.
Table 2. The performance of ITO/PEDOT:PSS/P3HT:PCBM/Ca/Al photovoltaic devices with different concentration of Au NPs solution under illumination of 100 mw/cm2 (AM 1.5). Voc [V] Jsc [mA cm–2] FF [%] Rs a) [Ω-cm2] Resistivityb) [Ω-cm] PCE [%] Pristine PEDOT:PSS 0.59 8.95 65.9 1.73 32.0 3.48 10% Au NPs solution 0.59 9.50 69.2 1.86 37.1 3.89 20% Au NPs solution 0.59 10.18 69.8 2.08 43.5 4.19 30% Au NPs solution 0.59 9.46 69.3 2.35 47.5 3.87
a) Device series resistance (R
s) of the OPV obtained from the inverse slope of the dark J–V curve at a voltage of 1.5 V.
(a) (b)
(c) (d)
Figure 4.4 The AFM images show the surface morphology of (a) the pristine PEDOT:PSS and doping with different concentration of Au NPs solution: (b) 10%, (c) 20%, and (d) 30%.
4.2 The IPCE curves and absorption spectra
Fig. 4.5 displays the incident photon–to-electron conversion efficiency (IPCE) curves of our devices prepared with and without Au NP solutions. The trends in the IPCE followed the values of Jsc. Because the higher IPCE could lead to more efficient charge carriers collection under the given illumination energy. The photocurrent increased notably after incorporating the Au NPs. The improved IPCE was mainly observed in the range of 400 to 600 nm. The wavelength range coincides with the excitation range of Au NPs (Fig. 4.6). Note that the absorption peak of the Au NP solution was located at ~ 520 nm, whereas that of the Au NPs embedded in the PEDOT:PSS blend was located at ~ 490 nm (Fig. 4.6); this phenomenon is consistent with the fact that the resonance peak of NPs depends strongly on their surrounding media.
The resonance peak of metallic NPs depends on their dielectric environment and the particle size. However, the absorption spectrum of the Au NPs embedded in the PEDOT:PSS is more reasonable to account for the enhancement in IPCE, suggesting that the excitation of localized surface plasmon resonance (LSPR) indeed improved the light absorption as well as the photocurrent.
300
400
500
600
700
0
10
20
30
40
50
60
70
Pristine PEDOT:PSS
With 10% Au sol.
With 20% Au sol.
With 30% Au sol.
I P
C
E
Wavelength (nm)
Figure 4.6 Absorption spectra of Au NPs embedded in the PEDOT:PSS matrix (solid line) and in solution (dashed line). A neat PEDOT:PSS film was used as the baseline for measurement of the absorption of the PEDOT:PSS composite films.
4.3 Generation rate and dissociation probability
In order to investigate the underlying mechanism responsible for the enhancement of device power conversion efficiency, we further compared the maximum generation rate (Gmax) and dissociation probability (P) for the devices prepared with a pristine PEDOE:PSS and a PEDOT:PSS with doping 20% (which has the best PCE) Au NPs solution.
To calculate the generation of photocurrent in the device, the J-V characteristics were measures in voltages ranging from 1 to -10V under 100mW/cm2 illumination. The dependence of the photocurrent (Jph) on the illumination relates to the effective applied voltage (Veff). The current under illumination (JL) minus the dark current (JD) resulted in Jph.
The effect of LSPR on the photocurrent density (Jph = JL – JD) was presented in Fig. 4.7, which plots Jph with respect to effective voltage (Veff = Vo – Va), where Vo is the voltage when Jph equals to zero, i.e., JL = JD, and Va is the applied voltage. From Fig. 4.7, two distinct regimes were observed, Jph linearly increased with the voltage at a low Veff and then saturated at a sufficiently high Veff. The maximum generation rate (Gmax) of OPV devices can be calculated using the formula Jsat = q*Gmax*L , where Jsat is the saturation photocurrent density which is independent of the bias and temperature, and L is the film-thickness of active layer (L = 180 nm).
In this study, the values of Jsat for the devices prepared with pristine PEDOE:PSS and PEDOT:PSS doped with 20% Au NP solution were 110 and 119 A/m2 (Fig. 4.7),
The result indicated that the electron-hole pair generation in the film increase by about 8.1% after doping Au NPs. Furthermore, the enhanced Gmax accounts for the fact that the incorporation of Au NPs increased light harvesting in the devices because Gmax is only governed by light absorption.
10
-210
-110
010
110
010
110
2 Pristine PEDOT:PSS With 20% Au NP solutionV
eff(V)
J
ph(
A/
m
2 )
Figure 4.7 Plots of photocurrent density (Jph) with respect to the effective bias (Veff)
for devices incorporating pristine PEDOE:PSS and PEDOT:PSS containing 20% Au NP solution.
To compare the photocurrent behavior, we plotted the normalized photocurrent density under illumination as a function of the Veff. When the value of Jph/ Jsat approaches 1 in the high Veff region, the generated exciton have completely become free carrier and the dissociation probability (P) is near 100%. Although more excitons were generated, the value of P was limited by the recombination of the newly
produced electron-hole pairs in the active layer instead of their separation or dissociation into free carriers.
In Fig. 4.8, the value of P at any bias can be obtained from the plot of Jph/Jsat as a function of Veff. The value of P at the short-circuit condition (Veff = 0 V) was increased from 78.7% to 84.9% after doping 20% Au NPs with respect to the reference device. The higher dissociation efficiency of electron-hole pair indicates that the excitation of localize surface plasmon resonance facilitates excitons to dissociate into free carriers. The increase in P results in the reduction in recombination rate. Many reports have demonstrated that the FF of OPVs increases with the excion dissociation probability.
10
-210
-110
010
110
-210
-110
0 Pristine PEDOT:PSS With 20% Au NP solutionJ
ph/J
satV
eff(V)
short-circuit condition
Figure 4.8 Plots of Jph/ Jsat for devices incorporating pristine PEDOE:PSS and PEDOT:PSS containing 20% Au NP solution.
The enhancement of the PCE from 3.48% to 4.19% on the addition of 20% Au NPs solution is also a consequence of an increase in FF. We deduced that the increased FF observed above was attributed to the increased P via the local enhancement of electromagnetic field originating from the excitation of LSPR, rather than the reduced sheet resistance of the buffer layer.
5. Conclusion
In this study, we have improved the device performance of organic photovoltaics (OPVs) after blending Au nanoparticles into the PEDOT:PSS layer. Comparing the devices prepared with and without doping of Au nanoparticles, the Jsc, FF, and PCE, were improved, while the Voc remained unchanged (0.59 V). In the device incorporating 20% (volume ratio) Au-nanoparticle solution, Jsc was enhanced from 8.95 to 10.18 mA/cm2, FF from 65.9 to 69.8%, and PCE from 3.48 to 4.19% under AM 1.5G illumination at an intensity of 100 mW/cm2. The unique optical properties of the localize surface plasmon resonance (LSPR), which induced by the Au NPs, and led to a noticeable enhancement in the photocurrent.
From the four-point probe measurement, we can observe that the series resistance (Rs) increased from 1.73 to 2.08 Ω-cm2 after blending 20% Au-NP solution into PEDOT:PSS layer. Moreover, from the morphology of the buffer layers obtained by the using AFM, we observed that the buffer layer become rougher and the series resistance increased after doping of Au NPs.
Therefore, we can demonstrate that the enhancement of power conversion efficiency of the devices is not resulted from the improvement of buffer layer; the characteristics of the improvement was owing to LSPR of Au NPs. We deduced that excitation of the LSPR increased not only the rate of exciton generation but also the probability of exciton dissociation; they were enhanced from 3.82 × 1027 to 4.13 × 1027 m-3s-1, and from 78.7 to 84.9 %, respectively. These were the main reasons that
simple and may be suitable for application to the low-temperature processes used to form flexible OPVs on plastic substrates.
6. Reference
[1] C. W. Tang, “Two-layer organic photovoltaic cell,” Appl. Phys. Lett. 48, 183 (1986).
[2] K. L. Kelly, E. Coronado, L. L. Zhao, and G.. C. Schatz,” The optical properties of metal nanoparticles: The influence of size, shape, and dielectric environment,” J. Phys. Chem. B 107 (2003), p. 668.
[3] K. R. Catchpole and A. Polman, “Plasmonic solar cells,” Opt. Express 16, 21793-21800 (2008).
[4] W. L. Barnes, A. Dereux and T. W. Ebbesen, “Surface plasmon subwavelength optics,” Nature 424 (2003), pp. 824–830
[5] G.. Yu, K. Pakbaz, and A. J. Heeger, “Semiconducting polymer diodes: Large size, low cost photodetectors with excellent visible-ultraviolet sensitivity,” Appl. Phys. Lett. 64, 3422 (1994).
[6]. J. Xue, B. P. Rand, S. Uchida, and S. R. Forrest, “A hybrid planar-mixed molecular heterojunction photovoltaic cell,” Adv. Funct. Mater. 17, 66 (2005). [7] P. Peumans, A. Yakimov, and S. R. Forrest, “Small molecular weight organic
thin-film photodetectors and solar cells,” J. Appl. Phys. 93, 3693 (2003).
[8] G.. Yu, J. Gao, J. C. Hummelen, F. Wudl, and A. J. Heeger, “Polymer photovoltaic cells: Enhanced efficiencies via a network of internal donor-acceptor heterojunctions,” Science 270, 1789 (1995).
[9] P. Peumans, V. Bulovic´, and S. R. Forrest, “Efficient photon harvesting at high optical intensities in ultrathin organic double-heterostructure photovoltaic diodes,” Appl. Phys. Lett. 76, 2650 (2000).
copper phthalocyanine/C60 photovoltaic cells,” Appl. Phys. Lett. 79, 126 (2001). [11] T. Aernouts, W. Geens, J. Poortmans, P. Heremans, S. Borghs, and R. Mertens,
“Extraction of bulk and contact components of the series resistance in organic bulk donor-acceptor-heterojunctions,” Thin Solid Films 403-404, 297 (2002). [12] G. Li, V. Shrotriya, J. S. Huang, Y. Yao, T. Moriarty, K. Emery, and Y. Yang,
“High-efficiency solution processable polymer photovoltaic cells by self-organization of polymer blends,” Nat. Mater. 4, 864 (2005).
[13] M. R. Reyes, K. Kim, and D. L. Carroll, “High-efficiency photovoltaic devices
based on annealed Poly(3-hexylthiophene) and 1-(3-methoxycarbonyl)-propyl-1-phenyl-(6,6) C61 blends,” Appl. Phys. Lett. 87,
083506 (2005).
[14] W. Ma, C. Yang, X. Gong, K. Lee, and A. J. Heeger, “Thermally stable, efficient polymer solar cells with nanoscale control of the interpenetrating network morphology,” Adv. Funct. Mater. 15, 1617(2005).
[15] J. Y. Kim, S. H. Kim, H. H. Lee, K. Lee, W. Ma, X. Gong, and A. J. Heeger, “New architecture for high-efficiency polymer photovoltaic cells using solution-based titanium oxide as an optical spacer,” Adv. Mater. 18, 572 (2006). [16] C. J. Ko, Y. K. Lin, F. C. Chen, and C. W. Chu, “Modified buffer layers for
polymer photovoltaic devices,” Appl. Phys. Lett. 90, 063509 (2007).
[17] J.Y. Kim, K. Lee, N.E. Coates, D. Moses, T.-Q. Nguyen, M. Dante and A.J. Heeger, “Efficient tandem polymer solar cells fabricated by all-solution processing,” Science 317 (2007), p. 222.
[18] P. Peumans, A. Yakimov, and S. R. Forrest, “Small molecular weight organic thin-film photodetectors and solar cells”, J. Appl. Phys., 93, 3693 (2003).
[19] K. R. Catchpole, S. Pillai and K. L. Lin, “Novel applications for surface plasmons in photovoltaics,” World Conference on Photovoltaic Solar Energy
Conversion Osaka (2003).
[20] J. Nelson, J. Kirkpatrick, and P. Ravirajan, “Factors limiting the efficiency of molecular photovoltaic devices”, Phys. Rev. B, 69, 035337 (2004).
[21] A. Moliton and J. M. Nunzi, “How to model the behavior of organic photovoltaic cells,” Polym Int 55, 583 (2006).
[22] A. Haugeneder, M. Neges, C. Kallinger, W. Spirkl, U. Lemmer, J. Feldmann, U. Scherf, E. Harth, A. Gugel, and K. Mullen, “Exciton diffusion and dissociation in conjugated polymer/fullerene blends and heterostructures,” Physical Review B.,
59, 15 346 (1999)
[23] V. D. Mihailetchi, H. Xie, B. de Boer, L. J. A. Koster, and P. W. M. Blom, “Charge transport and photocurrent generation in poly(3-hexylthiophene): Methanofullerene bulk-heterojunction solar cells,” Adv. Funct. Mater. 13, 85 (2003).
[24] S. H. Park, A. Roy, S. Beaupré, S. Cho, N. Coates, J. S. Moon, D. Moses, M. Leclerc, K. Lee and A. J. Heeger,” Bulk heterojunction solar cells with internal quantum efficiency approaching 100%”, Nature 3 (2009), pp. 297–303
[25] S. Link and M. A. El-Sayed, “Size and temperature dependence of the plasmon absorption of colloidal gold nanoparticles,” J. Phys. Chem. B 1999, 103, 4212-4217 (1999)
[26] C. F. Zhang, S. W. Tong, C. Y. Jiang, E. T. Kang, D. S. H. Chan, and C. X. Zhu, “Simple tandem organic photovoltaic cells for improved energy conversion efficiency, “ Appl. Phys. Lett. 92, 083310 (2008).
[27] J. M. Kroon, M. M. Wienk, W. J. H. Verhees, and J. C. Hummelen, “Accurate efficiency determination and stability studies of conjugated polymer/fullerene solar cells,” Thin Solid Films, 403,223 (2002).
![Figure 1.1 The first PN junction OPV fabricated by Yang in 1986 [1]. Device structure (a), current density-voltage characteristic (b), chemical structure of donor and acceptor (c), (d)](https://thumb-ap.123doks.com/thumbv2/9libinfo/8254422.171827/12.892.145.756.110.835/figure-junction-fabricated-structure-characteristic-chemical-structure-acceptor.webp)
![Figure 1.2 The device energy level by using exciton-blocking layer (EBL) concept [9]](https://thumb-ap.123doks.com/thumbv2/9libinfo/8254422.171827/13.892.223.716.537.1020/figure-device-energy-level-using-exciton-blocking-concept.webp)
![Figure 1.8 Solar irradiation spectra for AM 0, AM 1.0, and AM 1.5 illumination [28].](https://thumb-ap.123doks.com/thumbv2/9libinfo/8254422.171827/28.892.212.685.120.506/figure-solar-irradiation-spectra-for-am-am-illumination.webp)
![Figure 2.2 Surface plasmon wave is an evanescent wave in parallel and perpendicular direction [4]](https://thumb-ap.123doks.com/thumbv2/9libinfo/8254422.171827/32.892.302.656.432.751/figure-surface-plasmon-wave-evanescent-parallel-perpendicular-direction.webp)
