國立交通大學
資訊科學與工程研究所
碩士論文
基於歷史軌跡資料探勘相關停留區域
Mining Top-k Relevant Stay Regions
from Historical Trajectories
研究生 : 林詠翔
指導教授 : 彭文志 教授
基於歷史軌跡資料探勘相關停留區域
Mining Top-k Relevant Stay Regions from Historical Trajectories
研究生 : 林詠翔 Student : Yung-Hsiang Lin
指導教授 : 彭文志 Advisor : Wen-Chih Peng
國 立 交 通 大 學
資 訊 科 學 與 工 程 研 究 所
碩 士 論 文
A Thesis
Submitted to Department of Computer Science and Engineering College of Computer Science
National Chiao Tung University in partial Fulfillment of the Requirements
for the Degree of Master
in
Computer Science
July 2013
Hsinchu, Taiwan, Republic of China
基於歷史軌跡資料探勘相關停留區域
學生 : 林詠翔 指導教授 : 彭文志
國立交通大學資訊科學與工程研究所
摘要
隨著具有 GPS 定位功能的設備越來越廣泛的被使用,如:GPS
定位器、智慧型手機及導航機,大量的軌跡資料可以被收集,並且使
用者可以藉由上傳他們的軌跡資料以獲得基於地點的服務。預測使用
者下一個可能停留的位置對使用者是很有幫助的,當這些相關停留區
域被探勘出來,一些交通狀況、商家廣告、旅遊景點推薦等關於下一
個停留位置的地點服務將可以被提供。先前關於位置預測的研究都是
從整群的軌跡資料中發掘停留區域並找出區域與區域間的關係來描
述使用者的移動模式。然而,我們認為軌跡資料即使經過相同的區域
並不代表擁有相似的移動行為。
此論文中,我們提出一個系統架構來探勘關於特定移動行為的停
留區域並且用於位置預測,包含兩個部分:Region Modeling 以及
Mobility Prediction。對於 Region Modeling,我們提出軌跡分群
法將相似形狀的軌跡分群,並且從分群的結果中發掘停留區域;對於
Mobility Prediction,我們提出挑選軌跡群的演算法及預測策略來找
出最佳 k 個相關停留區域。
我們利用了實際資料進行相關實驗,結果顯示我們的方法可以有
效地預測停留位置,且準確度達到接近 60%,而 nDCG 評估也可以
達到 80%。
ii
Mining Top-k Relevant Stay Regions from Historical Trajectories
Student : Yung-Hsiang Lin Advisor : Dr. Wen-Chih Peng
Institute of Computer Science and Engineering National Chiao Tung University
ABSTRACT
With increasingly prevalent mobile positioning devices, such as GPS
loggers, smart phones, and GPS navigation devices, a huge amount of
trajectories data is collected. Users are able to obtain the various
location-based services by uploading their trajectories. Predicting the
next region the user may possibly stay is very useful. Once a set of stay
regions discovered, traffic status, targeted advertises, sightseeing
recommendations, and other location-based information of the next stay
can be provided in advance. Prior works have elaborated on discovering
stay region from the whole crowd trajectories and then exploring the
relations between the regions to describe the movement patterns for
location prediction. However, the trajectories pass the same region may
not have the similar movement behavior.
In this paper, we propose a framework to discover stay regions
relevant to the specific movement behavior and then applied in location
prediction, called Region Modeling and Mobility Prediction. The
proposed framework includes two modules: region modeling and
mobility prediction. In the region modeling module, we develop
shape-clustering method to group the similar trajectories from historical
data and then explore the stay region model from trajectory clusters.
Based on the discovered region model, the mobility prediction module
provide a cluster selection algorithm and several prediction strategies to
generate the top-k relevant stay regions.
In an experimental evaluation, We evaluated the prediction method
by using labeled ground truth. The experimental results show that the
prediction accuracy of our method can reach 60% and nDCG is more
than 80% .
iv
誌謝
很高興於兩年前成為前瞻資料庫系統實驗室的新成員,而研究所
的兩年生活倏忽即逝,在這段期間最想感謝的是我的指導教授彭文志
老師,老師不僅在研究領域上不斷地給予我研究相關的專業知識,對
於研究態度、人生方向以及做人處事更是時時地提醒我們、引導著我
們。如此才能夠讓我順利地突破一切難題,完成碩士學位。
在研究生涯的初期,感謝 01 學姊的指導及幫助,讓我在這資料
探勘的領域漸漸地進入狀況。此外,感謝 Dimension 學長在我研究
路上遇到瓶頸時,熱心地陪我討論。不管是研究或是生活上的大小瑣
事都願意聆聽,並且適時地給予我幫助及建議,得以讓我順利進行研
究。而在畢業前的數個月,更要感謝 Barry 學長不厭其煩地經常與我
討論,適時地給我建議,更讓我學會很多論文的寫作方法。
感謝身邊的徐宗豪、周凡凱、陳建志、Ted 以及 Tom,也恭喜我
們要一起畢業。少了這群一同熱血打拼的同學們,我想應該也很難成
長茁壯,我會懷念一塊熬夜寫作業、趕 project 的日子,更不會忘記
我們一起唱歌、打球讓整個實驗室富有生氣。另外感謝實驗室的學弟
妹們,彭淯湘、許菀庭、溫郁婷、孫茂俽以及阮曉雯,多虧這些乖巧
又有趣的學弟妹平時及口試當日的幫助,讓我們完成實驗室的大小事
並且順利完成口試。這個實驗室因為有你們添加了許多色彩,點點滴
滴都使人懷念。
最後,我要特別感謝長久以來家人的支持與陪伴。在各方面你們
默默的支持我、包容我,讓我專心地將碩士研究完成。
Contents
1 Introduction 1
2 Problem Statement and Framework 6
2.1 Problem Statement . . . 6
2.2 Framework . . . 9
2.2.1 Region Modeling Module . . . 10
2.2.2 Mobility Prediction . . . 10
3 Shape-Clustering and Region Modeling 11 3.1 Shape-Clustering . . . 11
3.2 Region Modeling . . . 12
4 Mobility Prediction 17 4.1 Trajectory Cluster Selection . . . 17
4.2 Prediction Strategy . . . 19
5 Experimental Results 21 5.1 Environment . . . 21
5.1.2 Evaluation Metric . . . 22
5.2 Performance Evaluation . . . 23
5.2.1 Evaluation of Next Location Prediction . . . 23
5.2.2 Accuracy . . . 26
5.3 Impact of parameters . . . 26
5.3.1 Impact of Shape-clustering . . . 26
5.3.2 Impact of Parameters in Shape-clustering . . . 29
5.3.3 Impact of Parameters in Stay Region Detection . . . . 32
6 Related Work 34 6.1 Destination prediction . . . 34
6.2 Location prediction . . . 35
6.3 The research related to stay location . . . 35
7 Conclusion 37
List of Figures
1.1 An example of the similar-shape historical trajectories. . . 2
1.2 An example of the historical trajectories with movement be-havior . . . 4
2.1 A trajectory with stay point . . . 8
2.2 An Example of Stay Region . . . 8
2.3 Framework . . . 9
3.1 Shape-clustering . . . 14
3.2 Example: Result of Region Modeling . . . 15
4.1 Predicting trajectory cluster by start location and time . . . . 18
5.1 Comparing with other prediction methods . . . 24
5.2 Average distance error and precision for next stay region pre-diction . . . 25
5.3 Precision for different user types . . . 27
5.4 nDCG for different user types . . . 28
5.5 Precision (with shape-clustering) . . . 29
5.7 Impact of parameter δ (Number of trajectory clusters) . . . . 30 5.8 Impact of parameter δ (Number of relevant stay regions) . . . 30 5.9 Impact of parameter δ (Precision) . . . . 31 5.10 Impact of parameter δ (nDCG) . . . . 31 5.11 Impact of parameter t (Number of relevant stay regions) . . . 32 5.12 Impact of the period τ in shape-clustering . . . . 33
List of Tables
5.1 The Statistics of Sample of Users . . . 23 5.2 The Description of Parameters. . . 23
Chapter 1
Introduction
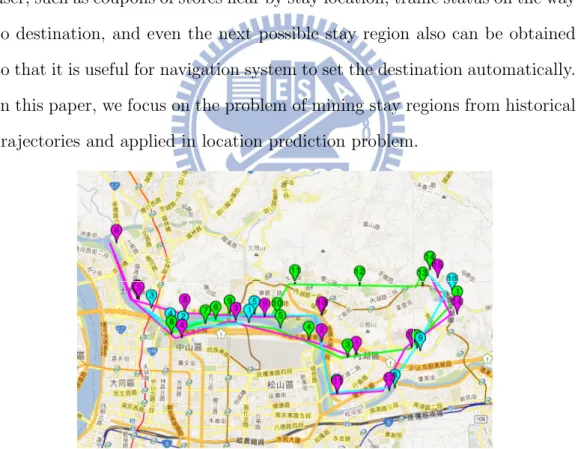
While the mobile positioning devices become prevalent, a tremendous amount of trajectory data are generated. Users can upload their trajectories or check-in data to location-aware web provider(e.g., @trip, Foursquare and Facebook) and obtain the various location-based services such as tourism recommenda-tions and store advertising in their daily life. In general, trajectory data is a sequence of GPS points and these sequential GPS points record the users’ true movement. If some similar trajectories frequently appear in a user’s historical trajectory data, we are able to suppose that the user may have a certain movement behavior. However, due to the uncertainty of GPS posi-tion collected, it is difficult to discover that the trajectories are completely repeated. For example, in figure 1.1, there are three historical trajectories of one user in different days with different colors. These trajectories are not completely the same but pass through same specific stay regions. This ob-servation shows the user usually take similar routes. Those trajectories have similar shape and pass through some specific stay regions together. Thus, we
claim that a user’s movement behavior can be discovered by clustering the trajectories with the similar shape and then resulted in some stay regions where the user frequently passed. Such stay regions are able to bring many applications such as inferring regions for sightseeing and tourism recommen-dations and estimating the traffic status for transportation management [1]. Once a set of stay regions discovered, lots of information could be provided to user, such as coupons of stores near by stay location, traffic status on the way to destination, and even the next possible stay region also can be obtained so that it is useful for navigation system to set the destination automatically. In this paper, we focus on the problem of mining stay regions from historical trajectories and applied in location prediction problem.
Figure 1.1: An example of the similar-shape historical trajectories. Given a set of trajectories, prior works have studied the location pre-diction problem in which given the users current location, the problem is to predict the next location or the location at a specific time. In [2], the authors proposed to split the map or trajectories into a set of regions and
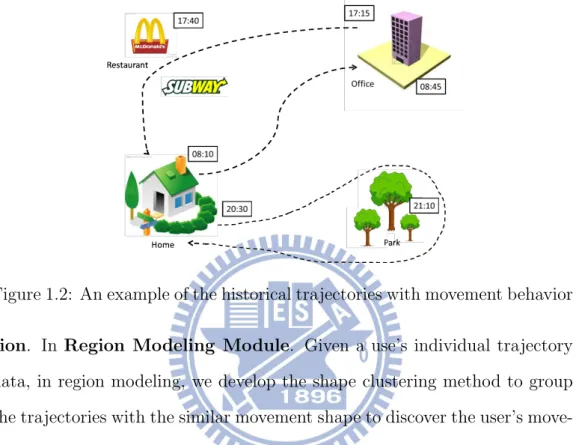
use historical trajectories to estimate the transition probability between each region. Then, according to the user’s current location for prediction. The authors in [3, 4] construct a decision tree according to trajectories and use tree structure to denote the stay locations for prediction. These existing research works focus on discovering stay region from the whole crowd trajec-tories and then exploring the relations between the regions to describe the movement patterns for location prediction. However, the trajectories pass the same region may not have the similar movement behavior. For instance, we may stay a restaurant for lunch and stay the same region for exercise at night because there may be a park in the same region. In this paper, the stay region detection is generated from the group of trajectories with the similar movement behavior and then applied for improving the destination predic-tion. The advantage of predicting the future location by the stay regions generated from the similar movement behavior is that the regions where the user frequently stay are the same even if the user detours. For example, Fig-ure 1.2 shows a user’s historical trajectories such as going to work from home at about 8:10 in the morning, getting off work from office at about 17:15 and buying his/her dinner on the way to home, and jogging around park after dinner. Suppose the user is in the restaurant and current time is 17:40, then we can surmise the movement behavior of the user is going home from office and the future stay region relevant to this behavior is home.
In this paper, we propose a framework to discover stay regions relevant to the specific movement behavior and then applied in location prediction, called
Region Modeling and Mobility Prediction. Specifically, the framework
Predic-Figure 1.2: An example of the historical trajectories with movement behavior
tion. In Region Modeling Module. Given a use’s individual trajectory
data, in region modeling, we develop the shape clustering method to group the trajectories with the similar movement shape to discover the user’s move-ment behavior and then a set of trajectory clusters is generated. Based on the trajectory clusters, a stay regions model is discovered for each trajectory cluster. In mobility prediction, given the starting location and current time, top-k stay regions relevant to the user’s movement behavior will be provided. We design an algorithm to select trajectory cluster, i.e. the movement be-havior, by considering the user’s starting location and current time. Then, several prediction strategies are proposed to generate top-k stay regions rel-evant to the user’s movement behavior. We evaluate the performance of our system by real-world dataset generated by users in a period of four months in Taiwan. In addition, we also compare our framework with the existing approaches and extensive experiments are conducted to demonstrate the ef-fectiveness of our framework.
The contributions of this study are:
1) We predict top-k relevant stay regions for users from his/her histori-cal trajectories. The result can be used on trip recommendation and navigation systems.
2) We study that movement behavior can be mined from similar-shape trajectories.
3) In the prediction module, the three score functions are adopted to obtain the top-k relevant stay regions, and consider time difference, location distance and frequency respectively.
4) We conduct a comprehensive performance evaluation. The experimen-tal results show that both the precision and nDCG in our method can reach to 70%.
The rest of this study is organized as follow: Section 2 defines the terms and notations used in this paper and gives a overview of our approach in this paper. Section 3 describes algorithms: trajectory clustering, stay points de-tection and stay region clustering. Section 4 describes prediction module for stay regions prediction. Performance studies are presented in Section 5. Sec-tion 6 introduces the current research works of the locaSec-tion and destinaSec-tion prediction system. Finally, Section 7 concludes this paper.
Chapter 2
Problem Statement and
Framework
In this section, we present an overview of our design. Section 2.1 formally presents the problem statement. Section 2.2 presents the framework in this paper, which is comprised of two components: Region Modeling Module and Mobility Prediction.
2.1
Problem Statement
We develop a trajectory clustering algorithm in our framework. Given a set of trajectories T rajs = {T1, T2, ..., Tnumtra}, our algorithm generates a
set of trajectory clusters T Clusters = {T C1, T C2, ..., T Cnumtc}. For every
trajectory, there are some stay points that user stayed in the past. All of trajectories in the same trajectory cluster can consist of some stay regions
cluster, stay point, stay region and relevant stay region are define as
fol-lows.
Definition 1 (Trajectory) A trajectory is a sequence of GPS points. It is defined as Ti = p1p2p3...pj...pleni (1≤ i ≤ numtra). Here, pj(1≤ j ≤ leni) is
a 2-dimensional point which has a own precise location(latitude, longitude) and a timestamp. The length leni of a trajectory can be different from those
of other trajectories.
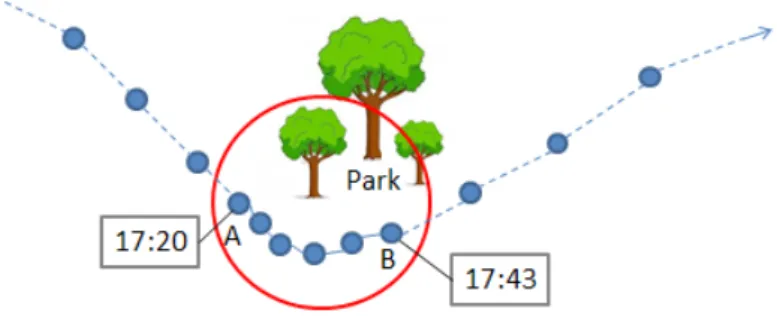
Definition 2 (Trajectory Cluster) A trajectory cluster T C is a set of trajectories. In this paper, The trajectories that belongs to the same cluster are close to each other according to the shape measure. In other word, the shape of trajectory is similar to the shape of each other in the same cluster. Definition 3 (Stay Point) A stay point SP in this paper should have one of the following two characteristics: 1) the location is where user stay for a while, or 2) where user walk around. In other words, a stay point contains some GPS points which are near by each other and their timestamp shows that the user stay for a long time. In Figure 2.1, there is a possible stay point in the trajectory. Under the premise of the GPS points have the sequential feature, we identify the location(mentioned as red area in Figure 2.1) is a stay point, because the distance between GPS point A and GPS point B is less than 500 meters and time difference between point A and point B is larger than 15 mins.
Definition 4 (Stay Region) A stay region is represented by a set of stay points. It is defined as SR = {sp1, sp2, ..., spnumsp}. As the Figure 2.2, it is
Figure 2.1: A trajectory with stay point
an example of a stay region which shows that the coverage of stay points from the same trajectory cluster is the stay region.
Figure 2.2: An Example of Stay Region
Definition 5 (Relevant Stay Region) A relevant stay region must follow a constraint that the time and location of stay region is related to query time and query location.
We claim that the users’ stay regions will be relevant movement behav-ior. In Fig. 1.1, we can observe that users’ behavior is always regular. For instance, people often take the similar route from home to office at morning and take the similar route from office to home. Even doing sports such as jogging or mountain climbing also take the similar route. Therefore, these behaviors correspond their relevant stay regions because regular routes pass through some specific stay regions several times. In fact, relevant stay region is relevant with not only movement behavior but also starting location and time.
2.2
Framework
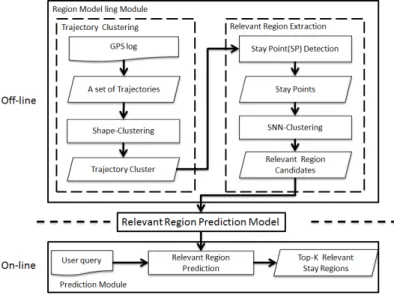
After description of problem statement, we describe the overview of this paper. Figure 2.3 shows the architecture of our system, which is comprised of two components: Region Modeling Module and Mobility Prediction.
2.2.1
Region Modeling Module
In the first module, we adopt a clustering method called shape-clustering and aim to group the similar-shape trajectories since the stay points in each non-similar-shape trajectories have different meaning. Then detect stay points by using existing method. After detecting step, we adopt a Share Nearest Neighbor clustering(SNN-clustering) to cluster the stay points as stay re-gions. Finally, this module generates some relevant stay region candidates in each trajectory cluster.
2.2.2
Mobility Prediction
In the second module, we score the trajectory cluster according to query time and query location. After scoring the trajectory cluster, we design another score functions to rank the relevant stay region candidates from each trajectory cluster. After Considering the score of trajectory cluster and score of stay region candidate, the result of this module are top-k relevant stay regions with top-k score.
Chapter 3
Shape-Clustering and Region
Modeling
In this chapter, we describe the Region Modeling Module which con-sists of two components: Shape-Clustering and Region Modeling. We proposed a trajectory clustering called Shape-Clustering to cluster the similar-shape trajectories. In Region Modeling, it decides the possible stay points in each trajectory cluster by using existing method after shape-clustering and cluster these stay points as relevant stay region candidates for prediction.
3.1
Shape-Clustering
In this section, we attempt to cluster the similar-shape trajectories. In Fig. 1.2, users’ often take a regular route in daily life. We thought the similar-shape trajectories imply the same movement behavior. And
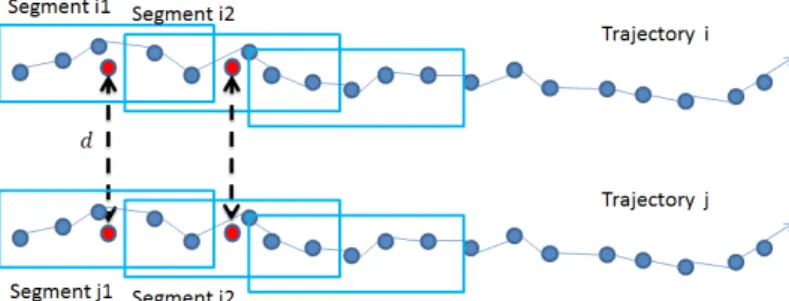
accord-ing to the same behavior, there should exist fixed stay points on the route. In existing work, a shape-based pattern detection method has been used to detect streaming time series data [5]. We consider that the same concept can be adopted on trajectory since we would like to find out the similar-shape trajectory. As shown in the Fig. 3.1, there are two trajectories Ti and
Tj denoted as sequential GPS poins. Then, we define segmenti,n as a nth
trajectory segment in Ti and the length of time interval is 25 seconds. And
each segment has a 15 seconds overlap with its last segment. We calculate the average position(the two red points) in each segment according to latitude and longitude of GPS points in a segment. From the front of two trajectories, calculate distance d defined as distance between the two average position(the two red points). As the algorithm 1, if the distance d less than the distance threshold δ, these two segments are considered as similar segments. In ad-dition, we define a similar counter mentioned as SimSeg in algorithm to count number of similar segments. Thus, the value of similar counter can be considered as similarity between two trajectories. Then, each two trajecto-ries whose similarity is higher than similarity threshold SimT hres should be group into the same cluster. Otherwise, the trajectory form a new cluster independently.
3.2
Region Modeling
In this section, we aim to detect possible stay points for finding out stay regions. According to the result of shape-clustering, we used the exist-ing method to detect stay points for each trajectory cluster. In existexist-ing
Algorithm 1 Shape-Clustering Algorithm
Input: A trajectory Ti = p1p2p3...pj...pleni, A trajectory
Tj = p1p2p3...pj...plenj, similarity threshold SimT hres , distance
threshold δ
Output: Trajectory clusters SimSeg = 0
T otalSeg = 0
T Si ← timestamp of p1 in Ti
T Sj ← timestamp of p1 in Tj
while T Si ≤ timestamp of pleni and T Sj ≤ timestamp of plenj do
Avgpointi ← average latitude and longitude of points in time
interval [T Si , T Si + 25]
Avgpointj ← average latitude and longitude of points in time
interval [T Sj , T Sj + 25]
T otalSeg ← T otalSeg + 1
if distance between Avgpointi and Avgpointj ≤ δ then
SimSeg ← SimSeg + 1
end if
T Si ← T Si + 10
T Sj ← T Sj + 10
end while
if SimSeg / T otalSeg ≥ SimT hres then
put Ti and Tj into same trajectory cluster
Figure 3.1: Shape-clustering
work [6] [7], stay points are detected when user stay somewhere for a while. the GPS points of trajectory must conform two criterions: 1) the distance between a GPS point and its last GPS point is very short, 2) the time dif-ference between these two GPS point is large. In other words, if a user does
not move or just walk around for a long time, the area will be determined
as stay point. In this paper, we set distance threshold as 1 km and time threshold as 15 minutes in order to detect stay points. Stay point is detected when the consecutive points of a examined point do not exceed the predefined distance threshold during the specified period of time threshold.
A stay region is a summary of a set of similar stay points from different trajectories. To define the similarity between stay points and discover the stay regions, we adopt the definition of shared nearest neighbor (SNN) and SNN density-based clustering. That is, the similarity between a pair of points is measured by the number of their shared nearest neighbors.
When applying SNN density based clustering to discover stay regions, we constrain the searching range of nearest neighbors is a radius Dh around
the examined nodes. We define a stay point is in a stay region if each stay point of which contains at least M inSR number of neighbors in the distance
radius Dh. The points without M inSR nearest neighbors are viewed as
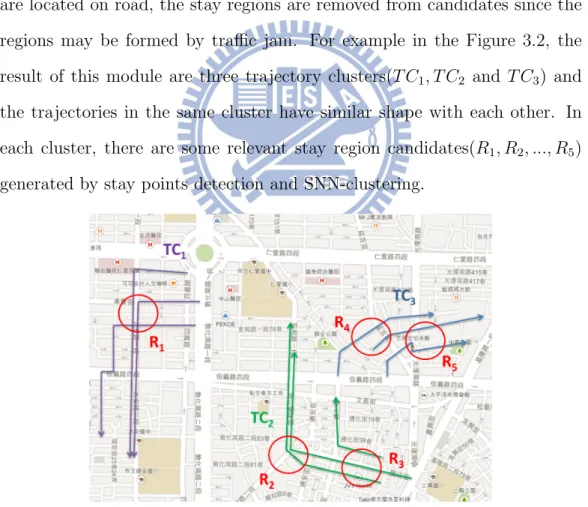
non-stay points and discarded. All the connected components in the resulting graph are clusters finally. These clusters can be considered as stay region candidates where an object often stay for certain activities. After generating the relevant stay region candidates, to avoid the region formed by traffic jam, we check whether the region is on the road exactly or not. If stay regions are located on road, the stay regions are removed from candidates since the regions may be formed by traffic jam. For example in the Figure 3.2, the result of this module are three trajectory clusters(T C1, T C2 and T C3) and
the trajectories in the same cluster have similar shape with each other. In each cluster, there are some relevant stay region candidates(R1, R2, ..., R5)
generated by stay points detection and SNN-clustering.
Algorithm 2 Algorithm of SNN-clustering
Input: A set of nodes, Distance threshold Dh, Minimum support M inSR
Output: A set of clusters
1 Find the MinSR-nearst neighbors in Dh of all nodes. 2 Construct the shared nearest neighbor similarity graph. 3 For every node in the graph, calculate the number of links. 4 Identify core nodes which has more or equal to M inSR links. 5 Identify noise nodes which is neither a core node nor linked
to a core node and remove them.
6 Take connected components of nodes to form clusters. 7 Return the union of all clusters.
Chapter 4
Mobility Prediction
In this chapter, we proposed a prediction module which consists of two com-ponents: Trajectory Cluster Selection and Prediction Strategy which mainly selects the best trajectory cluster and determines the score of rele-vant stay region candidates respectively. Then, the relerele-vant stay regions with top-k score will be recommended by this mobility prediction module.
4.1
Trajectory Cluster Selection
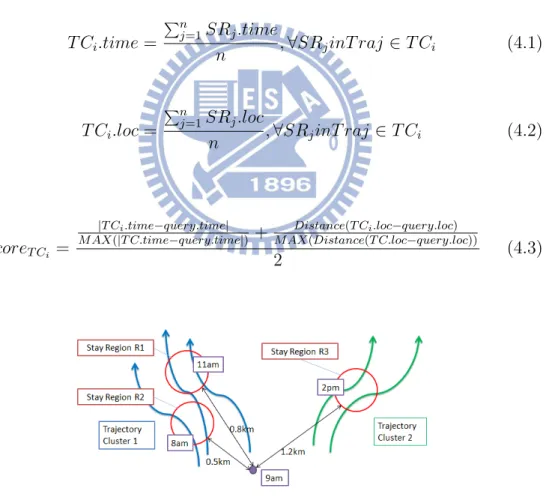
All of Stay regions must be in one trajectory cluster in our method. And we consider the importance of the trajectory cluster to evaluate whether a stay region will be a real stay region or not. A trajectory cluster consists of the similar-shape trajectories, and we thought it indicates some move-ment behaviors. Generally, movemove-ment behavior is usually relevant to time or location of a stay region. Thus, the average time and location of relevant stay region candidates in the trajectory cluster are used to determined the
score of the trajectory cluster. The average time and location of relevant stay region candidates are defined as equation 4.1 and equation 4.2. And as the equation 4.3, the average time and average location of stay regions in a cluster are closer to current starting time and location, the value is closer to zero and the trajectory cluster is better. Because the movement behavior of the trajectory cluster is matched current behavior of users.
T Ci.time = ∑n j=1SRj.time n ,∀SRjinT raj ∈ T Ci (4.1) T Ci.loc = ∑n j=1SRj.loc n ,∀SRjinT raj ∈ T Ci (4.2) scoreT Ci = |T Ci.time−query.time|
M AX(|T C.time−query.time|) + M AX(Distance(T C.loc−query.loc))Distance(T Ci.loc−query.loc)
2 (4.3)
4.2
Prediction Strategy
In spite of trajectory cluster selection can determine whether the relevant stay regions in which trajectory cluster are good or not, the relevant stay regions in the same trajectory cluster still should be scored. We evaluate each relevant stay region candidate by score of trajectory cluster and score of stay region itself. In addition, the score of trajectory cluster have priority over score of stay region. Thus, after defining the score of trajectory cluster, we define score functions to evaluate the probability of staying over the stay regions. We develop three Strategies: 1) N ear T ime F irst, 2) N ear Location
F irst and 3) High F requency F irst. N ear T ime F irst(equation 4.4) means
that if the historical stay time on the stay region is closer to current time, the score is higher. Because we thought the closing stay region has higher probability the users will stay.
scoreN T,i=
1
log2(∆T ime + 2)
(4.4) In the same manner, N ear Location F irst(equation 4.5) denotes that the distance between stay region and current location, the score is higher.
scoreN L,i=
1
log2(∆Distance + 2)
(4.5) The last one is High F requency F irst(equation 4.6), the more times the user has been stay region, the score is also higher.
scoreF req,i=
F requencyi
F requencymax
Moreover, we consider that different users may have good effect by using different score functions, so the Weighted Average of these three score functions will be adopted. As the equation 4.7, the combination of score functions can be set different α,β and γ for different user. In general, the next stay location often near the current location and the time at next stay location often near the current time, so α and β can be set larger than γ. Otherwise, if the user often stay some specific location many times so that we can use High F requency F irst to predict the next stay region very well, then the γ can be set larger. After this section, we evaluate the effect of these three criterions and the combination of score functions in experiment section.
scoreComb,i =
α× scoreN T ,i+ β× scoreN L,i+ γ× scoreF req,i
Chapter 5
Experimental Results
In this chapter, we give a brief introduction of our experimental environment including the testing datasets and the metric we used to evaluate the ac-curacy. The experiment result with other comparison target and impact of parameters also emerge in following section.
5.1
Environment
5.1.1
Dataset Description
We use a real-world datasets: GPS data of trips from a website called @trip (http://www.a-trip.com/). @trip is a platform let users can upload their travel logs or check-in data and share these data for other users. We extract a part of data which consists of 1,243 users, 14,039 trajectories and 13,192,283 GPS points. In the following experiment, due to how regular the user visited some places will affect the entropy of their stay regions, so we defined three user types and collected the users with the same user type which is according
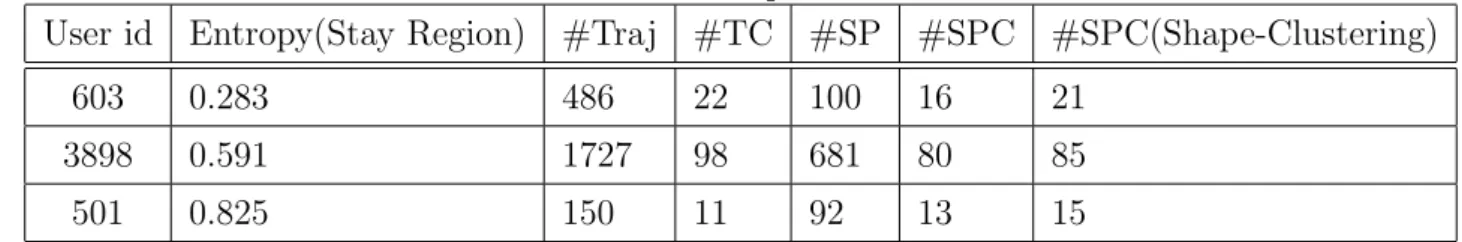
to the entropy of their stay regions. In other words, the users with the entropy less than 0.3 are user type 1, the users with the entropy equal or more than 0.3 and less 0.7 are user type 2, the others are the user type 3 since the range of entropy is from 0 to 1. We use the trajectories of these users during 4 months for query and groundtruth has been labeled also in the time duration.
5.1.2
Evaluation Metric
As in many research articles, to evaluate the prediction accuracy, we use the precision to evaluate the effect of our prediction. For each user, we use labeled stay region from historical trajectories as groundtruth. For each query, our system will recommend k relevant stay regions and if one of these k relevant stay regions is in the list of groundtruth, we consider it as a hit. Then, we define the precision as number of hits over k.
In other hand, groundtruth can be ranked actually because if we aim to find out the next stay region, the nearest stay location has more probability become the next stay region. So, groundtruth can be ranked by time and location if the time or location of relevant stay region closer current time or location, the stay region will be in the front of ranking. Then, we use nDCG to evaluate the effect of our ranking of relevant stay regions.
The other evaluation metric is average distance error. We use it to identify the next stay region which we predicted whether has high accuracy or not. If the result of prediction is near by the groundtruth of next stay location, the average distance error will be low.
Table 5.1: The Statistics of Sample of Users
User id Entropy(Stay Region) #Traj #TC #SP #SPC #SPC(Shape-Clustering) 603 0.283 486 22 100 16 21
3898 0.591 1727 98 681 80 85 501 0.825 150 11 92 13 15
Table 5.2: The Description of Parameters. Parameter The description of parameter
δ distance threshold in shape-clustering(km)
τ period of a segment in shape-clustering(second)
υ speed threshold in stay point detection(km/hr)
t time threshold in stay point detection(minute)
ϵ entropy threshold in stay point detection
Dh distance threshold in SNN-clustering(km)
M inSR minimum support in SNN-clustering
5.2
Performance Evaluation
In this section, we evaluate the accuracy and observe the impact of some parameters in our methods. In addition, we shows some experiment results for comparison between method in this paper and some of existing works.
5.2.1
Evaluation of Next Location Prediction
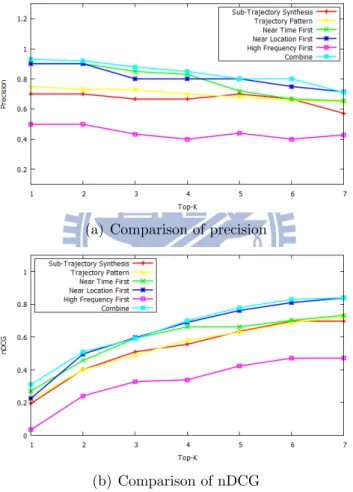
In [2], to predict destination, compute the posterior probability for any given query sub-trajectory. In [3], they construct the decision tree called Trajectory Pattern Tree to predict the next stay location. To compare with it, we use average distance error and precision to evaluate. In this part of experiment, we predict all the possible stay regions and next stay region. In
figure 5.1(a) and 5.1(b), although using High Frequency First can not get better effect, The Near Location First and Combine methods have better precision and nDCG value than comparison target.
(a) Comparison of precision
(b) Comparison of nDCG
Figure 5.1: Comparing with other prediction methods
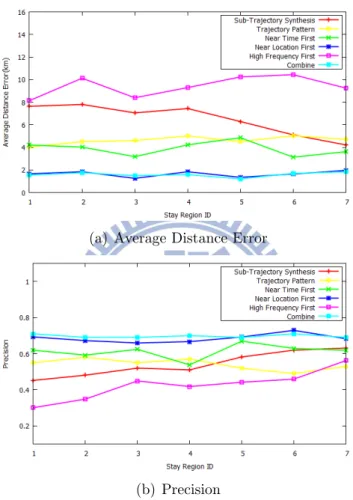
In figure 5.2(a), We evaluate the prediction of next location by average distance error. In this figure, x-axis denotes the region id which indicates the real stay location in groundtruth sequentially. For example, region id 3 is the next stay region when user is at region id 2. In figure 5.2(a) shows that both the Combine method and Near Location First have less distance error than sub-trajectory synthesis methods in [2] and prediction by using
trajectory pattern in [3].
(a) Average Distance Error
(b) Precision
Figure 5.2: Average distance error and precision for next stay region predic-tion
We also evaluate the prediction of next location by precision. In figure 5.2(b), we can figure out the comparison target [2] has higher precision when the number of predicting region id getting large. Because it used the trajectory for query, the accuracy will be higher when the length of sub-trajectory for query is longer. However, in figure 5.2(b), the scoring method
5.2.2
Accuracy
In the following, we describe our result and compare the effect of different score function. The figure 5.3(a)(data from user type 1) shows both the
Near Time First and Near Location First these two score function can
get higher precision than High Frequency First, even the k increase to 10, the precision can reach to 70%. Due to High Frequency First con-sider the frequency, but user has been some stay regions several times can not imply these stay region will be next stay location. Moreover, the com-bination of three score functions shows by purple line has higher precision than other score functions. And figure 5.3(b)(data from user type 2) and figure 5.3(c)(data from user type 3) also show the Combine can get higher precision. But, in these two figures, average precision is lower than figure 5.3(a) because the regularity of visited stay regions is less.
The figure 5.4(a), figure 5.4(b) and figure 5.4(c) are the experiment result of comparing of three score function and combination of three score functions by nDCG. The Combine gets higher nDCG value in these figures.
5.3
Impact of parameters
5.3.1
Impact of Shape-clustering
The shape-clustering play a important role in our framework. So, we compare the using shape-clustering and without using shape-clustering by precision and nDCG. In the figure 5.5 and figure 5.6, the thick line denotes using shape-clustering and thin line denotes without using shape-clustering,
(a) precision for user type1
(b) precision for user type2
(c) precision for user type3
(a) nDCG for user type1
(b) nDCG for user type2
(c) nDCG for user type3
then we can observe the precision and nDCG value are better by using shape-clustering obviously.
Figure 5.5: Precision (with shape-clustering)
Figure 5.6: nDCG (with shape-clustering)
5.3.2
Impact of Parameters in Shape-clustering
In the table 5.2, δ is a parameter in shape-clustering, which indicates distance threshold, if distance between two trajectories segments less than δ, the two segments are determined as similar segments. More similar segments implies the two trajectories are more similar and more similar trajectories implies the
trajectory clusters will decrease. In figure 5.7 shows that when δ increase, the number of trajectory clusters is small. In other hand, figure 5.8 also shows that when δ increase, the number of relevant stay regions is small.
Figure 5.7: Impact of parameter δ (Number of trajectory clusters)
Figure 5.8: Impact of parameter δ (Number of relevant stay regions) However, δ should be moderate, because the too large or too small number of trajectory clusters and too large or too small number of stay regions can cause the low quality of prediction. In the figure 5.9 and figure 5.10, both the precision and nDCG have good effect when δ is 2.
For another parameter τ in Shape-clustering, in figure 5.12(a), figure 5.12(b) and figure 5.12(c), the number of trajectory clusters, number of relevant stay
Figure 5.9: Impact of parameter δ (Precision)
regions and precision are almost not change while the period τ of trajectory segment in shape-clustering changed because we set a overlap between a seg-ment and the next segseg-ment. The overlap has a function of smoothing which can reduce the noise made by positioning.
Figure 5.11: Impact of parameter t (Number of relevant stay regions)
5.3.3
Impact of Parameters in Stay Region Detection
In the table 5.2, t is a parameter in stay region detection, which indicates time threshold. A location is identified as a stay region when stay time longer than t. If t is large, a location will be identified as a stay region more difficult. In figure 5.11, the number of relevant stay regions decrease with t increasing.
(a) Number of trajectory clusters
(b) Number of relevant stay regions
(c) Precision
Chapter 6
Related Work
To the best of our knowledge, this paper is the first work discussing stay re-gion prediction problem. Since we evaluated the accuracy by predicting stay regions in the experiments section, we will introduce the prediction method we adopted. In this section, We first discuss some research works which have been done in the area of destination prediction. Then, we introduce the location prediction methods and the research works related to mining stay regions.
6.1
Destination prediction
In existing work, Bayesian method is used to predict destination for specific individuals based on their historical transport mode [8] [9]. And Bayesian inference is the most popular framework used for deriving the probability of destinations based on historical trajectories [10] [8] [9] [11].
des-tinations for a specific individual as well [12] [13] [14] [15]. In [2], the author uses a Markov model to offline prepare the probabilities needed to efficiently compute the posterior probability for any given query trajectory online.
Some existing work use the external information to predict destination, these external information such as the distributions of different districts (ground cover), of traveling time, of trajectories length [10] [16], the accident reports, road condition, and driving habits [11] often enhance the prediction accuracy. Even context information such as time-of-day, day-of-week, and ve-locity has been incorporated as the features in training the Bayesian network model for prediction [17].
6.2
Location prediction
Nearest-Neighbour Trajectory (NNT) method that used distance measures to identify the historical trajectory which was the most similar to the current partial trajectory [18]. Chen et al. [19] used a tree structure to represent the historical movement patterns and then matched the current partial trajectory by stepping down the tree. Trajectory pattern [4] and decision tree [3] are also used on location prediction.
6.3
The research related to stay location
To discover the stay regions, stay points should be detected first. The authors in [6] proposed the concept of stay point detection to discover the stay regions.
Unlike density based clustering, stay point is detected when the consecutive points of a examined point do not exceed the predefined distance threshold during the specified period of time threshold.
In other hand, Stay region is usually formed by several stay points. SNN-clustering [20] [21] is adopted by most of existing work. The concept in SNN-clustering is merge the items which have shared-neighbors. By using SNN-clustering, location with high density can be mined.
Chapter 7
Conclusion
In this paper, we propose the concept of relevant stay region that indicates regions along with historical trajectories and it is related to user’s movement behaviors. The first component is region modelling module which aims to find out the relevant stay region candidates. We adopt a clustering method called shape-clustering which aims to group the similar-shape trajectories. Because the stay points in each non-similar-shape trajectories have different meaning. Then, detect stay points by using existing method. After detecting step, we adopt a Share Nearest Neighbor clustering(SNN) to cluster the stay points into stay regions. In the second component, we design a score function for trajectory clusters and three score function which rank the stay regions, Near Time First, Near Location First, High Frequency First. Finally, to show the preciseness and effectiveness of our framework, we present comprehensive experimental results over real datasets. The results demonstrate that our framework is able to accurately extract stay regions.
Bibliography
[1] J. Yuan, Y. Zheng, C. Zhang, W. Xie, X. Xie, G. Sun, and Y. Huang, “T-drive: driving directions based on taxi trajectories,” in Proceedings of the
18th SIGSPATIAL International conference on advances in geographic information systems. ACM, 2010, pp. 99–108.
[2] A. Y. Xue, R. Zhang, Y. Zheng, X. Xie, J. Huang, and Z. Xu, “Des-tination prediction by sub-trajectory synthesis and privacy protection against such prediction,” in 29th IEEE International Conference on
Data Engineering (ICDE 2013), Brisbane, Australia, 2013.
[3] A. Monreale, F. Pinelli, R. Trasarti, and F. Giannotti, “Wherenext: a location predictor on trajectory pattern mining,” in Proceedings of the
15th ACM SIGKDD international conference on Knowledge discovery and data mining. ACM, 2009, pp. 637–646.
[4] H. Jeung, Q. Liu, H. T. Shen, and X. Zhou, “A hybrid prediction model for moving objects,” in Data Engineering, 2008. ICDE 2008. IEEE 24th
International Conference on. IEEE, 2008, pp. 70–79.
[5] Y. Chen, M. A. Nascimento, B. C. Ooi, and A. K. Tung, “Spade: On shape-based pattern detection in streaming time series,” in Data
En-gineering, 2007. ICDE 2007. IEEE 23rd International Conference on.
IEEE, 2007, pp. 786–795.
[6] V. W. Zheng, Y. Zheng, X. Xie, and Q. Yang, “Collaborative location and activity recommendations with gps history data,” in Proceedings of
the 19th international conference on World wide web. ACM, 2010, pp. 1029–1038.
[7] C.-T. Lu, P.-R. Lei, W.-C. Peng, and J. Su, “A framework of mining semantic regions from trajectories,” in Database Systems for Advanced
Applications. Springer, 2011, pp. 193–207.
[8] N. Marmasse and C. Schmandt, “A user-centered location model,”
Per-sonal and Ubiquitous Computing, vol. 6, no. 5-6, pp. 318–321, 2002.
[9] D. J. Patterson, L. Liao, D. Fox, and H. Kautz, “Inferring high-level behavior from low-level sensors,” in UbiComp 2003: Ubiquitous
Com-puting. Springer, 2003, pp. 73–89.
[10] J. Krumm and E. Horvitz, “Predestination: Inferring destinations from partial trajectories,” in UbiComp 2006: Ubiquitous Computing. Springer, 2006, pp. 243–260.
[11] B. D. Ziebart, A. L. Maas, A. K. Dey, and J. A. Bagnell, “Navigate like a cabbie: Probabilistic reasoning from observed context-aware behav-ior,” in Proceedings of the 10th international conference on Ubiquitous
[12] J. Alvarez-Garcia, J. Ortega, L. Gonzalez-Abril, and F. Velasco, “Trip destination prediction based on past gps log using a hidden markov model,” Expert Systems with Applications, vol. 37, no. 12, pp. 8166– 8171, 2010.
[13] D. Ashbrook and T. Starner, “Using gps to learn significant locations and predict movement across multiple users,” Personal and Ubiquitous
Computing, vol. 7, no. 5, pp. 275–286, 2003.
[14] L. Liao, D. J. Patterson, D. Fox, and H. Kautz, “Learning and inferring transportation routines,” Artificial Intelligence, vol. 171, no. 5, pp. 311– 331, 2007.
[15] R. Simmons, B. Browning, Y. Zhang, and V. Sadekar, “Learning to pre-dict driver route and destination intent,” in Intelligent Transportation
Systems Conference, 2006. ITSC’06. IEEE. IEEE, 2006, pp. 127–132. [16] J. Krumm and E. Horvitz, “Predestination: Where do you want to go
today?” Computer, vol. 40, no. 4, pp. 105–107, 2007.
[17] V. Gogate, R. Dechter, B. Bidyuk, C. Rindt, and J. Marca, “Modeling transportation routines using hybrid dynamic mixed networks,” arXiv
preprint arXiv:1207.1384, 2012.
[18] D. Tiesyte and C. S. Jensen, “Similarity-based prediction of travel times for vehicles traveling on known routes,” in Proceedings of the 16th ACM
SIGSPATIAL international conference on Advances in geographic infor-mation systems. ACM, 2008, p. 14.
[19] L. Chen, M. Lv, and G. Chen, “A system for destination and future route prediction based on trajectory mining,” Pervasive and Mobile
Comput-ing, vol. 6, no. 6, pp. 657–676, 2010.
[20] L. Ertoz, M. Steinbach, and V. Kumar, “A new shared nearest neighbor clustering algorithm and its applications,” in Workshop on Clustering
High Dimensional Data and its Applications at 2nd SIAM International Conference on Data Mining, 2002, pp. 105–115.
[21] R. A. Jarvis and E. A. Patrick, “Clustering using a similarity measure based on shared near neighbors,” Computers, IEEE Transactions on, vol. 100, no. 11, pp. 1025–1034, 1973.