Heterogeneity deformation of a single crystal aluminum using
digital image correlation
Shih-Heng Tunga, Ming-Hsiang Shihb, Jui-Chao Kuoc, *
aDepartment of Civil and Environmental Engineering, National University of
Kaohsiung, Kaohsiung 811, Taiwan
bDepartment of Construction Engineering, National Kaohsiung First University of
Science and Technology, Kaohsiung 824, Taiwan
cDepartment of Materials Science and Engineering, National Cheng-Kung University,
Tainan 701, Taiwan
*Corresponding author. Tel.: +886 6 2754194; fax: +886-6-2754194. E-mail address: [email protected] (J.C. Kuo).
ABSTRACT: The application of digital image correlation (DIC) to analyze the
heterogeneity deformation of a single crystal aluminum during a micro-tensile test was demonstrated. Before testing the single crystal aluminum, a test was carried out on a steel material to evaluate the sensitivity of DIC during a tensile test experiment comparing the results obtained through DIC and those through strain gauge. The Young’s moduli of steel for loading and unloading, as determined by the DIC method, were found to be 201.6 and 200.5 GPa, respectively. The deformation heterogeneity in terms of the strain x map obtained through the DIC method was characterized by a broadened band that was inclined at an angle of 75°.
Introduction
Strain fields can be measured by various methods such as digital image correlation (DIC), electronic speckle-pattern interferometry (ESPI), and photoelasticity. Owing to the rapid advancement of digital-imaging and data-processing hardware in the last decade, the optical digital-image techniques for strain measurement have attracted increasing attention. The optical digital-image technique [1-9] can be used to measure the strain fields of various scales. Until now, there have been few investigations on the application of the optical digital-image technique to characterize a localization mechanical behavior in the field of materials science. The localization deformation within small zones of the specimen will cause failure and damage. Therefore, localization effects are very important in understanding materials failure. Both strain measurement and residual stress measurement seem to be important to realize the localization effect. There are a number of residual stress methods such as X-ray diffraction techniques, ultrasonic techniques, eddy current techniques, active magnetic techniques, and passive magnetic techniques [10, 11]. In this study we focus on the optical digital-image technique for strain measurement.
The optical digital-image technique for strain measurement, which is incorporated with DIC, is applied to visualize a local deformation pattern in this study. DIC has been used in recent years for full-field strain mapping applications in many materials
and mechanics research laboratories. Theoretically, DIC can achieve good reliability and accuracy. For strain mapping of the planar deformation and motion of a flat object, the errors in global average strain and local strain variations are limited to 10-4
or less [12, 13]. However, all the verifications of DIC precision in previous studies were based on the results of the rigid body motion test. In fact, there are many other factors that can influence measurement precision during a mechanical test, such as the deformation of a speckle on the specimen surface, the fixture method of the image acquisition instruments, and so on. Therefore, a comparison test between the DIC and the strain gauge is carried out to verify DIC precision in the mechanical test.
The application of a DIC to evaluate the nonhomogeneous deformation of a single crystal aluminum during a tensile test was demonstrated in this study. It was successfully applied to visualize the strain distribution during the test. In the following section, we will first describe the principle of the DIC techniques.
Principle of the digital image correlation method and evaluation
DIC method
Before the test, the so-called “structural speckle” [13] is established on the specimen surface. It is responsible for the non-uniform distribution of the gray scale. This gray scale distribution characteristic will be used in the DIC method to compare the deformed and undeformed images in order to obtain the relative positions.
In the first step, the undeformed image is divided into several subimages. Assuming that the undeformed subimage is A and the deformed subimage is B, the correlation coefficient according to Equation (1) [14] is used to define the relationship between subimages A and B. The correlation coefficient will be equal to 1 when subimage B becomes exactly like subimage A after the deformation.
2 2 ~ ~ ij ij ij ij g g g g COF (1) where g and ij gij
~ are the gray scale of image A on coordinate (i, j) and image B on
coordinate (i, j ), respectively. Moreover, coordinate (i, j ) of image B corresponds
to coordinate (i,j) of image A. If the optimal function parameters for every subimage are recognized, the corresponding coordinates of every deformed or undeformed subimage can be obtained. Accordingly, the displacement and strain field can be computed individually.
The displacement gradient of the matched subset pair can be determined by examining the coordinate difference between them using Green-Lagrange’s tensor. Thus, the strain tensor can also be expressed in terms of the displacement field. The detailed description of the DIC analysis technique can be found in our previous work [15].
Evaluation of the analysis method
The traditional method for measuring the strain, which is considered as an average strain, is to use strain gauge. However, the DIC method is applied to obtain a local full-strain field. To compare with the results from the strain gauge, the local strain component of the full-strain field along the tensile direction was averaged on the area, which was measured in the strain gauge. Furthermore, the camera is fixed on the frame of the testing machine to simulate the testing condition similar to that of the strain gauge, which is fixed on the testing sample. Assuming that the two digital cameras are not fixed on the specimen, it is possible to get additional measurement error from the machine because the cameras do not move as the machine vibrates or moves flexibly. Thus to avoid measurement error resulting from the machine, the camera holder was fixed at both sides of the specimen. Detailed testing processes are discussed in the following paragraphs.
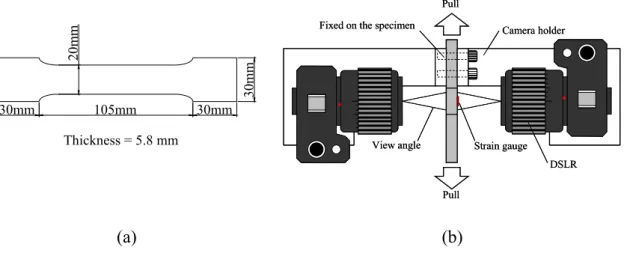
A universal tensile-test machine from Shimadzu with a maximum load of 100 kN was used to perform the comparison experiment of strain measurement between the strain gauge and the DIC method. The geometry of the tensile-test sample is shown in Figure 1a. Two Canon EOS 400D digital cameras were used to capture the pictures during the tensile test. The setup of the test system is shown in Figure 1b. The top of the camera holder was fixed to the specimen of steel. During tensile testing, a strain
gauge was attached by two arms to the specimens as shown at the right side of Fig. 1b, while the other surface of the specimen was used for DIC measurement at the left side of the specimen in Fig. 1b. The strain gauge measures the average value of the normal strain between the gauge marks. To avoid the effects of the vibration resulting from the testing machine, the investigated area was captured when the tension process was paused. Compared with the results obtained from the strain gauge, the strain at each point of the measured surface using the DIC method was average. Figure 3a shows the stress-strain diagrams measured by the strain gauge and the DIC method. It shows that these two curves exhibit no distinguished deviation during the loading and unloading processes. Figure 3b shows the relationship between the strains as measured by the strain gauge and the DIC method. The fitting line has a slope of 0.995, which lies close to the theoretical ratio 1 if the strains measured by the strain gauge and the DIC method are the same.
At strain < 0.0004, the stress-strain diagram measured by DIC has a small difference to that by the strain gauge. The reason for this small difference at the beginning of the test is not straightforward. This very small difference in the strain may be due to the change in surface roughness of the specimen. After straining, the initial rough surface becomes plain, and the change in surface roughness results in changing the distance between the specimen and the camera [15], leading to the small difference in the
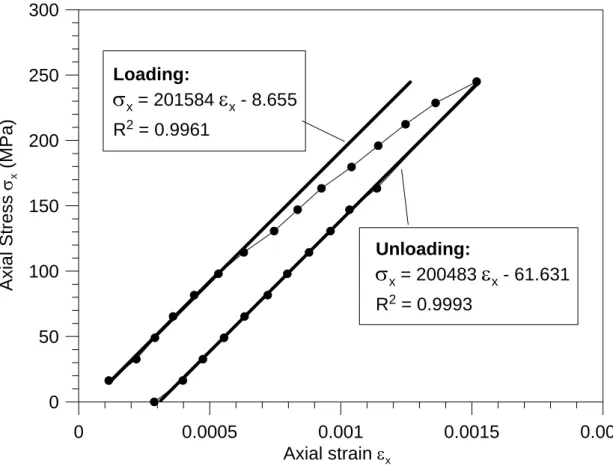
strain as measured by DIC. The influences of temperature, specimen flatness, load frame stiffness, gripper misalignment, optical distortions, thermal or electrical drifts may have contributed to the small difference in the strain. Considering the loading and unloading curves measured by DIC in Figure 4, the slopes of the fitted lines for loading and unloading are found to be 201.6 and 200.5 GPa, respectively. These values are very close to the Young’s modulus of steel, that is, 206 GPa [16].
Experimental procedures and analysis
Material and procedures
A single crystal of pure aluminum was prepared by using a modified Bridgman technique. The tensile testing sample was prepared by an electric discharge machine into the specimen dimensions as shown in Fig. 2a. The sample was polished with 1200 grit SiC abrasive papers, then with a 1 μm diamond paste, and finally electro-polished in a perchloric-based electrolyte at a temperature of -20 °C under 20 V for 10 s in order to obtain smooth, stress-free surfaces. After electro-polishing, with the use of a black-and-white spray, stochastic speckle patterns formed on the sample surfaces, and the initial images of the sample surfaces were taken as the reference image. The in-plane strain distribution obtained from the DIC technique was investigated on the sample normal surface with an area of 5.0 x 5.15 mm2 as shown in Fig. 2a.
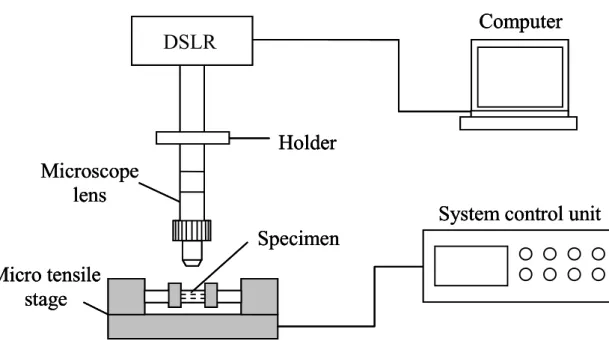
To register the sample surface, a microscopic lens was installed above the testing sample, which was fixed in the micro-tensile testing from Kammrath and Weiss GmbH. The measurement system and the micro-tensile machine are shown in Fig. 5 and Fig. 2b, respectively. During the testing process, micro-tensile testing was conducted at a constant shear rate of 1 m/s, and after each step of 0.1 mm, the sample surface was captured up to a total displacement of 1.3 mm. The deformed surface images of the single crystal during tensile testing were obtained to determine the full-field strain with the DIC strain analysis software.
Heterogeneity of deformation
With the help of the DIC technique, the in-plane surface during tensile testing was registered, and the force and displacement were simultaneously recorded. The stress, defined as the given force divided by the initial cross-section, is the same value for the DIC method and the strain gauge measurement. In the strain gauge method, the strain is defined as the displacement divided by its initial length and the average strain is given as described in the evaluation section of the analysis method. The measurement of the force and displacement enables the extraction of the stress-strain curve. In addition, during tensile testing, it is possible to show the deformation history and the
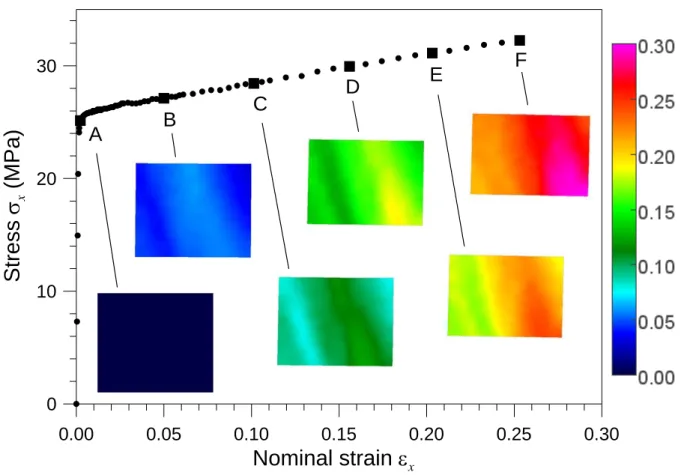
stress-strain curve (see Fig. 6). To show the strain distribution across the inclined band, the strain profiles, which were fixed along line ab in Fig.7, show the broadening of the band because of the increase in the average tensile strain from 0.23% to 25.31%, that is, from point A to point F.
There exists a broadened band inclined at 75° to the horizontal direction at x = 0.05, and another band is observed from the right bottom to the central top at x = 0.10 in
Fig. 6. The strain x maps show that the deformation heterogeneity, which is
characterized by an inclined broadened band, increases as the strain increases.
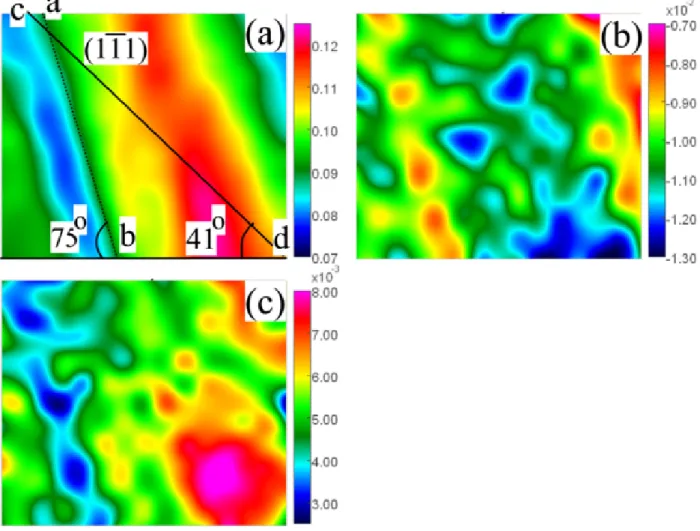
The tensile direction is parallel to the direction [5 2 14]. According to Schmid’s law [17], the critical shear stress for a given metal is constant. The resolved shear 0 stress in a slip system is related to the tensile stress by
cos cos (2)
where is the angle between the tensile direction [5 2 14] and the slip plane such as (1-11); and is the angle between the tensile direction [5 2 14] and the slip direction such as [0-1-1]. If the resolved shear stress on the slip plane in the slip direction reaches the critical shear stress , the crystal for a given metal will deform. Therefore, 0 the resolved shear stresses were calculated for the slip systems of aluminum, and it was found that the slip system (1-11)[0-1-1], which is indicated as line cd in Fig. 8a has the maximal shear stress and thus this slip system will be activated. The inclined
angle between the plane (1-11) and the horizon is 41°, which is smaller than the angle of 75° between the band as indicated by line ab and the horizon. If the slip system (1-11)[0-1-1] is activated, then the inclined angle should be 41°. However, the strain
y
and xymaps in Figs. 8b and 8c do not show the feature of the inclined bands as
seen in the strain x map. This suggests that the inclined bands observed in the
macroscale are not exactly the same as the activated slip system in the microscale. This broadening phenomenon can be explained by the activation of multi-slip systems and results in heterogeneity deformation.
Conclusion
In this study, the strains determined from the data obtained by the strain gauge and the DIC method are almost the same. Considering the loading and unloading curves for the DIC method, the Young’s moduli of steel for loading and unloading were found to
be 201.6 and 200.5 GPa, respectively. The strain x map obtained from the DIC
method shows deformation heterogeneity, which is characterized by the inclined broadened band. This broadening of the band increases as the average tensile strain also increases from 0.23% to 25.31%.
Acknowledgements
The authors acknowledge the financial support of National Science Council under the project number NSC 96-2221-E-006-124.
References
1. Bruck, H.A., McNeill, S.R., Sutton, M.A. and Peters, W.H. (1989) Digital
Image Correlation Using Newton-Raphson Method of Partial Differential Correlations.
Exp. Mech. 29, 261-267.
2. Chen, D.J., Chiang, F.P., Tan, Y.S. and Don, H.S. (1993) Digital Speckle
Displacement Using a Complex Spectrum Method. Appl. Opt. 32, 1839-1849.
3. Franke, E.A., Wenzel, D.J. and Davison, D.L. (1991) Measurement of
Microdisplacments by Machine Vision Photogrammetry. Rev. Sci. Instrum. 62, 1270-1279.
4. Tong, W. (1997) Detection of Plastic Deformation Patterns in a Binary
Aluminum Alloys. Exp. Mech. 37, 452-459.
5. Tong, W. (1998) Strain Characterization of Propagative Deformation Bands. J.
Mech. Phy. Solids 46, 2087-2102.
6. Vendroux, G. and Knauss, W.G. (1998) Submicro Deformation Field
7. F. Hild and S. Roux (2006) , Digital image correlation: from displacement measurement to identification of elastic properties - a review. Strain, 42, 69-80. 8. M.A. Sutton (1988), Effects of subpixel image-restoration on digital correlation error-estimates. Optical Engineering, 27, 870.
9. B. Wattrisse, A. Chrysochoos, J.M. Muracciole, M. Nemoz-Gaillard (2001), Analysis of strain localization during tensile tests by digital image correlation.
Experimental Mechanics, 42, 69-80.
10. P J Withers, M Turski, L Edwards, P J Bouchard and D J Buttle, 'Recent advances in residual stress measurement', Int. Journal of Pressure Vessels and Piping, Vol. 85, No. 3, pp. 118-127, 2008.
11. J. W. Wilson, G. Y. Tian, S. Barrans, 'Residual magnetic field sensing for stress measurement', Sensors and Actuators A: Physical, Vol. 135, No. 2, pp. 381-387, 2007.
12. Smith, B.W., Li, X. and Tong, W. (1998) Error Assessment for Strain
Mapping by Digital Image Correlation. Exp. Tech. 22, 19-21.
13. Tung, S.H., Kuo, J.C. and Shih, M.H. (2005) Strain Distribution Analysis
Using Digital-Image-Correlation Techniques. The Eighteenth KKCNN Symposium on
14. T.C. Chu, W.F. Ranson, M.A. Sutton and W.H. Peters (1985) Application of Digital-Image-Correlation Techniques to Experimental Mechanics. Exp. Mech., 25, 232-244.
15. J.C. Kuo, S.H. Tung, M.H. Shih and Y.Y. Lu, Characterization of
Indentation-Induced Pattern Using Full-Field Strain Measurement. Strain. (in pressing)
16. H.E. Boyer and T.L. Gall (1985), Metal Handbook: Desk Edition. ASM
International, Materials Park, OH.
30mm 105mm 30mm 30 mm 20m m Thickness = 5.8 mm Pull Pull Camera holder Fixed on the specimen
DSLR View angle Strain gauge
Pull
Pull
Camera holder Fixed on the specimen
DSLR View angle Strain gauge
(a) (b)
Figure 1: (a) Sample geometry and (b) schematic of experimental set up and camera holder for tensile test where camera holder is fixed on the specimen.
40mm 10 mm 10mm 5mm 5. 15 m m Thickness = 2.95 mm (a) (b) Figure 2: (a) Sample geometry and (b) experimental set up for micro-tensile test
0 0.0004 0.0008 0.0012 0.0016 Strain by DIC 0 50 100 150 200 250 300 St ress ( M Pa ) Strain by DIC Strain by Gauge (a) 0 0.0004 0.0008 0.0012 0.0016 Strain by Gauge 0 0.0004 0.0008 0.0012 0.0016 St rai n by D IC DIC=0.995 Gauge+2.2810 -5 R2=0.9993 (b)
Figure 3: (a) Stress-strain diagram determined by strain gauge and DIC method and (b) the corresponding strains measured from the strain gauge and DIC method
0 0.0005 0.001 0.0015 0.002 Axial strain x 0 50 100 150 200 250 300 Axial Stress x (MPa) Loading:
x = 201584
x - 8.655 R2 = 0.9961 Unloading:
x = 200483
x - 61.631 R2 = 0.9993Figure 4: Loading and unloading stress-strain diagram measured by DIC method and the corresponding fitting curves for the loading and unloading process.
Micro tensile
stage
Specimen
Computer
DSLR
Holder
Microscope
lens
System control unit
Micro tensile
stage
Specimen
Computer
DSLR
Holder
Microscope
lens
System control unit
Micro tensile
stage
Specimen
Computer
DSLR
Holder
Microscope
lens
System control unit
21 0.00 0.05 0.10 0.15 0.20 0.25 0.30
Nominal strain
x 0 10 20 30Stress
x(MPa)
A
B
C
D
E
F
Figure 6: The nominal strain x distribution up to an average nominal strain 0.26 including the stress-strain diagram determined from DIC method.
22
a b
0 1 2 3 4
Distance to point a along the red line profile (mm) 0 0.1 0.2 0.3 Str a in x A (0.23%) B (5.00%) C (10.13%) D (15.60%) E (20.32%) F (25.31%) (a) (b) Figure7: (a) Schematic illustration of the position of strain profile along ab. (b) The
strain profile from a to b for the average tensile strain from A (0.23%) to F (25.31%). The profiles were extracted from the strain distributions A-F with the same position
23
Figure 8: (a)x, (b)y