Tao, Y.-H., Lee, J. and Liu, S.-C., A Framework of Problem Diagnosis for ERP
Implementations, Operations Management Frontiers: Winds of Change Conference, Production and Operations Management Society, Chicago, Illinois, April 29-May 2, 2005
A Framework of Problem Diagnosis for ERP Implementations
Yu-Hui Tao
National University of Kaohsiung
700 Kaohsiung University Road, Nan-Tzu District 833, Kaohsiung Count, Taiwan, R.O.C [email protected]
Phone: 886-7-5919326, Fax: 886-7-5919328
Josephine Lee, Shu-Chu Liu
National Pingtung University of Science and Technology
1, Shueh-Fu Road, Nei-Pu Hsiang, Pingtung County 91201, Taiwan, R.O.C. @msa.hinet.net, @mail.npust.edu.tw
ABSTRACT
Although the development and implementation of Enterprise Resources Planning (ERP) have accumulated quite some experiences and methodologies, many surveys showed one half to two third of the ERP implementations are not successful. Kranser contributed the sources of failures from the perspectives of management, user and technique, in which technique contributed the least. Furthermore, many initial technical issues were expanded to final failure
due to the management’s failure in providing problem-monitoring and -solving mechanisms,
such as the classical example of FoxMeyer. Therefore, many literatures applied retrospective research methods to explore the management and user issues in order to provide ERP evaluation, critical success/failure factors, or implementation methods. On the other hand, a real-time problem diagnosis can change an ERP implementation from what Standish Group called
“impaired”to “challenged”, or even “successful”result, whose importance is obviously seen.
Nevertheless, although many practitioners conduct ERP problem-solving in real world, little is discussed in academic literature. To address the above concerns, we propose a flexible problem-diagnosis framework for ERP implementations. The primary objective is to utilize the software development life cycle as a core to integrate existing models and derive a problem-diagnosis process, in order to establish a generalized framework that encompasses both the academic theories and practical experiences.
INTRODUCTION
The rapid development of Information System (IS) and Information Technology (IT) make business organizations increasingly depending on IS/IT (referred as IS from here on). However, the investment cost on IS is generally high and risky, which is easily turning into unsatisfied returns or even financial crisis for closure. For example, Enterprise Resource Planning (ERP) is a fully integrated IS covering all business internal resources, such that not only the complexity and risk are high, but also occupying a high percentage of IS budget (Krasner, 2000; Scott and Shepheard, 2002). Other major ISs extending from ERP, such as customer relationship management (CRM) systems, supply chain management (SCM) systems or knowledge management systems are also involving widely as well as complex. Although the ERP implementation experiences have been accumulated since the 1990, the failure rate is still high (Hong and Kim, 2002). For ERP implementation alone, the worst scenario of failure may lead the company bankrupt and closed, such as the classical case of the drug retailer company of FoxMeyer, which even sued the ERP supplier SAP Inc. and the Andersen and Deloitte consulting firms (Jesitus, 1997). Higher failure rates also appear in other currently popular ISs, such as data warehouse systems (Wixom and Watson, 2002), CRM systems (Payton and Zahay, 2003) and SCM systems (Elmuti, 2002).
In the Chaos report by Standish Group (1995), the results of software projects were
classified into 16.2% of “Successful”, 52.7% of “Challenged”and 31.1% of “Impaired”, which
totals a high 83.8% of unsuccessful rate. Long before the Chaos report, Lyytinen and Hirschheim (1987) had classified the IS problems in to categories of correspondence, process, interaction and
accomplishment, “process”concerning budget and time, “interaction”concerning user usage,
attitude and satisfaction, and “expectation”concerning stakeholders’needs, expectation and
value. The problem classification by Hyythinern and Hirschheim actually pointed out the issues
encountered by the 52.7% of “challenged”problem type. Because successfully implementing
software projects are not easy, Scott and Vesseyge (2002) constructed a risk model for IS implementation containing factors of external, internal, IS and information project, which was illustrated by the impaired type of FoxMeyer and challenged type of Dow Corning, who implementing SAP/R3 at the same period. Similarly, Vogt (2002) compared the result and handling process of ERP implementation problems of four large US corporations, in which FoxMeyer belonged to impaired type, and Hershey Food Corp., Jo-Ann Stores Inc. and W. W. Grainger Inc. belonged to the challenged type of over budget or schedule delayed.
In principle, Krasner (2000) contributed the failure to the perspectives of management (16%), user (62%) and techniques (12%), and largely related to user and management layers. Take FoxMeyer for example, who was the first US retailer adopting SAP/R3, although SAP/R3 did exist technical problems at the beginning, the critical failure factors were, in fact, due to incomplete implementation planning, no executive management actively participated, no steering committee, inadequate communication with the consulting firms for coordinating technical issues and milestone monitoring (Scott and Vesseyge, 2002). Consequently, FoxMeyer produced a different outcome than the other four corporations facing challenging problems mentioned in Scott and Vesseyge (2002) and Vogt (2002). Because the management and user impact the IS implementation failure the most, many literature actively investigates critical success or failure factors (Hong and Kim, 2002; Vogt, 2002; Yeo, 2002; Umble, Haft and Umble, 2003), and appropriate implementation processes or methods (Umble, Haft and Umble, 2003; Kukafka et al.,
2003; Strong and Volkoff, 2004). However, these studies collected the IS implementation data for so-called retrospective analyses in order to provide the future reference or assessment of potential IS adopting companies. On the other hand, once any problem occurs during implementing an IS, a quick problem diagnosis and solving to resolve the crisis by reducing the risk of failure is equally important but is a less investigated research issue in the literature.
Currently, the literature lacks a complete methodology for dealing with quick problem-diagnosis during ERP implementations with a strong theoretical evidence. A successful ERP implementation must succeed in every stage of the project life cycle. Therefore, some retrospective studies classified IS problems based on the IS project life cycle (Cavaye, 1998; Krasner, 2000; Rajagopal, 2002; Somers and Nelson, 2004). The industry has accumulated rich experiences in IS problem diagnosis (Vogt, 2002; Kranser, 2000), but because problem diagnosis is an implicit knowledge, currently IS problem diagnosis lacks a sound conceptual model and corresponding step-by-step process as a reference for project management or consultants. Although there exists theoretical models such as IS evaluation, IS service quality, technology acceptance model, technology frame, and innovative fusion, each of them accounts only a segment of the IS project life cycle or core issues. On the other hand, despite the individual limitation, they can be integrated to form a complete problem-diagnosis framework as the IT use research in Kukafka et al. (2003), and produce accordingly a procedural process to be applied in practical IS implementation problems.
Consequently, the main objective of this research is to propose an integrated ERP problem-diagnosis framework that can be quickly adopted to diagnose and solve implementation problems. In order to position it as generalized and valuable, this framework focuses on rational multiple IS models integration for combined synergies, and flexible structure for adapting to
changes or problem nature.
LITERATURE REVIEW
To cover the based of the whole research spectrum, we briefly review literature in IS service quality, technology acceptance model, and technology frame in this section.
IS Service Quality
IS service quality originates from the service industry’s service quality studies.
Parasuraman, Zeitharml and Berry (1985) proposed a quality service gap model via focus group and interviews of customers and managers from banks, credit card, securities and product maintenance industries. To extend to all service industries, Parasuraman, Zeitharml and Berry (1988) reduced the ten factors to five which includes tangibles, reliability, responsiveness, assurance and empathy and produced a SERVQUAL instrument containing twenty-two items. SERVQUAL continued to evolve after it was first published (Zeitharml, Parasuraman and Berry, 1990; Parasuraman, Zeitharml and Berry, 1991; Cronin and Taylor, 1992; Zeitharml, Berry and Parasuraman, 1993; Parasuraman, Zeitharml and Berry, 1994).
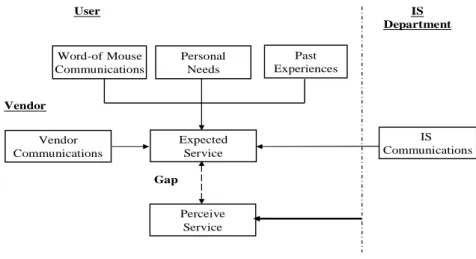
On IS service quality measurement, Kettinger and Lee (1994) first applied SERVQUAL to IS domain for lifting the satisfaction from the management users. Follow-up studies also continued, such as Pitt, Watson and Kavan (1995), Van Dyke, Kappelman and Prybutok (1997), and Pitt et al. (1997). To its counterpart of the model, Kettinger and Lee (1995) modified the PZB service quality gap model to adapt the IS context to an IS service quality gap model, in
which the SERVQUAL was still used to measure the gap between the user’s expectation and
as seen in Figure 1, which pointed the key decision factors to word-of-mouth communications, personal needs, past experiences, vendor communications, and IS communications. Continuing studies included the works by Kettinger and Lee (1997) and Jayasuriya (1998).
Expected Service Word-of Mouse Communications IS Communications Personal Needs Past Experiences Perceive Service User IS Department Gap Vendor Communications Vendor
Figure 1 Decision Factors of User’s expectation (Pitt et al., 1995)
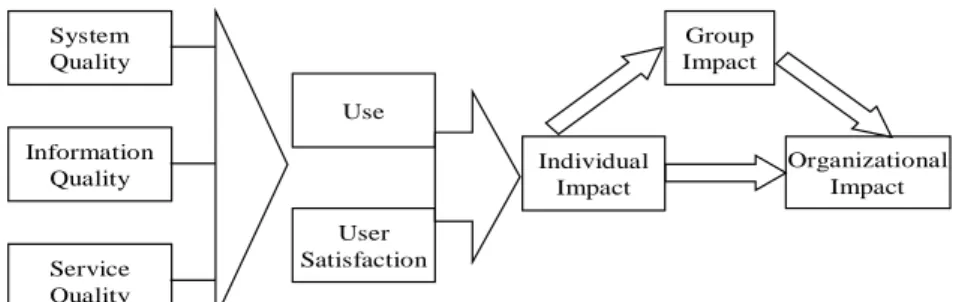
Service quality is only one part of the overall IS quality measurement. An earlier key study on IS success was DeLone and McLean (1992) who collected over 100 papers since 1981, and proposed a six-factor IS success model, including system quality, information quality, use, user satisfaction, individual impact and organizational impact. However, Pitt et al.(1995) thought that the model of DeLone and McLean (1992) emphasize more on the technical view, and ignored IS department in a service role. Therefore service quality is added to the IS success model. Myers, Kappelman and Prybutok (1997) agreed with Pitt et al. but added work group impact since which was a middle layer between the organization and the individual as shown in Figure 2. Lately, DeLone and McLean (2003) collected 144 papers referred their original IS success model and confirmed the addition of the service quality as an important factor as Pitt et al.(1995) and Myers, Kappelman and Prybutok.(1997) suggested.
System Quality Service Quality Use Group Impact Individual Impact Information Quality User Satisfaction Organizational Impact
Figure 2 Revised IS Success Model (Myers et al., 1997)
Technology Acceptance Model
Davis (1986) first proposed Technology Acceptance Model (TAM) based on the Theory of Reasoned Action (TRA) by Fishbein and Ajzen (1975), which explored the relationship between perception, attitude and technology use. The purpose of TAM was to simplify the TRA by
eliminating subjective norm and look for a more general model for explaining users’behavior in
computer technology. Legris, Ingham and Collerette (2003) analyzed twenty-two TAM papers between 1980 and 2003 and found out that despite different external factors were included to different scenarios, only less than 40% of variances were explained in average. In order to adapt to different types of business and ISs, Davis had modified TAM several times (Davis, 1989; 1993;
1995; Venkatesh & Davis, 1996; 2000) and clarified other’s question (Davis, 1996) for making
TAM more matured. Because the explanation power of TAM varied to different technology or IS, many other scholars had also proposed different integrated models (Goodhue and Thompson, 1995; Taylor and Todd, 1995a; Dishaw and Strong, 1999) or model comparison (Mathieson, 1991; Taylor and Todd, 1995b; Plouffe et al., 2001).
Extension of TAM(TAM2)was proposed by Venkatesh and Davis (2000) to include social influence and cognitive instrumental factors regarding user perceptions. Social influence
includes subjective norm, voluntariness and image; cognitive instrumental includes job relevance, output quality, result demonstrability, and perceived ease of use. The studies showed that these two variables explained 51% of the variance in perceived ease of use, and the whole model explained 49% of the variance in behavioral intention. Except extending the TAM forward, TAM2 also raised the completeness of the theoretical background. More importantly, TAM2 brought the research scene into internal business operations.
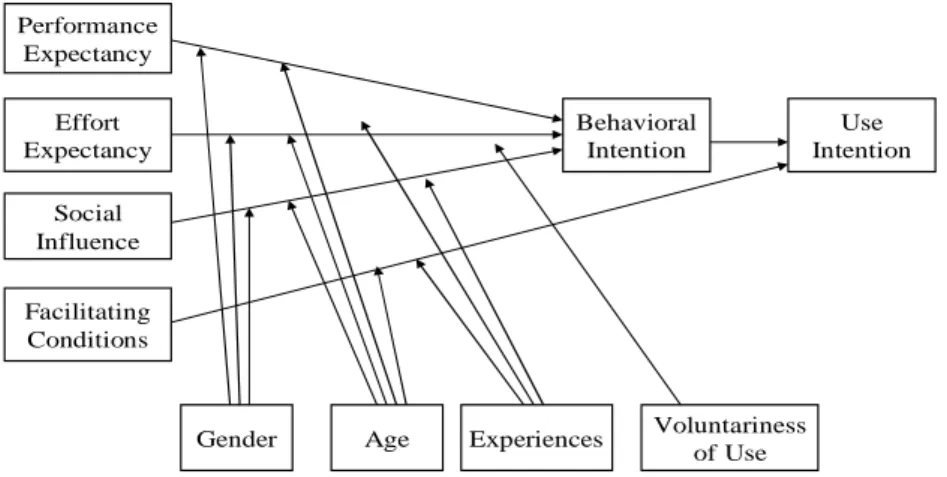
Gender Age Behavioral Intention Use Intention Performance Expectancy Effort Expectancy Social Influence Facilitating Conditions Experiences Voluntariness of Use
Figure 3 UTAUT Model (Venkatesh et al., 2003)
Venkatesh, Morris, Davis & Davis (2003) reviewed years of TAM related models and proposed Unified Theory of Acceptance and Use of Technology (UTAUT), which proved to have a 70% high of explanation. UTAUT covered perspectives in psychology, sociology, and technique by incorporating eight models, including TRA, TAM, motivation model, theory of planned behavior (TPB), combined TAM and TPB, model of PC utilization, innovation diffusion theory, and social cognitive theory as shown in Figure 3. Previous studies had some constraints, such as using student subjects, personal-oriented and simple IS, voluntarily adoption, and
experiences of IS. In order to conquer these constraints, Venkatesh et al. (2003) used four adjusting variables of gender, age, experience, and voluntariness of use, and four factors of performance expectancy, effort expectancy, social influence and facilitating conditions. The experiment covered four different lines of large corporations and was conducted in six months with three different testing stages, which demonstrated that UTAUT explained 69% of the variance in intention. A follow-up experiment was done to two different types of corporations and again obtained a 70% level, much effective than any individual or combined models in the past.
Technological Frame Model
Orlikowski and Gash(1994)proposed a Technological Frame (TF) to explain the source of IS implementation difficulties by extending the theory into social cognition, which studied the incongruence between members of a large consulting firm in adopting Notes groupware. The incongruence came from the technical staff and user group who had different interpretations about technology use, especially in their understandings of technological assumption, expectation and knowledge.
TF consists of three domain areas, which are nature of technology, technology strategy and
technology in use. Nature of technology explored people’s impression on technology and
understanding of the functionality and performance of the technology in use, including
motivation and success principles. Technology strategy explored people’s opinions in why their
organization implementing a specific technology, including the motivation and vision to adopt the technology and their mission to the organization. Technology in use explored how people use technology in daily routines, and the criteria and expected outcome for using such a technology, including priority and resource, educational training, difficulty level and policy of safety quality.
Khoo (2001) emphasized that there were three implications from the TF. First, the content of TF is not fixed and will evolve through the research questions; second, TF can be related to any specific stakeholder group or community of practice; and third, incongruence in technology will lead to big discrepancy in the expectation, assumption and knowledge. Accordingly, Khoo (2001) applied TF analysis to a collection review policy of a digital library, which innovatively adopted the content and participated groups of TF. In the analysis of adopting electronic data interchange (EDI) in London insurance market, Brett (1999) successfully combined TF with structural culture by Thompson (1990; 1995) to develop a research foundation for a process-based methodology, which illustrates the possibility of integrating TF with other theories. When investigating technology changing issues, McLoughlin, Badham and Couchman (2000) used technology allocation and TF to rethink the role of business political process and validated by three case companies. Also in studying how political process affects technology adoption, McGoverna and Hicks (2004) used a small make-to-order manufacturer to confirm the decisive power of the frame on IS decisions. In a comparative study by Davison (1997) on TF impacting
technology adoption, one case company’s TF evolved with organization changes and thus an IS
application could be successfully adopted in a new functional area, but another case company had a strong resistance in IS development which could be contributed to continuously changing TF in the participant group.
THE FRAMEWORK
Most IS theories are model-based, as seen in the literature review, while the industrial practices are mainly process-oriented. Therefore, to meet the objective of having a problem-diagnosis solution, a natural approach is a framework that consists of a static model
rationally integrating multiple IS models, and a dynamic process containing correspondent methods to the static model. The static model and dynamic process are designed to meet prerequisite principles so that the overall framework can be effective and preserve some fine characteristics for problem diagnosis.
Static Model
To achieve a generalized and flexible static model, the guidelines under the goal of ERP problem diagnosis as follows:
a. Regarding quick diagnosis, all the IS models must be fully validated and include
corresponding instrumental measurement and questionnaire items.
b. Regarding ERP project life cycle, all stages in the life cycle need to be covered.
c. Regarding nature of problem diagnosis, problem detection should be multi-stage and repetitive to reduce the risk.
d. Regarding flexibility, original IS model assumptions should not constrain the different
nature of problem-diagnosis.
e. Regarding generalization, adaptable to include other models not considered or thought of,
and adjustable to replace part of the component to meet special ERP application domains are demanded. Combining d with e, this static model obeys the quality criteria of programming modules of tight internal cohesion and loose module coupling.
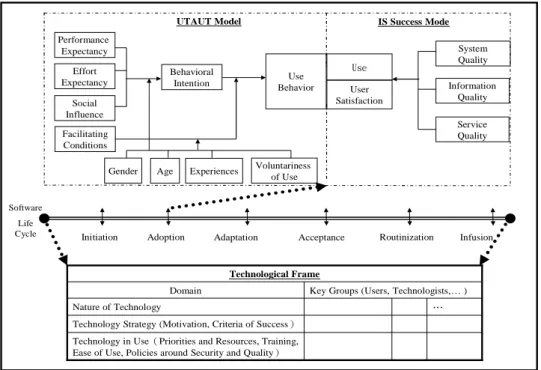
According to the above guidelines, the static problem-diagnosis model uses the ERP project life cycle as the core (guideline b) to integrate UTAUT model and IS success model covering before and after adoption point on the life cycle, and TF (guideline b) covering the whole life cycle. The considerations are as described in the literature review: TAM and IS
service quality both have a series of models targeting different perspectives, for problem-diagnosis purpose, the maximum coverage is the best option. Therefore, UTAUT is the ultimate integrated TAM version with the highest variation explained, and IS success model covers the service quality as well as the traditional information and system quality factors. As for TF itself, it is stand alone but covering the whole life cycle. Therefore, not only TF is closed to practical problem-diagnosis mechanism, but also its flexibility in its content and structure makes it highly complement to UTAUT and IS success model (guideline c).
Because the chosen IS models do not interact with each other, and thus maintain their own validity and completeness without the need for further testing (guideline e). However, as see in Figure 4, UTAUT and IS success model contain only the first half of their original models, which is because from the problem-diagnosis perspective, detecting potential problem sources is the main concern rather than their original purposes (guideline d). In addition, the content of TF is not fixed but depends on the problem domain for appropriate selection and confirmation (guideline d).
UTAUT Model
Technological Frame
Technology in Use(Priorities and Resources, Training, Ease of Use, Policies around Security and Quality) Technology Strategy (Motivation, Criteria of Success)
… Nature of Technology
Key Groups (Users, Technologists,… ) Domain IS Success Mode System Quality Information Quality Service Quality User Satisfaction Use Behavioral Intention Performance Expectancy Effort Expectancy Social Influence
Gender Age Experiences Voluntariness of Use Facilitating
Conditions
Use Behavior
Initiation Adoption Adaptation Acceptance Routinization Infusion Software
Life Cycle
Figure 4 ERP Problem-Diagnosis Framework
The six stages of life cycle by Rajagopal (2002), namely initiation, adoption, adaptation, acceptance, routinization, and fusion, is used in this model because Somers and Nelsons (2004) thought the last two stages represent the behavior after the adoption, which meets the nature of problem-diagnosis. Nevertheless, from Figure 4 we can tell that currently the only critical cutoff point on the life cycle is the adoption. In other words, other IS project life cycle with this
particular cutoff point can replace Rajaogpal’s version. Besides, if other IS models can cut in to
other stages of the life cycle with little interactions on the existing models, as long as it significantly increases the benefits of problem-diagnosis, they can be included into the current structure of this static model without difficulties (guideline e).
Dynamic Process
process that can be quickly executed to precede the problem diagnosis is important. Therefore, a dynamic model is part of the overall problem-diagnosis framework for laying out the actual problem-diagnosis processes. Same as the static model, there are a few guidelines to be considered as follows:
a. Regarding research attribute, this process can be used for the purpose of exploratory or explanatory.
b. Regarding data collection, this process needs to contain both quantitative and qualitative data collection methods.
c. Regarding research process formation, this process should be flexibly combined from basic constructs in order to meet various complexities of different problems.
Based on the above requirements, this IS problem-diagnosis process model composes of three fundamental constructs that can be flexibly combined for the problem on hand:
Construct I: Secondary data collection, including public available or internal business data sources, which can be documents, manuals, report, programs, records, files, and any IS related references or messages. This secondary data can be used for a qualitative or quantitative content analysis or other means for providing some initial propositions or hypotheses of the problems.
Construct II: Combining UTAUT model and IS success model together, they cover the entire life cycle before and after the cutoff point of adoption, and associate validated measurement of questionnaire items for a quick exploration of potential problem detection. Or they can be used at the final stage of problem-diagnosis to confirm the validity of the potential problems from the target user groups.
Construct III: TF can be used to identify the incongruence between different user groups, which is a qualitative analysis method in nature via in-depth interviews to confirm some potential problems.
As building blocks, the above process constructs can be combined, reordered, and repeated, in order to customize for meeting the needs of a specific problem (guideline c). Data collect can be customized as well (guideline b). When applying to the problem diagnosis, they can be not constrained by the original model of different perspectives. For examples:
1. Because the purpose is not to validate the completeness of the models in Construct II, but to quickly detect potential problem sources, only the impacting factors in the original models are concerned.
2. Construct III can be used to confirm known proposition as well as the incongruence between user groups (guideline a).
JUSTIFICATION
The proposed framework was designed to meet required guidelines, and thus contains the following desirable characteristics for ERP problem-diagnosis as listed below. In particular, the flexibilities in either its structure or applications are the focal points.
1. Theoretically sound while practically feasible. Currently, the static model integrates
UTAUT model, IS success model, and TF model, which have been evolving throughout at least a decade, and extensively adopted and discussed in the literature. Most importantly, they are still widely applied in practice via the three proposed constructs covered in the dynamic process. The fusion of theories and practices is obviously seen.
into measure the adequate coverage in time. Currently, two sets of models and processing steps are included to repeatedly cover the complete life cycle. The first complete coverage is achieved by the UTAUT and IS success model on the cutoff point of adoption stage, while the second is by the TF model that can be used at any stages of the life cycle as suggested by its inventors. The comprehensiveness and repetition are then realized.
3. Flexibility in its structure. The structural flexibility has many meanings that make this
framework scalable and sustainable to content changes over time:
a. The separation of the static model and dynamic process makes it easy to be
manipulated and mapped between the theoretical foundation and practical procedure.
b. The stages around the core of the project life cycle makes the static model not bounded
to any specific model, and can be extended to cover more IS models.
c. The feasibility to replace the IS models and/or their components of the static model. As
a result, the content of the static model can be evolved with related theories and not affecting the overall referential value.
d. The three constructs in the dynamic process can not only be combined according a
specific problem domain, but also adjustable to the changes in the static model.
To sum up, this framework preserves the quality of high cohesive content modules that are loosely coupled.
4. Flexibility in its applications. The application flexibility is naturally inherited from the
characteristic of structural flexibility:
a. Static model –depending on the complexity, the IS models can be freely selected based
on the judgment of appropriateness of the context of the problem. For example, if the case problem is only on its initial deployment stage and not formally implemented, then only
the UTAUT or together with the TF can be considered. Another example is that if all the user groups in the case problem had used the IS, then only the IS success model or together with the TF can be considered. In other words, this static model can be degraded to only a subset of the embedded IS models.
b. Dynamic process –same as above, the three fundamental constructs can be adopted based
on actual needs. For example, if there is no appropriate or enough secondary data, construct I can be omitted. Or if the person who conducts the diagnosis is very familiar with the case problem, and has a pretty good idea what might be the problems, then construct III can be apply directly to confirm the hypotheses without going through the first two stages of constructs.
CONCLUSIONS
We have proposed a problem-diagnosis framework for ERP implementations, which fuses theoretical models with practical approaches. In the academic world of retrospective studies on ERP implementations, this real-time ERP problem-diagnosis framework can not only bring in valuable reference to both academic and practice domains, but will also bring out more insightful research about IS implementations on the dimension of real-time problem diagnosis. As argued in the JUSTIFICATION section, there is no need to validate any new or modified IS models in this proposed integrated framework. But a comprehensive case study to demonstrate the process of adopting this IS problem-diagnosis framework would add a good referential value, which is underway. Finally, because the proposed problem-diagnosis framework is not bounded to any particular ERP theories and practices, it can also be effectively extend to cover other IS
INTRODUCTION.
REFERENCES
1. Ajzen, I. 1985. From intentions to actions: A theory of planned behavior. In J. Kuhl & J. Beckman (Eds.), Action-control: From cognition to behavior: 11-39, Heidelberg: Springer. 2. Brett, M. 1999. Challenges of EDI adoption for electronic trading in the London Insurance
Market, European Journal of Information Management. vol. 8:1-15.
3. Cavaye, A. L. M. 1998. An exploratory study investigating transnational information systems, Journal of Strategic Information Systems. vol. 7:17-35.
4. Cronin, J. J. & Taylor, S. A. 1994. SERVPERF versus SERVQUAL: reconciling
performance-based and perceptions-minus-expectations, measurement of service quality. Journal of Marketing, vol. 58, no. 1:125-131.
5. Davis, F. D. 1986. A technology acceptance model for empirically testing new end-user information system: theory & results, Doctoral dissertation, MIT Sloan School management, Cambridge, MA.
6. Davis, F. D. 1989. Perceived usefulness, perceived ease of use & user acceptance of information technology. MIS Quarterly, vol. 13, no. 3:319-339.
7. Davis, F. D. 1993. User acceptance of information technology: system characteristics, user perceptions, and behavioral impacts. International Journal of Man-Machine Studies, 38, pp. 475-487.
8. Davis, F. D. & Venkatesh, V. 2004. Toward preprototype user acceptance testing of new information systems: implications for software project management. IEEE Transactions on Engineering Management, vol. 51, no. 1:31-46.
9. Davison, E. J. 1997. Changing frames or framing changes? Social cognitive implications of organizational change during IT adoption. In Proceedings of the Thirtieth Hawaii
International Conference on System Sciences, Jan. 7-10, vol. 3:. 475-484.
10. DeLone, W. H. & McLean, E. R. 1992. Information systems success: the quest for the dependent variable. Information Systems Research, vol. 3, no. 1:60-95.
11. DeLone, W. H. & McLean, E. R. 2003. The DeLone and McLean model of information systems success: A ten-year update. Journal of Management Information Systems, vol. 19, no. 4:9-30.
12. Dishaw, M. T. & Strong, D. M. 1999. Extending the technology acceptance model with task-technology fit constructs. Information & Management, vol. 36:9-21.
13. Elmuti, D. 2002. The perceived impact of supply chain management on organizational effectiveness. Journal of Supply Chain Management; vol. 38, no. 3:49-57.
14. Fishbein, M. & Ajzen, I. 1975. Belief, attitude, intension, and behavior: an introduction to theory and research. Reading. MA: Addison-Wesley.
15. Goodhue, D. L. & Thompson, R. L. 1995. Task-technology fit and individual performance. MIS Quarterly, vol. 19, no. 2:213-236.
16. Hong, K.-K. & Kim, Y.-G. .2002. The critical success factors for ERP implementation: an organizational fit perspective. Information & Management, vol. 40:25-40.
17. Jayasuriya, R. 1998. Measuring service quality in IT services: using service encounters to elicit quality dimensions. Journal of Professional Services Marketing, vol. 10, no. 1:11-23.
18. Jesitus, J. 1997. Broken promises? FoxMeyer’s project was a disaster. Was the company too
aggressive or was it misled? Industry Week, vol. 3:31-37.
information service function. Decision Sciences, vol. 25, no. 5/6:737-766.
20. Kettinger,W.J.& Lee,C.C.(1995),“Exploring a“Gap”ModelofInformation Services Quality,”Information ResourcesManagementJournal,8(3),pp.5-16.
21. Kettinger, W. J. & Lee, C. C. 1997. Pragmatic perspectives on the measurement of iInformation systems service quality. MIS Quarterly, vol. 21, no. 2:223-240.
22. Krasner, H. 2000, Ensuring e-business success by learning from ERP failure. IT Pro, January/February:22-27.
23. Kukafka, R., Johnson, S. B., Linfante, A. & Allegrante, J. P. 2003. Grounding a new information technology implementation framework in behavioral science: A systematic analysis of the literature on IT use. Journal of Biomedical Informatics, vol. 36:218-227. 24. Legris, P., Ingham, J. & Collerette P. 2003. Why do people use information technology? A
critical review of the technology acceptance model. Information & Management, vol. 40, no. 3:191-204.
25. Lyytinen, K. & Hirschheim, R. 1987. Information failure –A survey and classification of the empirical literature. Oxford Surveys in Information Technology, vol. 4:257-309.
26. Khoo, M. 2001. Community design ofDLESE’scollections review policy: A technological
frames analysis. ACM JCDL’01,June 24-28, Roanoke, Virginia, USA.
27. Mathieson, K. 1991. Predicting user intentions: Comparing the technology acceptance model with the theory of planned behavior. Information Systems Research, vol. 2, no. 3:173-191. 28. McGoverna, T. & Hicks C. 2004. How political processes shaped the IT adopted by a small
make-to-order company: a case study in the insulated wire and cable industry. Information &
Management, vol. 42:243–257.
technological change: Social-technical configuration and frames. Technology Analysis & Strategic Management, vol. 12, no. 1:17-37.
30. Myers, B. L., Kappelman L. A. & Prybutok V. R. 1997. A comprehensive model for assessing the quality and productivity of the information systems function: Toward a theory for
information systems assessment. Information Resources Management Journal, vol. 10, no. 1:6-25.
31. Orlikowski, W. J. & Gash D. C. 1994. Technological frames: making sense of information technology in organizations. ACM Transactions on Information Systems, vol. 12, no. 2:174-207.
32. Parasuraman, A., Berry, L. L. & Zeitharml, V. A. 1991. Refinement & reassessment of the SERVQUAL scale. Journal of Retailing, vol. 67:420-450.
33. Parasuraman, A., Zeitharml, V. A. & Berry, L. L. 1985. A conceptual model of service quality and its implications for future rResearch. Journal of Marketing, vol. 49, no. 4: 41-50.
34. Parasuraman, A., Zeitharml, V. A. & Berry, L. L. 1988. SERVQUAL: A multiple-item scale for measuring consumer perceptions of service quality. Journal of Retailing, vol. 64, no. 1:12-40.
35. Parasuraman, A., Zeitharml, V. A. & Berry, L. L. 1994. Alternative scale for measuring service quality: A comparative assessment based on psychometric and diagnostic criteria. Journal of Retailing, vol. 70, no. 3:201-230.
36. Payton, F. C. and Zahay, D. 2003. Understanding why marketing does not use the corporate data warehouse for CRM applications. Journal of Database Management; vol. 10, no. 4:315-326.
systems effectiveness. MIS Quarterly, vol. 19, no. 2:173-187.
38. Pitt, L. F., Watson, R. T. & Kavan, C. B. 1997. Measuring information systems service quality: Concerns for a complete canvas. MIS Quarterly, vol. 21, no. 2:209-221. 39. Plouffe, C. R., Hulland, J. & Vandenbosch, M. 2001. Research report: Richness versus
parsimony in modeling technology adoption eecisions –understanding merchant adoption of
a smart card-based payment system. Information Systems Research. vol. 12, no. 2:208-222.
40. Rajagopal, P. 2002. An innovation–diffusion view of implementation of enterprise resource
planning systems and development of a research model. Information and Management, vol.
40:87–114.
41. The Standish Group. 1995. The CHAOS Report. http://www.standishgroup.com.
42. Scott, F. and Shepherd, J. 2002. The steady stream of ERP investments. AMR Research, accessed on Monday, 26 August 2002 from
http://www.amrresearch.com/Content/view.asp?pmillid=14775&docid=9379.
43. Scott, J. E. and Vesseyge, I. 2002. Managing risks in enterprise systems implementations. Communications of the ACM, vol. 45, no. 4:74-81.
44. Somers, T. M. & Nelson, K. G. 2004. A taxonomy of players and activities across the ERP project life cycle. Information & Management, vol. 41:257-278.
45. Strong, D. M. & Volkoff, O. 2004. A roadmap to enterprise system implementation”, IEEE
Computer, June:22-29.
46. Taylor, S., & Todd, P. A. 1995a. Assessing IT usage: The role of prior experience. MIS Quarterly, vol. 19, no. 4:561-570.
47. Taylor, S., & Todd, P. A. 1995b. Understanding information technology usage: A test of competing models. Information Systems Research, vol. 6, no. 4:144-176.
48. Thompson, J. B. 1990. Ideology and Modern Culture: Critical Social Theory in the Era of Mass Communication. Polity Press, Cambridge.
49. Thompson, J. B. 1995. The Media and Modernity: A Social Theory of the Media. Polity Press, Cambridge.
50. Umble, E.-J., Haft, R.-R. & Umble, M.-M. 2003. Enterprise resource planning:
implementation procedures and critical success factors. European Journal of Operational Research, vol. 146:241-257.
51. Van Dyke, T. P., Kappelman, L. A. & Prybutok, V. R. 1997. Measuring information systems service quality: Concerns on the use of the SERVQUAL questionnaire. MIS Quarterly, vol. 21, no. 2:195-208.
52. Venkatesh V. & Davis, F. D. 1996. A model of the antecedents of perceived ease of use: development and test. Decision Sciences, vol. 27:451-481.
53. Venkatesh V. & Davis, F. D. 2000. A theoretical extension of the technology acceptance model: Four longitudinal field studies. Management Science, vol. 46, no.2:186-204. 54. Venkatesh V., Morris, M. G., Davis, G. B. & Davis, F. D. 2003. User acceptance of
information technology: Toward a unified view. MIS Quarterly, vol. 27, no. 3:425-478. 55. Vogt, C. 2002. A comprehensive analysis of failed enterprise-resources-planning projects.
Software Engineering Notes, vol. 27, no. 2:62-68.
56. Wixom, B. H. and Watson, H. J. 2001. An empirical investigation of the factors affecting data warehousing success. MIS Quarterly; vol. 25, no. 1:17-41.
57. Yeo, K.-T. 2002. Critical failure factors in information system projects. International Journal of Project Management, vol. 20:241-246.
Balancing Customer Perceptions and Expectations. Free Press, New York.
59. Venkatesh V. & Davis, F. D. 1996. A model of the antecedents of perceived ease of use: development and test. Decision Sciences, vol. 27:451-481.
60. Zeitharml, V. A., Berry, L. L. & Parasuraman, A.1993. The nature & determinants of
customer expectations of service. Journal of the Academy of Marketing Science, vol. 21, no. 1:1-12.