Evidence of the existence of the low-density liquid
phase in supercooled, confined water
Francesco Mallamace*†‡, Matteo Broccio*, Carmelo Corsaro*, Antonio Faraone*, Domenico Majolino*, Valentina Venuti*, Li Liu†, Chung-Yuan Mou§, and Sow-Hsin Chen†‡
*Dipartimento di Fisica and Consorzio Nazionale Interuniversitario per le Scienze Fisiche della Materia, Universita´ di Messina, C. da Papardo, S. ta Sperone 31, 98166 Messina, Italy ;†Department of Nuclear Science and Engineering, Massachusetts Institute of Technology, Cambridge,
MA 02139; and§Department of Chemistry, National Taiwan University, Taipei 10617, Taiwan
Edited by H. Eugene Stanley, Boston University, Boston, MA, and approved November 14, 2006 (received for review August 16, 2006)
By confining water in a nanoporous structure so narrow that the liquid could not freeze, it is possible to study properties of this previously undescribed system well below its homogeneous nu-cleation temperature THⴝ 231 K. Using this trick, we were able to
study, by means of a Fourier transform infrared spectroscopy, vibrational spectra (HOH bending and OH-stretching modes) of deeply supercooled water in the temperature range 183 < T < 273 K. We observed, upon decreasing temperature, the building up of a new population of hydrogen-bonded oscillators centered around 3,120 cmⴚ1, the contribution of which progressively dominates the spectra as one enters into the deeply supercooled regime. We determined that the fractional weight of this spectral component reaches 50% just at the temperature, TL ⬇ 225 K, where the
confined water shows a fragile-to-strong dynamic cross-over phe-nomenon [Ito, K., Moynihan, C. T., Angell, C. A. (1999) Nature 398:492– 494]. Furthermore, the fact that the corresponding OH stretching spectral peak position of the low-density-amorphous solid water occurs exactly at 3,120 cmⴚ1[Sivakumar, T. C., Rice, S. A., Sceats, M. G. (1978) J. Chem. Phys. 69:3468 –3476.] strongly suggests that these oscillators originate from existence of the low-density-liquid phase derived from the occurrence of the first-order liquid–liquid (LL) phase transition and the associated LL critical point in supercooled water proposed earlier by a computer molecular dynamics simulation [Poole, P. H., Sciortino, F., Essmann, U., Stanley, H. E. (1992) Nature 360:324 –328].
dynamic cross-over in water兩 dynamic transitions in water 兩 Fourier transform infrared spectroscopy兩 low-density liquid water 兩 Widom line in water
W
ater plays a fundamental and ubiquitous role on Earth and in all aspects of life phenomena. Understanding its prop-erties is of paramount importance to mankind, and thus water is the most studied molecular system in science and technology. However, despite intense scrutiny over the years, scientists are still far from reaching a coherent understanding of all its unusual properties (1–3). Instead of behaving like other simple molecular liquids, many thermodynamic response functions of water, such as the isothermal compressibility, isobaric heat capacity, and thermal expansion coefficient, display counterintuitive trends as temperature is lowered. In particular, extrapolated from their values at moderately supercooled states, these functions all appear to diverge at a singular temperature around TS⫽ 228 K.Over the years, many plausible explanations for these strange behaviors have been proposed, starting from the two-state and the clathrate models (1–3). Three hypotheses are of active interest: (i) the stability limit (4), (ii) the percolation (5), and (iii) liquid–liquid (LL) critical point (6). The third approach has received support from various theoretical studies (7–9). How-ever, in all three approaches, the main role is played by the local hydrogen-bond (HB) interaction pattern surrounding a typical water molecule in liquid state that governs the overall structure and dynamics (1) of water.
Some of our recent experimental results (10, 11) on water confined in nanoporous structures as a function of temperature and pressure showed that the theoretical approach based on existence of the LL critical point is able to describe coherently many strange properties of water. By using the neutron-scattering technique, we obtained evidence of the LL critical point (the second critical point predicted by the theory to be at TC⬃ 220 K and PC⬃ 1 kbar) located at TC⫽ 200 K and PC⫽
1.5 kbar (10). This result was also subsequently confirmed qualitatively by an extensive molecular dynamics (MD) simula-tion (12). In a series of experiments using both neutron scattering and NMR spectroscopies, a fragile-to-strong dynamic cross-over (FSC) (13) and the Stokes–Einstein relation violation (SEV) (14) at and below the cross-over were observed (11). The FSC marks a transition from a Vogel–Fulcher–Tamman (VFT) to an Arrhenius behavior in dynamical parameters such as the average translational relaxation time and the inverse self-diffusion co-efficient (11). Both the FSC and SEV take place at the ambient pressure at approximately the same temperature, TL⬃ 225 K.
Furthermore, on the P–T phase diagram the observed FSC line coincides with the so-called Widom line (10,12). The Widom line is the critical isochore above the critical point in the one-phase region. The neutron-scattering experiment located the end point of the Widom line, which is the predicted LL critical point. The LL critical point approach is based on an argument advocating the continuation of the local structure of the liquid water into its amorphous solid phases (1–3). Water is known to have both low-density amorphous (LDA) (15) and high-density amorphous (HDA) (16, 17) solid phases; LDA and HDA can be made at lower T (17–20), i.e., below TX⫽ 135 K, and can be transformed
from one to the other by changing pressure (17). It is therefore likely that the liquid state is a mixture of the two corresponding liquid phases, a low-density liquid (LDL) and a high-density liquid (HDL) (6–9). The difference between the two liquids lies in their local structures: in the HDL, the local tetrahedrally coordinated HB structure is not fully developed, whereas in the LDL, a more open, locally ‘‘ice-like’’ HB network is fully realized (1–3).
In this work, using the Fourier transform infrared (FTIR) spectroscopy in the temperature range 273–183 K, we give direct evidence of the existence of the LDL phase in deeply super-cooled water. We can probe liquid water at these very low
Author contributions: F.M. and S.-H.C. designed research; F.M., M.B., C.C., D.M., and V.V. performed research; C.-Y.M. contributed new reagents/analytic tools; F.M., M.B., C.C., D.M., and V.V. analyzed data; and F.M., M.B., C.C., A.F., L.L., and S.-H.C. wrote the paper. The authors declare no conflict of interest.
This article is a PNAS direct submission.
Abbreviations: LDL, low-density liquid; HDL, high-density liquid; LDA, low-density amor-phous; HDA, high-density amoramor-phous; HB, hydrogen bond(ed); NHB, non-HB; MD, molec-ular dynamics; LL, liquid–liquid; FSC, fragile-to-strong dynamic cross-over; OHS, OH stretch-ing; SEV, Stokes–Einstein relation violation.
‡To whom correspondence may be addressed. E-mail: francesco.mallamace@unime.it or
sowhsin@mit.edu.
temperatures by using the clever trick of confining water into nanopores so narrow that the liquid cannot freeze. As is well known, there is an inaccessible temperature region for bulk liquid water that extends from its homogeneous nucleation temperature TH⫽ 231 K to TX. In certain nanoscale
confine-ments, the water molecules are unable to form a long-range crystalline structure; water thus remains fluid and, like any other supercooled liquid, becomes increasingly viscous as T ap-proaches TG. Here, as done in the aforementioned experiments
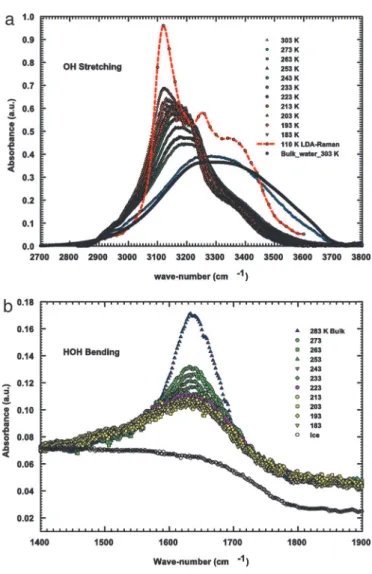
(neutron and NMR) (10, 11), we used as confining system a micelle-templated nanoporous silica matrix MCM-41-S (having 1D cylindrical tubes arranged in a hexagonal structure with a pore diameter of 1.4 nm) (10, 21). As proven by several experimental methods, this MCM system can be regarded as one of the most suitable adsorbent models available (22, 23). In particular, it has been shown that in such a system, water dynamics is weakly affected by confinement effects. Fig. 1a shows the experimental FTIR OH stretching (OHS) spectra of the confined water, whereas Fig. 1b gives the corresponding spectra of the HOH bending motion.
Spectroscopic methods have been powerful tools for explain-ing structural and dynamical properties of water. From neutron (10, 26–28), x-ray (29), Raman, and IR (30–33) spectroscopic experiments, we now have evidence that water is characterized by the existence of two coexisting main HB structural phases. In particular, these experimental results point out that liquid water can be considered in the frame of a ‘‘mixture model’’ involving HB and non-HB (NHB) molecules. On these bases, it became customary to analyze OHS spectra by considering two general classes of O-H oscillators. These classes, however, encompass broad Gaussian components, each of which refers to structures that involve a range of bond angles and distances distributed around the component peak position.
For bulk liquid water, in the range 283⬍ T ⬍ 368 K, the OHS spectra have been described, as observed by Raman scattering and IR absorption, by the following Gaussian peak positions (wavenumber) (30–33): (I) 3,220 cm⫺1, (II) 3,400 cm⫺1, (III) 3,540 cm⫺1, and (IV) 3,620 cm⫺1(all with an experimental error of⫾20 cm⫺1). By considering different scattering orientations (corresponding to the mean polarizability␣ and the anisotropy ), the HB and NHB OHS oscillators for water were identified by assigning the contribution I (the lowest in wavenumber) to fully bonded water molecules having a coordination number close to four (as this component sits close to the OHS band observed in ice), i.e., those that can generate HB networks. Conversely, the highest wavenumber components III and IV are ascribed to molecules poorly connected to their environment and to multimer molecules, respectively. Between these Gaussians lies the component II, associated to water molecules having an average degree of connection larger than that of dimers or trimers, but lower than those involved in the HB networks. The evolution of OHS spectra indicates that as T increases the HB, OHS oscillators are replaced by the NHB ones at a higher frequency (and vice versa on decreasing T). This behavior suggested the existence of an isosbestic point frequency in the OHS spectra in the temperature range 283 ⬍ T ⬍ 358 K; however, such a picture has revealed to be not valid in the supercooled regime (32). The exploration of the OHS spectra in bulk water down to 246 K indicated the presence of a new Gaussian contribution centered at⬇3,120 cm⫺1, whose magni-tude increases as T decreases (32). Such a component, which arises at⬇284 K, was originally attributed to the existence in supercooled bulk water of true ice as heterophase fluctuations. Raman and IR spectra depend on different properties of the vibrations so differences in component spectral parameters are to be expected. However, the measured peak positions are the same, within the experimental error, whereas differences may be observed in the corresponding intensities and linewidths.
How-ever, a careful comparison between Raman and FTIR– attenuated total reflection (ATR) measurements in water shows that experimental full widths at half maximum (FWHM) coin-cide within a 15% (or less) error window (34). This result means that results of the two techniques can be used complementarily to explore the water vibrational dynamics.
Results
The obtained OHS–FTIR spectra are reported in Fig. 1. A first comparison of these spectra for confined water with that of bulk water at 303 K reveals small changes in the HB and NHB populations (just in terms of the conventional assignments for spectral components). The OHS component I (3,220 cm⫺1) increases with respect to the rest, indicating an increase in the
Fig. 1. The experimental FTIR OHS and HOH bending vibrational bands. (a) The OHS bands measured at the different temperatures in the 2,700 –3,800 cm⫺1range of water confined in MCM-41-S samples and of pure bulk water at
T⫽ 303 K. For comparison, the Raman spectra corresponding to the LDA solid
water for T⫽ 110 K (24) is shown as a dashed–dotted line. (b) The HOH bending modes of confined water at the investigated temperatures. For comparison, the spectral contributions of pure bulk water (283 K) and poly-crystalline ice (243 K) are also reported. The following observations can be made: (i) a strong similarity of spectra of supercooled water with that of bulk water (at 283 K); and (ii) the spectra have a Gaussian-like form quite different from the nearly flattened form typical of polycrystalline ice, shown in the lower part of the figure. This difference is good evidence that confined water remains in liquid state in all of the studied T range. The intensity decrease of this mode, upon decreasing T, indicates a sudden increase in the molecular connectivity (25).
APPLIED
PHYSICAL
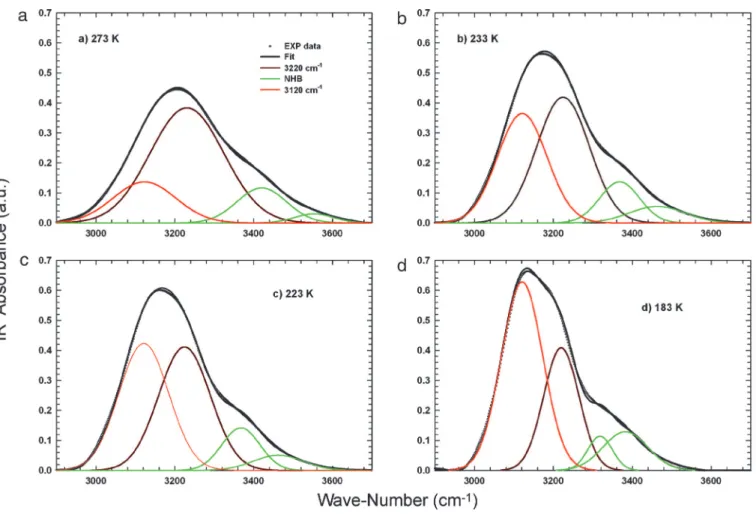
number of HB oscillators. By decreasing T in the supercooled regime, such a contribution becomes dominant. In addition, the reported OHS spectra of confined water measured at the lowest temperatures confirm the presence of the additional spectral contribution (V) at⬇3,120 cm⫺1. By following the suggestions of the scenario represented in Fig. 1, inside the T range inaccessible for bulk water, such a spectral contribution seems to play a determinant role in the water physics. With such an idea in mind, we have studied the OHS spectra by means of a spectral deconvolution with four Gaussian components: the V (3,120 cm⫺1) contribution and the three other I (3,220 cm⫺1), II (3,400 cm⫺1), and III (3,540 cm⫺1), coming from the well established studies of OHS vibrational spectra (30–33) (Fig. 2). As can be observed, these low-frequency oscillators (I and V, attributable to HB molecules) give the largest contribution to the OHS spectra in the supercooled regime, so we now focus only on them. The first experimental evidence from this data analysis is that at all of the studied temperatures the relative area (the ratio of the component integrated area to the total OHS integrated area) of the HB and NHB remains approximately constant, in a ratio of 82% to 18%, respectively (Fig. 3a). In addition, on decreasing T, the relative area of the spectral component V increases with respect to component I. In the same figure, we also report the relative areas of the Gaussian contribution V measured by means of Raman scattering in bulk water in the range 246⬍ T ⬍ 273 K (32). As can be seen, there is a good agreement in the temperature evolution of this low wavenumbers contribution,
studied separately by Raman and FTIR, indicating that both refer to the same HB species.
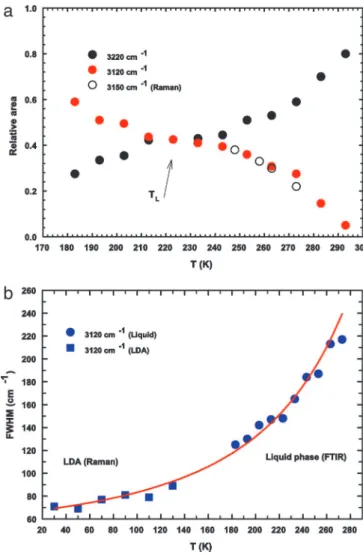
The most remarkable result shown by Fig. 3a on the popula-tion of the I and V oscillators on decreasing T is that their integrated areas cross at⬇225 K, i.e., at approximately the same temperature TL, at which the FSC (10,11) is observed. Thus, at
the temperature in which dynamical parameters indicate for water the cross-over from fragile to strong glass former (same region in which the SEV sets on), the OHS spectra show that the population of the OHS oscillators of the species V became dominant respect to that of species I. Another result that can further clarify this occurrence comes out from Fig. 3b in which the calculated FWHM values of the spectral contribution V are reported vs. T together with that of the same contribution measured by Raman scattering in the LDA water in the T range 30–130 K by Sivakumar et al. (24). As can be observed, besides an empty space (130⬍ T ⬍ 183 K), the reported data can be certainly connected with continuity from the liquid to the LDA region by means of a unique analytical curve. Inside this unstudied region, there is the glass transition of bulk water, whose exact location is still an open question (35). The overall behavior shown in this figure indicates a direct link between the contribution V of the OHS spectrum and the LDL phase of water. Thus, the data trend seems to demonstrate the idea proposed by the LL critical point hypothesis (6) on a striking correspondence between LDA and LDL. A substantial confir-mation of the idea that the contribution V really represents the
Fig. 2. The spectral deconvolution of the OHS spectra. (a) T⫽ 273 K. (b) T ⫽ 233 K. (c) T ⫽ 223 K. (d) T ⫽ 183 K. In all images, dots represent the experimental data, and the solid lines are the best fits. The red and brown lines represent the contributions of HB molecules to OHS oscillators, and the green lines are related to the spectral contributions from the NHB molecules (or weakly HB; refs. 30 –33). The red line refers to the component V centered at 3,120 cm⫺1and the brown line to the I component (3,220 cm⫺1). The green lines represent the spectral components II (3,400 cm⫺1) and III (3,540 cm⫺1), respectively.
LDL phase is also given by the fact that the V and I populations cross just at the FSC temperature TL, i.e., the locus of the Widom
line (Fig. 3a). A careful inspection also points out that in such a region the populations of both water species flatten, whereas NMR and quasi-elastic neutron scattering (QENS) data show a sharp kink. Such a result is reasonable: FTIR gives a measure of the vibrational density of states, whereas NMR and QENS concern the response functions due to fluctuations in collective parameters; thus, a smooth change in vibrations and an abrupt change in response functions have to be expected upon crossing the Widom line. The concentration values, 50/50, of the two LDL and HDL species agree with this result: in fact, fluctuations of collective properties are maximum in this situation.¶
The cited neutron experiment (10) and the MD simulation (12) show that in a P–T plane the TLtemperature line, connected
with the Widom line, has a negative slope indicating a lower-density liquid on the lower temperature side. Such an observa-tion was also corroborated by an MD simulaobserva-tion on supercooled liquid silicon (36) showing that at T ⬇ 1,060 K (below the freezing point) silicon undergoes a first-order LL phase transi-tion, from a fragile, dense liquid to a strong LDL with nearly tetrahedral local coordination. Furthermore, inelastic neutron-scattering experiments, which measure the librational density of states of water confined in MCM-41-S and the OH bending band, depicted in Fig. 1b, show that water remains in disordered liquid state both above and below the FSC at ambient pressure.
These observations and proper considerations on the activa-tion energy barrier for initiating the local structure relaxaactiva-tion (EA), measured by the analysis of the FSC at ambient pressure,
make it possible to identify the water structure above and below such a dynamical transition. From neutron (10) and NMR (11) experiments, we have obtained, at ambient pressure, for the low-T, strong liquid with EA⫽ 4.6 ⫾ 0.2 kcal/mol, whereas, in the
high-T, fragile liquid side (T⫽ 258 K), an inelastic scattering experiment of stretching vibrational band of water (37) indicated that the effective activation energy EAfor breaking the HB is 3.2
kcal/mol. These observations together with the findings of the MD simulation study in ref. 12 unambiguously clarify that the FSC is a separation locus between the HDL and LDL phases. More precisely, the high-temperature liquid corresponds to HDL where the locally tetrahedrally coordinated HB network is not fully developed, whereas the low-temperature liquid corre-sponds to the LDL where the more open, tetrahedrally coordi-nated HB network is fully developed.
On these bases, considering the results presented in Fig. 3, we can infer that component V (3,120 cm⫺1) represents the OHS spectral contribution of the LDL water. As can be observed, on decreasing T, the HB water population gradually evolves into the LDL phase. The onset of the FSC (and thus of the SEV) is realized when the population of this contribution exceeds the remaining HB structured water. On the other hand, the average translational relaxation time具T典, as measured by neutron
scat-tering (10) at different P and T, assumes values⬎103ps at the
FSC (and beyond), indicating the onset of a long-lived water structure compared with those at highest T. In conclusion, we remark that the crossing of the two water species populations, T⬃ 225 K, corresponds just to the Widom line. Previous NMR (11) and quasi-elastic neutron scattering (QENS) (10) data could be interpreted in terms of the Widom line only because they were supported by simulation results (12).
Methods
FTIR absorption measurements were performed at ambient pressure in the HOH bending and O-H stretching vibrational (OHS) spectral region, by using a DA8 FTIR spectrometer (Bomem, Quebec City, QC, Canada), operating with a Globar source (Globar, Amherst, NY), in combination with a KBr beamsplitter and a deuterated triglycine sulfate (DTGS)/KBr detector. To avoid saturation effects, we used the attenuated total reflection geometry, which is generally insensitive to sam-ple thickness. The spectra of interest were recorded with the resolution of 4 cm⫺1, automatically adding 200 repetitive scans to obtain a good signal-to-noise ratio and highly reproducible spectra; then they were properly normalized by taking into account the effective number of absorbers. The obtained spectra (Fig. 1) for the confined water are not smoothed; the only manipulation has been the baseline adjustment. Investigated samples have hydration levels of H⬇ 0.5 (0.5 g of H2O per g of
MCM). The spectral deconvolution was made by using a best-fit procedure. In the fitting process, all of the spectral parameter were left to be free. We noticed that the corresponding FWHM and intensities (integrated areas) showed changes, whereas the ¶A simulation based on the TIP5p model shows that the Widom line corresponds to an
⬇50/50 concentration of LDL, HDL species (P. Kumar, personal communication).
Fig. 3. The T evolution of the relative integrated areas and FWHM values of the significant spectral contributions of the OHS band (3,220 and 3,120 cm⫺1). (a) The relative integrated areas vs. T. Black filled circles correspond to the 3,220-cm⫺1contribution, and red symbols represent the 3,120-cm⫺1ones. Open circles refer to the latter spectral contribution as observed in pure bulk water (32). The arrow indicates the point at which the two contributions cross each other. This temperature is seen to coincide with the FSC of water at ambient pressure. (b) FWHM of the measured FTIR spectra. Blue dots represent that of the spectral contribution V centered at 3,120 cm⫺1vs. T. Blue squares are the same quantities measured in the LDA state (24). The solid red line connecting the liquid and LDA phase data is a guide for the eyes.
APPLIED
PHYSICAL
wavenumbers fluctuated within the experimental error (⫾20 cm⫺1). Fig. 2 also shows the fitting results.
We thank Prof. Eugene H. Stanley for fruitful discussions and Pradeep Kumar for providing his latest simulation results before publication. The
research at MIT is supported by a grant from Materials Science Division of the U.S. Department of Energy. The research in Messina was
supported by Ministero dell’Universita´ e della Ricerca Scientifica e
Technologica Grant MURST-PRIN2004. We benefited from affiliation with the European Union Marie Curie Research and Training Network on Arrested Matter.
1. Angell CA (1982) in Water: A Comprehensive Treatise, ed Franks F (Plenum, New York), Vol 7, pp 1–81.
2. Debenedetti PG, Stanley HE (2003) Physics Today 56:40–46. 3. Mishima O, Stanley HE (1998) Nature 396:329–334. 4. Speedy RJ (1982) J Phys Chem 86:982–991.
5. Stanley HE, Teixeira J (1980) J Chem Phys 73:3404–3422.
6. Poole PH, Sciortino F, Essmann U, Stanley HE (1992) Nature 360:324–328. 7. Moynihan CT (1997) Mater Res Soc Symp Proc 455:411–425.
8. Poole PH, Sciortino F, Grande T, Stanley HE, Angell CA (1994) Phys Rev Lett 73:1632–1635.
9. Borick SS, Debenedetti PG, Sastry SA (1995) J Phys Chem 99:3781–3793. 10. Liu L, Chen SH, Faraone A, Yen CW, Mou CY (2005) Phys Rev Lett 95:117802. 11. Mallamace F, Broccio M, Corsaro C, Faraone A, Wanderlingh U, Liu L, Mou
CY, Chen SH (2006) J Chem Phys 124:161102.
12. Xu LM, Kumar P, Buldyrev, SV, Chen SH, Poole PH, Sciortino F, Stanley HE (2005) Proc Natl Acad Sci USA 102:16558–16562.
13. Ito, K. Moynihan CT, Angell CA (1999) Nature 398:492–494. 14. Ediger MD (2000) Annu Rev Phys Chem 51:99–128.
15. Burton EF, Oliver WF (1936) Proc R Soc London A 153:166–172. 16. Mishima O, Calvert LD, Whalley E (1984) Nature 310:393–395. 17. Mishima O, Calvert LD, Whalley E (1985) Nature 314:76–78. 18. Smith RS, Huang C, Kay BD (1997) J Phys Chem B 101:6123–6126. 19. McMillan JA, Los SC (1968) Nature 206:806–807.
20. Johari GP, Hallbrucker A, Majer E (1987) Nature 330:552–553.
21. Shih PC, Lin HP, Mou CY (2003) Surf Sci Catal 146:557–560.
22. Schreiber A, Ketelsen I, Findenegg GH (2001) Phys Chem Chem Phys 3:1185–1195.
23. Morishige K, Nobuoka J (1997) J Chem Phys 107:6965–6969. 24. Sivakumar TC, Rice SA, Sceats MG (1978) J Chem Phys 69:3468–3476. 25. Walrafen GE (1972) in Water: A Comprehensive Treatise, ed Franks F (Plenum,
New York), Vol 1, pp 151–214.
26. Soper AK, Ricci MA (2000) Phys Rev Lett 84:2881–2884. 27. Bellissent-Funel MC, Bosio L (1995) J Chem Phys 102:3727–3735. 28. Zanotti JM, Bellissent-Funel MC, Chen SH (2005) Europhys Lett 71:91–97. 29. Bosio L, Chen SH, Teixeira J (1983) Phys Rev A 27:1468–1475.
30. Brubach JB, Mermet A, Filabozzi A, Gerschel A, Roy P (2005) J Chem Phys 122:184509.
31. Walrafen GE, Hokmababi MS, Yang WH (1986) J Chem Phys 85:6964–6969. 32. D’Arrigo G, Maisano G, Mallamace F, Migliardo P, Wanderlingh F (1995)
J Chem Phys 75:4264–4270.
33. Walrafen GE (1974) in Structure of Water and Aqueous Solutions, ed Luck WAP (Verlag Chemie, Weinheim, Germany), pp 248-284.
34. Sammon C, Mura C, Yarwood J, Everall N, Swart R, Hodge D (1998) J Phys
Chem B 102:3402–3411.
35. Velikov V, Borick S, Angell CA (2001) Science 294:2335–2338. 36. Sastry S, Angell CA (2003) Nat Mater 2:739–743.