Comparison of the Solubility and Dissolution Rate of
Gliclazide-
β-cyclodextrin Inclusion Complexes Prepared by
Liquid/liquid Extraction and Neutralization
YUNG-KUANG LO, CHU-PING HSU, TONG-RONG TSAI AND THAU-MING CHAM*Graduate Institute of Pharmaceutical Sciences, Kaohsiung Medical University 100 Shih-Chuan 1st Road, San Min District, Kaohsiung City 807, Taiwan, R.O.C.
(Received: September 30, 2005; Accepted: April 14, 2006) ABSTRACT
The solid complexes of gliclazide and β-cyclodextrin were prepared by 2 methods, liquid/liquid extraction and neutraliza-tion. The phase-solubility diagram was used to calculate the stability constant of gliclazide and β-cyclodextrin. According to the molar stoichiometry, the complex of gliclazide with β-cyclodextrin was prepared following the 1:1 ratio. The interaction between gliclazide and β-cyclodextrin was analyzed by Fourier-transform infrared spectroscopy and differential scanning calorimetry. The dissolution rate of gliclazide from the complex made by liquid/liquid extraction was faster than those from neutralization method, physical mixtures and pure drug. The mean particle size of two complexes was smaller with a narrower size distribution than those of physical mixtures and β-cyclodextrin. The results indicate that liquid/liquid extraction method, as well as neutralization method, provides some signs of improvement in the solubility and dissolution rate of gliclazide.
Key words: Gliclazide, Cyclodextrin, Liquid/liquid extraction, Neutralization, Solubility
INTRODUCTION
The application of complexation in different drugs with cyclodextrins (CDs) has been extensively studied in recent years to improve specific characteristics of phar-maceutical interest, such as solubility in aqueous media, dissolution rate(1-3), chemical stability(4), and bioavail-ability(5-6). Six to eight glucose units linked by a-1,4-glucosidic bonds compose the cyclic oligosaccharides known as CDs. CDs that have a large internal axial cavity are crystalline and nonhygroscopic with cylinder-shaped and macro ring structure. The internal cavity of a CD molecule is hydrophobic, while its outer surface is hydro-philic(7-8). Occupying the cavity of CDs molecule by either the whole or partial drug molecule, CDs are able to form the inclusion complexes with many drugs(9).
As a second generation of sulfonylurea, Gliclazide [GL; 1-(1-azabicyclo(3,3,0) octyl)-3-(p-tolylsulfonylurea)] is widely used in the treatment of non-insulin dependent diabetes mellitus (NIDDM). Due to its short-term acting, GL has been considered suitable for diabetic patients with renal impairment and for elderly patients that have reduced renal function and follow a sulphonylureas treat-ment which may increase the risk of hypoglycemia(10). This GL molecule is characterized by low solubility in gastric fluids, low dissolution rate and interindividual variability in its bioavailability(11).
The present study was to investigate the inclusion mode between GL and β-CD in the solid state using
differ-ential scanning calorimetry (DSC) and Fourier-transform infrared spectroscopy (FTIR). Physical mixing, neutral-ization and liquid/liquid extraction method were used for the preparation of inclusion complex. The dissolution rate and the solubility of two solid complexes were also evaluated. The employment of liquid/liquid extraction in preparing this complex has not yet been reported(12-15), and the method has an advantage of reduced preparation time. The primary purpose of this study was to compare the dissolution rate and the solubility between these two complexes prepared by neutralization and liquid/liquid extraction method. The results suggest that a transfor-mation of GL into a salt form or nanoparticle may be employed to increase its solubility and enhance its disso-lution rate as well.
MATERIALS AND METHODS I. Materials
GL was a gift from Lotus Pharmaceutical Co., Ltd. (Taipei, Taiwan). β-CD was purchased from Roquette Fréres (Lestrem, France). Tolbutamide was purchased from Sigma Chemical Co. (Louis, USA). All other mate-rials were of either reagent or analytical grade.
II. Phase-solubility Assays
Phase-solubility studies were employed to deter-mine the ratio of complexation of GL and β-CD. Excess
* Author for correspondence. Tel:+886-7-3121101 ext. 2254; Fax:+886-7-3210683; E-mail:[email protected]
amounts of GL were added to 10 mL of deionized water containing various concentrations of β-CD (0.005 to 0.1 M). The suspensions were shaken at 25±1°C for 3 consecu-tive days. After equilibrium was attained, the samples were filtered with a 0.45 μm membrane filter and assayed by HPLC method. According to the following formula proposed by Higuchi and Connors(16), the apparent 1:1 ratio stability constant (Ks) was calculated by the linear regression analysis method (Y = Slope X + Intercept) from the initial upright portion of the phase-solubility diagram.
Ks = Slope Intercept × (1–Slope) (1) III. Analysis of the Precision and Accuracy of GL
The precision and accuracy of GL were assayed using a HPLC method, which includes Waters 2690D separa-tions module (Milford, USA) and Supelco Discovery® C18 column (5 μm, 250 × 4.6 mm I.D.) (Bellefonte, USA). The mobile phase consisted of methanol/water (65:35 v/v) adjusted to pH 3.0 with phosphoric acid at the flow rate of 1.0 mL/min. A 20 μL sample and tolbutamide as internal standard were injected together and absorbed at 225 nm with Waters 2996 photodiode array detector.
Fresh standard GL solutions for preparation of calibra-tion curve was measured at 8:00 am, 10:00 am, 12:00 pm, 2:00 pm, 4:00 pm and 6:00 pm for six consecutive days. The average, standard deviation, variation and relative difference of GL contents were calculated to evaluate the stability of analytic condition, as well as the precision and the recurrence of measured data.
IV. Preparation of Solid Complex
Based on the results of the phase-solubility studies, the complexes were prepared in 1:1 GL:β-CD molar ratio. (I) Preparation of the Physical Mixture
Accurately weighed, GL and β-CD were passed through 40 meshes and blended in a mortar for 10 min. (II) Neutralization Method
GL was weighed and poured into 50 mL of 1 N sodium hydroxide solution, and then β-CD was added and stirred until a clear solution was obtained. 50 mL of 1 N hydrochloric acid was dripped into the solution and stirred for 2 hours. The formed precipitate was separated by vacuum filtration and washed repeatedly for three times by cool alcohol and then dried at room temperature(12-15). (III) Liquid/Liquid Extraction Method
GL was added to 50 mL of 1 N sodium hydrox-ide solution and stirred until a homogeneous solution
occurred. After clarification by continually stirring in β-CD, the mixing solution blended with 25 mL of ethyl acetate was poured into the separatory funnels. The phase of ethyl acetate was collected after the mixing solution was shaken for about 2 min. This extraction was repeated four times and the collected aqueous phase was evapo-rated at 40°C until the solid complex was obtained. V. DSC Thermogram Studies
DSC scans of GL, β-CD, physical mixture and two solid complexes were recorded on a Perkin-Elmer model DSC 7 (Norwalk, USA). The instrument was calibrated with indium and zinc prior to analyzing the samples under nitrogen at the flow rate of 20 mL/min. 4 mg of each sample was scanned in sealed aluminum pans at the heating rate of 20°C/min over the temperature range of 50-250°C.
VI. FTIR Spectroscopic Studies
The FTIR spectra were performed on Perkin-Elmer spectrum System 2000 FTIR spectrometer (Norwalk, USA). GL, β-CD, physical mixture and two solid complexes were prepared by the KBr disc method and scanned at the resolution of 4 cm-1 over the wavenumber region 4000-400 cm-1. Air was used as the background and the data were averaged from 10 scans.
VII. Dissolution Test
According to the USP 24 paddle apparatus, in vitro dissolution tests were performed with Hanson SR8 Plus (Chatsworth, USA). Four Samples containing 80 mg of GL, equivalent amount of two inclusion complexes and a physical mixture were poured separately into 900 mL of deionized water at 37 ± 0.5°C with stirring rate at 100 rpm. Afterwards, 0.2 mL of each sample was withdrawn respectively at 1, 3, 5, 10, 15, 30, 60 and 120 min by the Waters transfer module (Milford, USA). Subsequently, the concentration of the samples was assayed using the HPLC method.
VIII. Particle Size Measurement
Laser diffraction was used to measure the particle sizes of GL, β-CD, physical mixture and two solid complexes. The measurements were performed with a particle size analyzer Beckman Coulter LS230 (Miami, USA). Prior to measurements, about 50 mg of each sample were diluted with 100 mL of ethylene glycol. The five particle size distributions were estimated by setting the intensity of the scattered light at λ=750 nm and the scattering angle at θ=0.017-34°. The background medium was ethylene glycol (η=16.1 mPa·s) and refractive index was 1.431.
RESULTS AND DISCUSSION I. Phase-solubility Studies
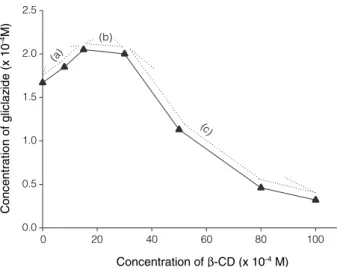
The phase-solubility diagram obtained for GL-βCD is represented in Figure 1. The shape of the solubility diagram followed a Bs type system(16), and the solubility of GL was 1.67×10⁻⁴ M which was similar to that of the previ-ous reports(15). The initial solubility of GL was rapidly raised as the concentration of β-CD increased (Figure 1(a)). When β-CD was continually increased, the solubility of GL remained unchanged (see the short plateau on Figure 1(b)). Instantaneously, the solubility of GL was decreasing along with the augmentation of β-CD (Figure 1(c)). According to eq 1, the calculation of the stability constant (Ks) was 155.2 M-1. The slope of eq 1 was calculated by the linear regression analysis method (Y = 2.53×10⁻² X + 2×10⁻⁴) from the initial upright portion of the solubility diagram (Figure 1(a)). We found that our stability constant (Ks) was obviously different from other previous reports(13-16), perhaps due to shorter shaking time or different sources of materials. In short, the phase solubility study suggested the formation of GL-βCD inclusion complex with 1:1 molar ratio, and the equimolecular GL-βCD was then prepared for the next complexation step.
II. Validation of Quantification Method
Calibration curve of GL, Y = 0.0243 X - 0.031 (r = 0.9999), showed the excellent linear relationship with concentration ranged between 10.0 and 100.0 μg/mL. Precision and accuracy of chromatography are listed in Table 1. The lowest measurable concentration was 10.0 μg/mL and C.V.% was from 0.21 to 4.09, so the result was sufficiently acceptable.
III. Evidence of GL-βCD Complexation (I) DSC Thermogram Studies
For drugs that form inclusion complexes with CDs, DSC is a fast and relatively inexpensive technique to examine the absence of the drug melting endotherm in order to verify if the drug is successfully complexed(17). The results of DSC thermogram for five samples are shown in Figure 2. The DSC curve of GL showed an endothermic reaction and its melting peak was at the onset temperature of 175°C. The thermal behavior of β-CD exhibited a slight upward curve at 115°C; howev-er, it was an amorphous reaction. Corresponding to
Table 1. Intra-day and Inter-day analytical precision and accuracy of GL determination
Concentration (μg/mL)
Intra-day (n = 6) Inter-day (n = 6) Precision
Mean ± S.D. (C.V.%) Accuracy R.E.(%) Mean ± S.D. (C.V.%)Precision Accuracy R.E.(%) 10.00 9.98 ± 0.36 (3.61) -0.20 10.03 ± 0.41 (4.09) 0.30 20.00 19.92 ± 0.31 (1.56) -0.40 20.05 ± 0.37 (1.85) 0.25 40.00 40.12 ± 0.22 (0.55) 0.30 40.26 ± 0.29 (0.72) 0.65 80.00 80.19 ± 0.18 (0.22) 0.24 81.05 ± 0.31 (0.38) 1.31 100.00 100.58 ± 0.21 (0.21) 0.58 101.02 ± 0.28 (0.28) 1.02 Concentration ofB-CD (x 10-4M) 0 20 40 60 80 100 C on ce nt ra tio n of g lic la zi de (x 10 -4M ) 0.0 0.5 1.0 1.5 2.0 2.5 (a) (b) (c)
Figure 1. Phase solubility diagram of the GL-βCD system in water
at 25°C. Temperature (°C) 60 80 100 120 140 160 180 200 H eat Flow (m W) (1) (2) (3) (4) (5)
Figure 2. DSC curves of (1) GL, (2) β-CD, (3) physical mixture, (4)
neutralization solid complex, and (5) liquid/liquid extraction solid complex.
GL melting, the thermogram of the physical mixture revealed an evident peak at 175°C. Furthermore, the curve of physical mixture showed a similar upward phenomenon as the one of β-CD. Nevertheless, this peak shifted from 115 to 145°C due to the interaction of β-CD and GL.
From the thermogram, we found that two inclu-sion complexes from neutralization and liquid/liquid extraction had different reactions. First of all, the solid complex of neutralization showed a very small melting peak at the temperature of 175°C, which may be caused by remains of GL. Secondly, the thermal behavior of the solid complex from liquid/liquid extraction demonstrated no reaction from any temperature intervals that could be attributed to the molecule of GL entering into the β-CD cavity. The absence of the DSC thermogram for this solid complex can also be suspected for its amorphous character. Eventually, the thermogram of amorphous GL-βCD from liquid/liquid extraction reveals its endo-therm characters that come from the dehydration of β-CD and the loss of the endothermic melting peak found in the crystalline GL. This also indicates that GL is well dispersed into the β-CD cavity and its recrystallization is restrained(18).
(II) FTIR Spectroscopy Studies
FTIR spectra were employed to confirm the complex-ation of GL/β-CD from liquid/liquid extraction and neutralization. The spectra of two complexes were also compared with GL, β-CD and the physical mixture (Figure 3 and Table 2).
Accordingly, the spectrum of GL for carbonyl group showed a sharp concave curve at 1709 cm-1. Both inclu-sion complex bands, however, were broader with less frequency and shifted from 1709 to 1725 cm-1. This reaction seems to result from the interaction between the hydroxyl groups of β-CD and the carbonyl groups of GL that is in good agreement with published researches(13,19).
For the sulphonyl group bands, the spectra of GL are characterized by a symmetric stretching peak at 1164 cm-1 and an antisymmetric stretching peak at 1350 cm-1. The symmetric vibration peak of two inclusion complexes presented less frequency and shifted from 1164 to 1156 cm-1, whereas the antisymmetric vibration peak performed the same frequency reduction and shifted from 1350 to 1335 cm-1. Based on the previous reports, the reasons for this phenomenon might be the interaction between the oxygen atoms of GL and the hydrogen atoms of β-CD(13,19).
For the amino group, GL demonstrated an evident CM-1 1000 2000 3000 4000 (1) (2) (3) (4) (5) % T 1164 1350 1709 3272 1162 1156 1156 1335 1335 1725 1725 3375 3375 1710 1352 3272
Figure 3. FTIR spectra of (1) GL, (2) β-CD, (3) physical mixture,
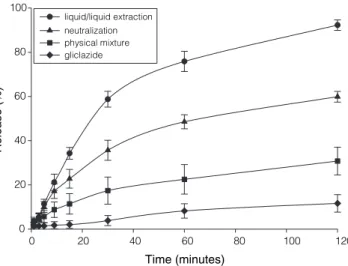
(4) neutralization solid complex, and (5) liquid/liquid extraction solid complex. Time (minutes) 0 20 40 60 80 100 120 Release (%) 0 20 40 60 80 100 liquid/liquid extraction neutralization physical mixture gliclazide
Figure 4. The dissolution profiles of liquid/liquid extraction solid
complex (●), neutralization solid complex (▲), physical mixture (■), and GL (♦).
Table 2. Comparison of FTIR spectra from GL, physical mixture and solid complexes from neutralization and liquid/liquid extraction
GL (cm-1) physical mixture (cm-1) Solid complexes Comment Neutralization (cm-1) extraction (cmLiquid/liquid -1)
1164 1162 1156 1156 Change in S=O symmetric stretching 1350 1352 1335 1335 Change in S=O antisymmetric stretching 1709 1710 1725 1725 Carbonyl/hydroxyl interaction 3272 3272 3375 3375 Amino/hydroxyl interaction
peak at 3272 cm-1. Nevertheless, a slight curve shifting from 3272 to 3375 cm-1 appeared on the two inclusion complexes bands. This phenomenon corresponds with the previous report as well(13).
On the other hand, the examination of spectra for the physical mixture showed only straight characters of two components. Moreover, the band had less frequency decrease than GL and it had no evident peak shift for carbonyl group, amino group and sulphonyl group. These findings were also similar with the previous data(13,19).
In short, the two inclusion complexes prepared from liquid/liquid extraction and neutralization had no signifi-cant characters of GL in the FTIR spectrum, suggesting these two complexes were well formed.
IV. Dissolution Behavior of GL-βCD
The dissolution profiles of GL, physical mixture and the two solid complexes from liquid/liquid extraction and neutralization are shown in Figure 4. The dissolution rates for two solid complexes were greater than physical mixtures and GL alone. The initial dissolution rate of GL was very slow with only about 5% of the drug dissolved in 30 min. The dissolution rates in this study were different from previous reports(12-13), which could be caused by the variation of dissolution condition and materials.
The complexation of GL with β-CD in FTIR analysis indicated that two solid complexes were well formed. The formation of these two solid complexes would increase the drug wettability and then enhanced its dissolution rates as well. We also found that the improvement of the dissolu-tion rate was related to the preparadissolu-tion method, since the liquid/liquid extraction method exhibits the highest disso-lution rates than the other solid complex.
V. Variation of Particle Size
The mean particle size of GL, β-CD, physical mixture and two solid complexes are listed in Table 3. We found that the particle size of β-CD was 160.04 ± 3.42 μm. However, the particle size of solid complex was 48.38 ± 2.08 μm from liquid/liquid extraction and 68.29 ± 2.76 μm from neutralization. Because of hydrogen bonding, the molecules of β-CD was bonded together and formed bigger
particle than those in two solid complexes. The particle size of complex from neutralization was bigger than the one from liquid/liquid extraction. This phenomenon may be due to partial uncomplexation of GL and β-CD.
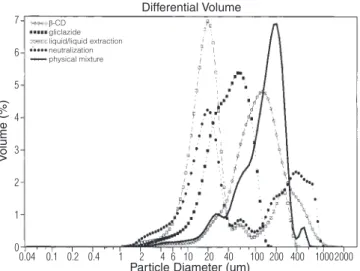
The particle size distributions of GL, β-CD, physi-cal mixture and two solid complexes are shown in Figure 5 and Table 3. Based on 80% of particle appearances of each sample, four size ranges were chosen and studied to discover real particle distributions. From the experi-ment result, 82.4% of β-CD particles were distributed between 40-400 μm, and 80.3% of solid complex particles from liquid/liquid extraction were between 5-50 μm. The solid complex particles from liquid/liquid extraction were smaller and had much more restricted particle distribution ranges than those of β-CD. In addition, only 53.4% of solid complex particles from neutralization were between 5-50 μm, of which 37.0% were between 100-1000 μm. This result suspected that little β-CD remained from the complexation of neutralization method. Nevertheless, the size distributions also showed a growing volume of small particles and a remarkably decreasing volume of large particles for two solid complexes. The results indicated that GL molecule may enter internal cavity of β-CD and then form a stable solid complex.
Figure 5. Particle size distributions of GL (■), β-CD (○), physical
mixture (▬), solid complex from neutralization (●), and solid complex from liquid/liquid extraction (□).
Differential Volume β-CD gliclazide liquid/liquid extraction neutralization physical mixture 7 6 5 4 3 2 1 0 0.04 0.1 0.2 0.4 1 2 4 6 10 20 40 100 200 400 1000 2000
Particle Diameter (um)
V
olume
(%)
Table 3. Mean size and volume of particle of GL, β-CD, physical mixture, and 2 solid complexes from neutralization and liquid/liquid
extraction (n = 3)
Materials Mean size ± S.D. (μm) Volume of particle ± S.D. (%)
5-50 μm 10-100 μm 40-400 μm 100-1000 μm GL 47.56 ± 2.11 61.0 ± 1.4 90.6 ± 2.2 52.6 ± 1.2 4.62 ± 2.8 β-CD 160.04 ± 3.42 16.1 ± 2.3 41.4 ± 1.8 82.4 ± 1.2 57.2 ± 1.1 Physical mixture 145.1 ± 5.81 15.0 ± 2.2 31.1 ± 1.6 86.9 ± 1.3 67.0 ± 1.4 Neutralization 68.29 ± 2.76 53.4 ± 1.9 50.3 ± 2.0 28.7 ± 1.8 37.0 ± 1.6 Liquid/liquid extraction 48.38 ± 2.08 80.3 ± 1.1 74.7 ± 1.7 18.8 ± 2.3 13.7 ± 2.5
CONCLUSIONS
According to phase-solubility studies, amorphous GL-βCD solid complexes were prepared at molar ratio 1:1 by liquid/liquid extraction and neutralization methods. The formation of two solid complexes was confirmed successful by FTIR analysis and DSC thermograms. FTIR analysis indicated the interaction of hydrogen bond-ing between the molecules of GL and β-CD. DSC ther-mograms demonstrated the absence of GL melting for amorphous solid complexes from liquid/liquid extraction, while the convex curve of solid complex from neutraliza-tion remained very small.
In regard to this dissolution study, drug releases from the solid complex by liquid/liquid extraction was faster than all other samples. The particle size measurement also found that the smallest particle was from the solid complex of liquid/liquid extraction. The reasons of this finding are attributed to the increase of drug wettability, the reduction of drug particle size and the prevention of drug aggregation.
The inclusion complex of GL-βCD prepared by liquid/liquid extraction method with less preparation time offers another suggestion for immediate released dosage of insoluble drug used in clinical therapy.
REFERENCES
1. Pitha, J., Milecki, J., Fales, H., Pannell, L., Uekama, K. 1986. Hydroxypropyl-β-cyclodextrin: preparation and characterization; effects on solubility of drugs. Int. J. Pharm. 29: 73-82.
2. Blanco, J., Vila-Jato, J.L., Otero, F., Anguiano, S. 1991. Influence of method of preparation on inclusion complexes of naproxen with different cyclodextrins. Drug Dev. Ind. Pharm. 17: 943-945.
3. Ammar, H.O., Ghorab, M., El-Nahhas, S.A., Emara, L.H., Makram, T.S. 1999. Inclusion complexation of furosemide in cyclodextrins. Pharmazie. 54: 142-144. 4. Andersen, F.A., Bundgaard, H. 1984. Inclusion
com-plexation of metronidazole benzoate with β-cyclodex-trin and its depression of anhydrate-hydrate transition in aqueous suspensions. Int. J. Pharm. 19: 189-197. 5. Chow, D., Karara, A. 1986. Characterization,
dissolu-tion and bioavailability in rats of ibuprofen-b-cyclodex-trin complex system. Int. J. Pharm. 28: 95-101.
6. Bekers, O., Uijtendaal, E.V., Beijnen, J.H., Bult, A., Underberg, W.J.M. 1991. Cyclodextrins in pharmaceuti-cal field. Drug Dev. Ind. Pharm. 17: 1503-1549.
7. Saenger, W. 1980. Cyclodextrin inclusion compounds in research and laboratory. Angew. Chem. Int. Ed. Engl. 19: 344-362.
8. Szejtli, J. 1998. Introduction and general overview of cyclodextrin chemistry. Chem. Rev. 98: 1743-1753. 9. Loftsson, T., Brewster, M.E. 1996. Pharmaceutical
applications of cyclodextrins. I. Drug solubilisation and stabilization. J. Pharm. Sci. 85: 1012-1025.
10. Tessier, D., Dawson, K., Tetrault, J.P., Bravo, G., Meneilly, G.S. 1994. Glibenclamide vs gliclazide in type 2 diabetes of the elderly. Diabet. Med. 11: 974-980.
11. Gillmann, A.G., Rall, T.W., Nies, A.S., Taylor, P. 1990. In: Goodman and Gillmann’s The Pharmacological Basis Therapeutics. 8th ed. pp. 1485-1486. Pergamon, Maxwell House, New York, U.S.A.
12. Moyano, J.R., Arias-Blanco, M.J., Gines, J.M. Giordano, F. 1997. Solid-state characterization and dissolution characteristics of gliclazide-β-cyclodextrin inclusion complexes. Int. J. Pharm. 148: 211-217.
13. Özkan, Y., Atay, T., Dikmen, N., Işimer, A., Aboul-Enein, HY. 2000. Improvement of water solubility and in vitro dissolution rate of gliclazide by complexation with beta-cyclodextrin. Pharm. Acta Helv. 74: 365-370. 14. Aggarwal, S., Singh, P.N., Mishra, B. 2002. Studies on
solubility and hypoglycemic activity of gliclazide beta-cyclodextrin-hydroxypropylmethyl cellulose complexes. Pharmazie. 57: 191-3.
15. Moyano, J.R., Arias-Blanco, M.J., Gines, J.M., Rabasco, A.M., Perez-Martinez, J.I., Mor, M., Giordano, F. 1997. Nuclear magnetic resonance investigations of the inclusion complexation of gliclazide with beta-cyclo-dextrin. J Pharm Sci. 86: 72-5.
16. Higuchi, T., Connors, K.A. 1965. Phase-solubility tech-niques. Adv. Anal. Chem. Instrum. 4: 117-212.
17. Otagiri, M., Imai, T., Hirayama, F., Uekama, K., Yamasaki, M. 1983. Inclusion complex formations of the anti-inflammatory drug flurbiprofen with cyclodex-trins in aqueous solution and in solid state. Acta Pharm. Suec. 20: 11-20.
18. Redenti, E., Peveri, T., Zanol, M., Ventura, P., Gnappi, G., Montenero, A. 1996. A study on the differentiation between amorphous piroxicam: β-cyclodextrin complex and a mixture of the two amorphous components. Int. J. Pharm. 129: 289-294.
19. Winters, C.S., York, P., Timmins, P. 1997. Solid state examination of a gliclazide: beta-cyclodextrin complex. Eur. J. Pharm. Sci. 5: 209-214.