JOURNAL OF
CHROMATOGRAPHY A
ELSEVIER
Journal of Chromatography A, 743 (1996) 315-321Capillary zone electrophoresis / electrospray mass spectrometry of
priority phenols
Cheng-Yuan Tsai, Guor-Rong Her*
Department of Chemistv, National Taiwan University, Taipei, Taiwan Received 21 September 1995; revised 5 March 1996; accepted 5 March 1996Abstract
Eleven priority phenols were separated by capillary zone electrophoresis (CZE) and detected on-line with electrospray ionization mass spectrometry (ESI-MS) in the negative-ion mode. Parameters critical to the coupling of CZE and MS were studied. The best result was obtained with 2-[N-cyclohexylaminolethanesulfonic acid (CHES) as the running buffer and a solution of water-2-propanol (20:80) containing 0.5% ammonia as the sheath liquid. With the use of field amplification as the preconcentration technique and the mass spectrometer operated in the selected ion monitoring mode, the detection limit of most phenols was found to be in the range of 50 ppb. This method has been successfully applied to the determination of pentachlorophenol in a paper clay sample.
Keywords: Mass spectrometry; Buffer composition; Phenols; Priority phenols
1. Introduction
Many phenolic compounds are of great environ-
mental concern because of their toxicity. Eleven
phenols including phenol, 2-nitrophenol (2-NP), 4-
nitrophenol (4-NP), 2,4-dinitrophenol (2,4-DNP), 2-
chlorophenol (2-CP), 2,4-dichlorophenol (2,4-DCP),
2,4_dimethylphenol (2,4-DMP), 4-chloro-3-methyl-
phenol (4-C-3-MP), 2-methyl-4,6_dinitrophenol (2-
M-4,6-DNP), 2,4,6-trichlorophenol (2,4,6-TCP) and
pentachlorophenol (PCP) were listed by the United
States Environmental Protection Agency as priority
pollutants. Conventional methods based on gas chro-
matography (GC) [l] or high-performance liquid
chromatography (HPLC) [2-41 have been routinely
used for the monitoring of these pollutants. Recently,
0021-9673/96/$15.00 0 1996 Elsevier Science B.V. All rights reserved PII SOO21-9673(96)00195-l
*Corresponding author
mainly due to its superior separation efficiency,
several groups have explored the potentials of
analyzing phenols by capillary electrophoresis (CE)
[S-S].
The primary detection method of CE is UV
absorption [9-l 11, although, electrochemical and
fluorescence detection have also been reported [ 12- 151. The sensitivity of these techniques is, in general,
adequate for many applications, however, the in-
formation provided by these techniques is often not enough for a high confidence identification. Further- more, while the retention times are often used for
compound identification, the retention times of CE
are not as reproducible as in GC and HPLC and thus there is a greater risk in the identification of analytes based on retention time.
Because of its low detection limit, high specificity
316 C.-Y. Tsai, G.-R. Her I J. Chromatogr. A 743 (1996) 315-321
tion, mass spectrometry (MS) has been considered as
one of the ideal devices for chromatographic de-
tection. The merits of using MS as the chromato- graphic detector is best demonstrated with the highly
successful GC-MS. The coupling of HPLC and CE
with MS is, in general, much more difficult than the
interfacing of GC with MS, however, the recent
developments in MS such as electrospray ionization
(ESI) and atmospheric pressure chemical ionization
(APCI) makes the coupling of HPLC and CE with
MS [16-201 much easier.
CE is a modern technique known for its superior separation efficiency per unit time. The much smaller loading capacity and higher separation efficiency of CE make fraction collection more difficult compared to HPLC. In this report, we described the on-line
coupling of capillary zone electrophoresis (CZE)
with ESI-MS in the analysis of priority phenols.
2. Experimental 2.1. Chemicals
Phenol was obtain from Aldrich (Milwaukee, WI,
USA). 2,4-Dinitrophenol (2,4-DNP) was obtain from
Janssen (Belgium). 2-Nitrophenol (2-NP), 4-nitro-
phenol (4-NP), 2-chlorophenol (2-CP), 2,4-dichloro-
phenol (2,4-DCP), 2,4_dimethylphenol (2,4-DMP),
4-chloro-3-methylphenol (4-C-3-MP), 2-methyl-4,6-
dinitrophenol (2-M-4,6-DNP), 2,4,6-trichlorophenol
(2,4,6-TCP) and pentachlorophenol (PCP) were pur-
chased from Fluka (Switzerland). 2-[N-Cyclohexyl-
amino lethanesulfonic acid] (CHES) was purchased
from Sigma (St, Louis, MO, USA). Sodium tetra-
borate anhydrous and ammonium hydroxide were
purchased from Janssen (Belgium). Deionized (18
Ma) water (Milli-Q water system, Millipore, Bed-
ford, MA, USA) was used in the preparation of the
samples and buffer solution. 2-Propanol was HPLC
grade from J.T. Baker (Phillipsburg, NJ, USA). 2.2. Apparatus
The CZE system was made in-house using CZE
lOOOR (Spellman, Plainview, NY, USA) high-volt-
age power supply. CE columns were fused-silica
capillary (Polymicro Technologies, Phoenix, AZ,
USA) 50-/*m I.D., 375pm O.D. and 100 cm length
(90 cm to detector). A small area of the polyimide coating was burned off to form a window for UV detection. The detector (UV-C, Rainin, Emeryville,
CA, USA) wavelength was set at 210 nm. Before
use, the new capillary column was washed with 1 M
NaOH followed by water and running buffer. The
capillary was then equilibrated with the running
buffer under an electric field 200 V cm ’ for 20 min. To avoid absorption, the capillary column needs to be rinsed with sodium hydroxide between analysis. In normal operation, the sample was injected electro- kinetically at 10 kV for 10 s. The injection volume was calculated to be near 10 nl. In field amplification
for improving the sensitivity of this approach,
phenols prepared in water were introduced hydro-
dynamically into the column (15 cm; 7 min). High
voltage with reversed polarity (-20 kV) was then
applied to the column to push water out while
retaining the analytes on the column. When the
current reaches about 95% of the original value
(about 45 s) the polarity of the electrodes was
switched back to normal configuration (20 kV). A VG Platform single quadrupole mass spectrome-
ter (Fisons Instruments/VG Bio Tech, Altrincham,
UK) equipped with a CE interface was used for this study. The interface (Fig. 1) utilizes a triaxial flow arrangement whereby the CZE eluent is mixed with a suitable make-up solution (sheath liquid) at the probe tip and then nebulized using N, gas. In the negative- ion mode, a potential about -3.5 kV was applied to the probe tip. When the high voltage used for the
CZE separation was maintained at +20 kV, the
overall potential across the separation capillary was about 23.5 kV. A syringe pump (Model H-74900-00, Cole-Parmer, Niles, IL, USA) was used to deliver the sheath flow at a flow-rate of 10 pllmin. Nitrogen gas at a flow-rate of 0.5 l/min was used as the nebulizing gas. The warm (80°C) bath gas (nitrogen) at a flow-rate of 1.6 to 2.5 l/min aided dissolution of
the electrospray droplets. Mass spectral data were
collected at either full scan or selected-ion moni- toring (SIM) mode (0.2 s dwell time, 0.2 mass unit span).
3. Results and discussion
Both continuous flow fast atom bombardment
C.-Y. Tsai, G.-R. Her I J. Chromatogr. A 743 (1996) 315-321 317
Skimmrr Anne
System
Nebuliter Gas (N?) Fig. 1. The triaxial CZE-ES.1 interface
with CE [ 1 S-221. In comparison with FAB, ES1 has
the advantage of operating at atmospheric pressure
so that hydrodynamic flow due to the vacuum in the
separation capillary does not occur. Although CF-
FAB and ES1 can provide comparable sensitivity for different types of analytes, the coupling of CZE to
ES1 has gained considerable popularity in view of
the ease of operation and simplicity of the interface design.
CZE and micellar electrokinetic chromatography
(MEKC) are the two most popular CE techniques.
CZE is amenable to broad compound classes with
applications limited only by the necessity for solu- bility in the buffer and a non zero net electrophoretic mobility. Separation is based on the differential rate of migration of ionic species in an electric field [23-251. In contrast to CZE, MEKC is often used for
the separation of water insoluble and noncharged
compounds. Both CZE and MEKC have been suc-
cessfully used in the separation of priority phenols
[5-81. In this work, CZE instead of MEKC was
chosen as the separation technique because, most
likely due to the high concentration of surfactants, the sensitivity of CZE/ESI was much better than that of MEKC / ESI.
Sodium tetraborate at pH 9.9 has been used by
Whang et al. [8] as the running buffer in the CZE
analysis of phenols with indirect fluorescence de-
tection. Although the system produced a baseline
resolved electropherogram, borate buffer was not a
good choice for the CZE/ESI-MS operation. Both
sensitivity and ion current stability were not suitable
for the CZE/ESI-MS operation. Moreover, white
solid deposit was observed in the source due to the poor volatility of borate buffer. This solid deposit slowly blocked the orifice of the mass analyzer and thus reduced the sensitivity. A more volatile buffer, CHES, was then tested. The long term sensitivity and ion current stability are superior to borate buffer.
C.-Y. Tsai, G.-R. Her I .I. Chronuztogr. A 743 (1996) 315-321 318 (a) 6.1 13.3 20 26 min. (b) 10 20 min.
Fig. 2. Electropherograms of the eleven priority phenols. (a) sodium tetraborate buffer (pH 10.0). (b) CHES buffer (pH 10.0). Peaks were assigned as 1=2,4-DMP; 2=phenol; 3=4-C-3-MP; 4=PCP; 5=2,4,6-TCP; 6=2,4-DCP; 7=2-M-4,6-DNP; 8=2-CP; 9=2,4-DNP; lO= 4-NP; 11=2-NP.
resolution is not as good as with the borate as the running buffer (Fig. 2a), however, all eleven phenols are still baseline resolved (Fig. 2b). The elution order of the phenols was found to be the same as with the
25.000 20.000
E
‘3 15.000z
‘;:E
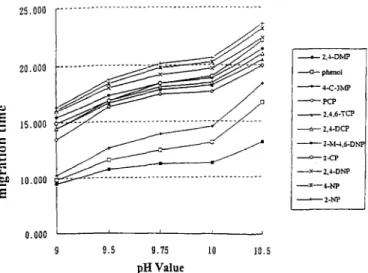
.s 10.000 E 0.000borate buffer. The resolution and retention time may be affected by pH of the running buffer. Fig. 3 shows
the pH dependence of migration time for phenols
between pH 9 to pH 10.5 with 20 mk2 CHES buffer.
With pH above 9, all eleven phenols could be
separated with CZE. The migration times increased
as pH of the buffer increased. It is interesting to see
that when pH of the solution decreased to below
9.75, the elution order of 2-CP and 2-M-4,6-DNP
was reversed in comparison with higher pH.
Make-up solution (sheath liquid) performs two
functions, one is to supplement the CZE flow to a level suitable for ES1 operation and the other is to make electrical contact between the CZE eluent and probe tip. Sheath liquid was reported critical to the
performance of the CZE/ESI interface [19]. Sheath
liquids of different composition have been tested for
sensitivity and stability under negative ES1 con-
ditions. In the experiment, a 10 ppm 4-NP solution
was electroosmotically infused through the silica
capillary, and then mixed with sheath liquid (10
,ul/min) at the tip of the CE probe. The results
showed that the addition of ammonia improved the
sensitivity of phenols and 2-propanol produced a
more stable signal than methanol and ethanol (Fig. 4). The best result was obtained with a solution of
20:80 water-2-propanol containing 0.5% ammonia.
One major function of the sheath liquid is to
supplement the CZE flow to a level suitable for
electrospray operation. With the use of a sheath
9 9.5 9.75 10 10.5 pH Value
C.-Y. Tsai, G.-R. Her / J. Chromatogr. A 743 (1996) 315-321 319 l.Oe+j 8 6.0ei5 $ j.Oe+j 5 d < 4.0ec5 2 3.0e+s Z.Oe+j 1 Oe75 0 Oe+O
I)75125 2.propP"ol i wa,cr 2)80/20 2.propanal/water 3) 84116 2-propanol/water 4) SO/20 methrnol/warer+02% ammonia 5) 80/20 ahanolwater +a 2 % amnlO",l 6) 80/20 2-prapanol/water+ 0.2 % ammo",a
c 7) 8Ol20 2-propanoliwaw+O 4 % ammonll 8)80/20 2.propanol/water+O 5 % ammonia 9)SOlZO 2-propanollwawr*O6 % amm,,,,~
I 2 3 4 5 6 7 S 9
Sheath Liquid Composition
Fig. 4. Ion abundance as a function of ES1 sheath liquid composition, The 4-nitrophenol (10 ppm) was electroosmotically infused (20 kV) through the silica capillary.
liquid of 20:80 water-2-propanol containing 0.5%
ammonia, a flow of 8 to 12 ,ullmin was found to be best suited for ES1 operation.
Sheath liquid was chosen because of the optimi- zation in sensitivity and stability, therefore, sheath liquid would be an ideal choice as the running buffer in CZE. Unfortunately, good separation could not be
obtained with the sheath liquid (20180 water/2-
propanol containing 0.5% ammonia) as the running
buffer.
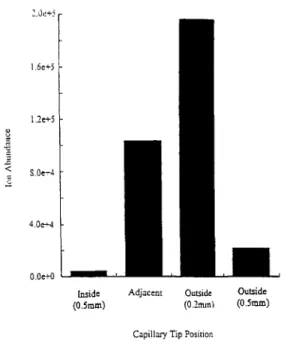
Sheath liquid was passed between the separation and the stainless capillary column (Fig. 1) and then mixed with the running buffer at the tip of the probe.
The relative position between these two columns
affected the sensitivity of the CZE/ESI interface.
The best sensitivity was obtained with the separation
column protruding slightly (about 0.2 mm) beyond
the tip of the stainless capillary column (Fig. 5). If the silica tubing protruded too far to make a good electrical contact, the sensitivity dropped very quick- ly.
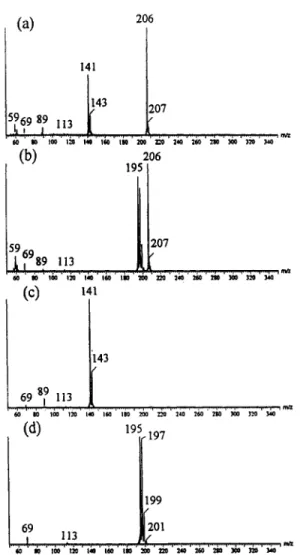
Phenols showed very little fragmentation under
negative ES1 conditions. The negative ES1 mass
spectra of phenols are characterized with molecular
ion and background ions from buffer and solvent
(Fig. 6a and b). For the following reasons, the mass
spectrometer was operated at the SIM mode in the
CZE/MS analysis of low level phenols. First, the
sensitivity of SIM was shown to be about 10 times better than full scan. Secondly, background subtract-
L
LAdjncenr Outside Outside (O.?mmi (O.Smm) Capillary Tip Posirmn
Inside (OSmm)
Fig. 5. Ion abundance as a function of capillary tip position. The 4-nitrophenol (10 ppm) was electroosmotically infused (20 kV) through the silica capillary. The flow-rate of sheath liquid [water- 2-propanol (20:80) containing 0.5% ammonia] was 10 pllmin.
ing routines, which were used to remove background
ions from the spectra of high concentration of
phenols (Fig. 6c and d), were not quite successful for
low levels (ppm-ppb) of phenols. The small vari-
ation in background ion current, not a serious
problem for high concentration samples, appeared to affect low level phenols greatly. Finally, as men- tioned earlier, there is little fragmentation in the
spectra, the lack of fragment ions makes little
difference between full scan and SIM.
The on-line CZE/MS analysis of a 10 ppm
mixture of phenols is given in Fig. 7. All phenols
gave single ion electropherograms with good peak
shape and signal-to-noise ratio. Although the same
amount of samples were injected, phenol, 2-CP, 2-
NP, and 4-C-3-MP appeared to have poorer SIN ratio (Fig. 7). Direct injection of phenols into the ES1 showed that the responses of phenol, 2-CP, 2-NP, and
4-C-3-MP were poorer than others.
The separation efficiency, represented by the
number of theoretical plates, N, was calculated from
the peak half-width for each phenol. For CZE-UV,
the range was from 50 900 for phenol to 182 000 for
320 C.-Y. Tsai, G.-R. Her 1 J. Chromatogr. A 743 (1996) 315-321
(4
206Fig 6. Electrospray mass spectrum of (a) 4-C-3-MP and (b) 2,4,6-TCP obtained in the full scan mode under CZE-MS operation. The ions at m/z 141 and 195 are the [M-H]- ion of 4-C-3-MP and 2,4,6-TCP. The m/z 206 ion is the [M-H]- ion of CHES buffer. (c) and (d) were obtained after background subtrac- tion.
as good as in CZE-UV. The number of theoretical
plates drooped to 22 200 for phenol to 100 339 for
2-M-4,6-DNF’. The loss of separation efficiency is
most likely due to the dead volume of the CZE-MS
interface. The repeatability in migration time and
signal area were found to be 4% and 17% respective- ly.
The method was used to the determination of
priority phenols in a paper clay sample. The sample
was extracted with acidified methanol and then
analyzed directly by CZE-MS. Only one peak was
4-m 2-NP miz I38 m/z 138 1784 LL 18.30 2,4-DhQ m/z 183 17.15
n
2-cP m/z 127 16.23 h 2-MA,6-DNP m/z 197 “.“..J5 2,4-DCP m/z 161 15.72 I1
2.4.6~TCP , m/z 1954
15.41I
1
PCP m/z 265 13.oB 1 1 4-c-3-M? ml2 141 phenol 2,4-DMP ml2 121 II.45 h 5.00 w.oa 1J.W 20.w l5.cQ”Fig. 7. Selected ion electropherograms of the eleven priority phenols (IO ppm concentration). The peak at 15.41 min of the m/z
197 mass electropherogram is the [M+2] isotope peak of 2,4,6- TCP.
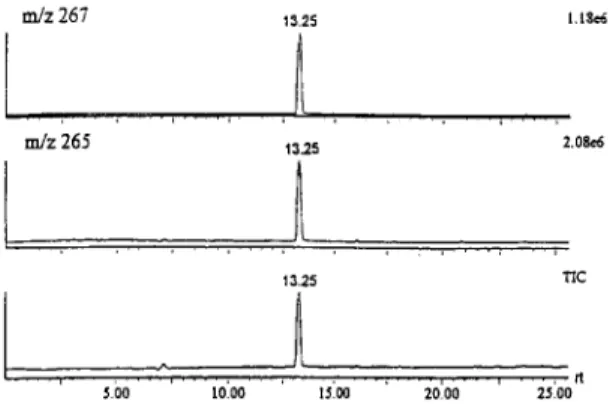
observed in the total ion current electropherogram (Fig. 8). This peak was assigned to pentachloro- phenol based on the molecular weight and isotopic ratio of the peak. After the identification, the com-
pound was quantified by CZE-MS and CZE-UV,
Our results showed that while the dynamic range of these two approaches were similar_(two orders), the
calibration curve from CZE-UV had a better linear
correlation than CZE-MS (r=0.999 vs. 0.984). The
concentration of pentachlorophenol in the paper clay
sample was determined to be 0.3 mg/g and 0.34
mg/g by CZE-UV and CZE-MS respectively.
The detection limit of this CZE-MS technique is
in the low ppm range. This sensitivity is not
C.-Y. Tsai, G.-R. Her I J. Chromatogr. A 743 (1996) 315-321 321
I
I bo 10’00 IJ’W 7.0 00
2J’OOfl
Fig. 8. Total and selected mass electropherograms of the paper clay sample.
samples without preconcentration. In order to im-
prove the sensitivity of this approach, the technique of field amplification was adopted. Phenols in water
were injected hydrodynamically (15 cm, 7 min) and
then stacked under reversed polarity (-20 kV) for 45
s. Except for 2,4-DMP, phenol and 4-C-3-MP, the
detection limit of this modified approach was found to be in the range of 50 ppb.
4. Conclusion
The combination of CZE and MS provided an
excellent analytical tool for the separation and
identification of priority phenols. This study showed that the position of the probe tip, the composition of running buffer and sheath liquid were all critical to
the performance of the CZE-ES1 interface. Although
it is possible to obtain useful mass electropherogram with 50 ppb level of most phenols, further improve- ment in sensitivity is needed for the detection of low ppb level of phenols.
This work was supported by National Research
Council of the Republic of China.
References
[7] C.P. Ong, C.L. Ng, N.C. Chong, H.K. Lee and S.F.Y. Li, J. Chromatogr., 516 (1990) 263.
Y.C. Chao and C.W. Whang, J. Chromatogr. A, 663 (1994) 229. 181 191 1101 1111 [I21 [I31 [I41 [ISI [I61 [I71 1181 [I91 PO1 Pll 1221 ~31 ~241 WI
F.E.P. Mikkers, F.M. Everaerts and Th.P.E.M. Verheggen, J. Chromatogr., 169 (1979) 11.
S. Terabe, K. Otsuka K. Ichikawa, A. Tsuchiya and T. Ando, Anal. Chem., 56 (1984) 111.
K. Ganzler, K.S. Greve, A.S. Cohen, B.L. Karger, A. Gunman and N.C. Cooke, Anal. Chem., 64 (1992) 2665. Y.E. Yik and S.F.Y. Li, Trends Anal. Chem., 11 (1992) 325. R.A. Wallingford and A.G. Ewing, Anal. Chem., 59 (1987)
1762.
S. Nie, R. Dadoo and R.N. Zare, Anal. Chem., 65 (1993) 3571.
E.S. Yeung, D. Wang, W. Li and R.W. Giese, J. Chromatogr., 608 (1992) 73.
G. Hopfgartner, T. Wachs, K. Bean and J. Henion, Anal. Chem., 65 (1993) 439.
S. Jun, U. Yoshihisa, K. Akihiro and K. Ikunoshin, Anal. Biochem., 207 (1992) 1.
R.D. Smith, J.A. Olivares, N.T. Nguyen and H.R. Udseth, Anal. Chem., 60 (1988) 426.
M.A. Moseley, J.W. Jorgenson, J. Shabanowitz, D.F. Hunt and K.B. Tomer, J. Am. Sot. Mass Spectrom., 3 (1992) 289. S. Pleasance, P. Thibault and J. Kelly, J. Chromatogr., 591 (1992) 325.
M.A. Moseley, L.J. Deterding, K.B. Tomer and J.W. Jorgen- son, Anal. Chem., 63 (1991) 109.
M.A. Moseley, L.J. Deterding, K.B. Tomer and J.W. Jorgen- son, J. Chromatogr., 516 (1990) 167.
H.H. Lauer and D. McManigill, Anal. Chem., 58 (1986) 166. J.W. Jorgenson and K.D. Lukacs, Anal. Chem., 53 (1981) 1298.
J.S. Green and J.W. Jorgenson, J. Chromatogr., 352 (1986) 337.
[l] R.A. Booth and J.N. Lester, J. Chromatogr. Sci., 32 (1994) 259.
[2] N.G. Buckman, J.O. Hill, R.J. Magee and M.J. McCormick, J. Chromatogr., 284 (1984) 441.
[3] F.P. Bigley and R.L. Grob, J. Chromatogr., 350 (1985) 407. [4] H.K. Lee, S.F.Y. Li and Y.H. Tay, J. Chromatogr., 438
(1988) 429.
[5] K. Otska, S. Terabe and T. Ando, J. Chromatogr., 348 (1985) 39.
[6] C.D. Gaitonde and PV. Pathak, J. Chromatogr., 514 (1990) 389.