國 立 交 通 大 學
環 境 工 程 研 究 所
博士論文
生物薄膜系統中污泥特性對薄膜積垢之影響及
二氧化鈦複合薄膜減緩積垢之研究
Effect of sludge characteristics on membrane fouling in MBRs and
fouling mitigation by TiO
2-composite membrane
研 究 生:蘇育俊
指導教授 :黃志彬、袁如馨 博士
生物薄膜系統中污泥特性對薄膜積垢之影響
生物薄膜系統中污泥特性對薄膜積垢之影響
生物薄膜系統中污泥特性對薄膜積垢之影響
生物薄膜系統中污泥特性對薄膜積垢之影響及
及
及
及
二氧化
二氧化
二氧化
二氧化鈦複合薄膜減緩積垢
鈦複合薄膜減緩積垢
鈦複合薄膜減緩積垢
鈦複合薄膜減緩積垢之研究
之研究
之研究
之研究
研究生:蘇育俊 指導教授 : 黃志彬、袁如馨 博士
國立交通大學環境工程研究所摘要
摘要
摘要
摘要
生物薄膜程序為近年廢水生物處理程序中一嶄新之研究,由於利用薄膜單元 取代傳統的沉澱池,使其具有較小的佔地面積、較少的汙泥產量及優良的出流水 質等優勢。然而,生物薄膜中薄膜的阻塞卻限制其廣泛的應用,因為薄膜的阻塞 會導致出水通量衰減、增加薄膜的清洗和更換次數,使操作成本增加。儘管已有 許多研究針對薄膜積垢的機制及預防進行廣泛地探討,但其研究結果卻往往顯示 出不同的結果。因為污泥及進流水的複雜特性及來源不同,或是不相同的薄膜模 組及操作情況往往會導致此不一致的結論。薄膜積垢肇因於污泥和薄膜間的交互 作用而導致汙泥中不同的成份吸附或沉積於薄膜表面。因此,汙泥的特性、薄膜 的特性及其水力情況往往為導致薄膜積垢的關鍵因素。 因此,本研究主要針對不同的污泥特性對薄膜積垢進行探討。研究利用一好 氧性選種槽將污泥中的主要菌相由絲狀菌轉變為膠羽形成菌,藉此探討其不同污 泥特性下的薄膜過濾特性。結果顯示,儘管污泥膨化嚴重,生物薄膜系統仍可維 持優良的出流水水質。實驗過程中,總有機碳和氨氮的去除率皆分別維持 98% 和 99%的高去除率。然而,即使絲狀菌比膠羽形成菌有較大的粒徑分布,當絲狀 菌大量增生而導致污泥膨化時,薄膜積垢情況嚴重。研究發現,當絲狀菌大量增 生時,污泥中的溶解性微生物產物大量增加,尤其是當中的多醣類含量。由傅立 葉紅外線光譜結果顯示,溶解性微生物產物中的多醣類和蛋白質為導致此嚴重積 垢發生的主因。污泥膠羽上的胞外聚合物並非造成此嚴重積垢的原因。 污泥停留時間的不同導致不同的污泥特性,進而對薄膜積垢造成重要的影 響。本研究將污泥停留時間設定為 10、30 及 60 天,發現污泥停留時間越短薄膜 積垢越嚴重。污泥停留時間為 10 天的生物薄膜系統,其薄膜積垢遠比操作於 30 及 60 天的嚴重許多,主要因為污泥於污泥停留時間為 10 天的生物薄膜分泌較多 的溶解性微生物產物。然而,污泥停留時間 30 及 60 天的生物薄膜系統,其不同膜系統中,溶解性微生物產物多為親水性物質,且大部分被薄膜截留於反應槽 中。此親水性物質多為多醣類,並為主要的積垢物。 為了減緩薄膜積垢的發生,本研究利用二氧化鈦合成複合薄膜,用以降低薄 膜積垢的速率。研究以低溫中性共沉澱凝膠法方式合成奈米級二氧化鈦,並利用 含浸法合成二氧化鈦複合薄膜。此外,並利用文獻中所採用的酸性二氧化鈦溶液 來合成二氧化鈦複合薄膜,探討並比較以此方法所合成之複合薄膜的抗積垢能 力。結果顯示,不管以何種二氧化鈦合成之複合薄膜皆可降低薄膜積垢速率,主 要原因為增加薄膜表面的親水性。適當的二氧化鈦含量對複合薄膜的抗積垢能力 有很大的影響,雖然較多的二氧化鈦可以增加薄膜的親水性,但過多的二氧化鈦 卻會導致薄膜孔洞的堵塞,增加過濾的阻抗。由超音波清洗薄膜的結果顯示,此 複合薄膜的二氧化鈦可牢固的附著於薄膜表面,不會因清洗而大量流失二氧化 鈦。 關鍵字:胞外聚合物、積垢、生物薄膜、溶解性微生物產物、二氧化鈦。
Effect of sludge characteristics on membrane fouling in MBRs and
fouling mitigation by TiO
2-composite membrane
Student: Yu-Chun Su Advisor: Chihpin Huang
Jill Ruhsing Pan
Institute of Environmental Engineering
National Chiao Tung University
Abstract
Membrane bioreactor (MBR) processes, in which membrane filtration is combined with biological degradation for biomass separation, have attracted great attention recently because of their advantages over conventional activated sludge processes, including a smaller footprint, less sludge production and superior effluent quality. However, their wide applications have been hindered by their excessive operation cost due to membrane fouling. Membrane fouling reduces water production and membrane lifespan, thereby, increasing operation and maintenance costs. Many studies have been devoted to exam the mechanisms of fouling and fouling mitigation in MBRs. Despite such intensive efforts, no conclusion on the cause of MBR fouling has been agreed upon, which may be due to the complication of mixed liquor and influent, module design and operation conditions implemented in various studies. Membrane fouling is the interaction between sludge and membrane, which results in adsorption or deposition of components in sludge on membrane surface. As a result, characteristics of sludge and membrane and hydrodynamic conditions are vital factors affecting membrane fouling in MBRs.
In this study, the impact of sludge characteristics on membrane fouling in a submerged MBR was investigated. Bulking sludge due to excessive growth of filamentous bacteria was changed to normal sludge by use of an aerobic selector. Excellent effluent quality was achieved in the MBR regardless of the quality of the sludge of the bioreactor. However, serious fouling was observed when bulking sludge occurred and filamentous bacteria were found dominant in the reactor despite the
was not the cause for membrane fouling in this case.
Sludge retention time (SRT) has been found to alter sludge characteristics and therefore, have significant impact on membrane fouling. Shorter SRT (10 days) resulted in higher fouling propensity most likely due to higher SMP in the mixed liquor. Despite the similar amount of SMP in mixed liquor, fouling rate at SRT 30 days was higher than SRT 60 days. This may be due to the higher content of bound EPS in sludge flocs at SRT 30 days, resulting in higher specific cake resistance. SMP was found to have larger molecular weight at shorter SRT. Dynamic membranes which can reject small components such as solutes in mixed liquor were formed on the membrane in the beginning of the filtration. The dynamic membrane would not cause apparent membrane fouling but improved membrane rejection instead. Hydrophilic fraction which was accumulated in the mixed liquor was the dominant species in SMP. Hydrophilic carbohydrates were most likely the major foulants at SRT 10 days .
To reduce membrane fouling, titanium dioxide (TiO2) composite membranes were prepared. A chemical copreciptization-peptization method was used to produce TiO2 nanoparticles in neutral sol. The composite membranes were prepared by dip-coating the membrane in the neutral TiO2 sol and also in acidic TiO2 suspension. Filtration tests showed that membrane fouling was reduced in both cases possibly due to the increase in hydrophilicity of the membrane. Results showed that optimal amount of coating is important in fouling mitigation. Too much TiO2 on membrane surface deteriorated membrane filtration due to the blocking of membrane pores. The ultrasonic washing test showed that most TiO2 particles were firmly coated on the surface of the TiO2 composite membrane.
Keywords: Extracellular polymeric substances (EPS), Fouling, Membrane Bioreactor (MBR), Soluble microbial products (SMP), Titanium dioxide (TiO2)
CONTENTS
中文摘要
中文摘要
中文摘要
中文摘要...Ⅰ
Ⅰ
Ⅰ
Ⅰ
Abstract...Ⅲ
Ⅲ
Ⅲ
Ⅲ
Contents ...Ⅴ
Ⅴ
Ⅴ
Ⅴ
List of tables...Ⅷ
Ⅷ
Ⅷ
Ⅷ
List of figures...Ⅸ
Ⅸ
Ⅸ
Ⅸ
1.
Introduction...1
1.1 Background ...1 1.2 Outlines ...12.
Literature review ...4
2.1 Membrane fouling in MBRs ...4 2.1.1 Membrane characteristics ...8 2.1.1.1 Roughness ...82.1.1.2 Hydrophobicity and hydrophilicity...8
2.1.1.3 Pore structure and size ...9
2.1.1.4 Surface charge...9
2.1.2 Sludge characteristics...10
2.1.2.1 Particle size ...10
2.1.2.2 Extracellular polymeric substances ...12
2.1.2.3 Mixed liquor suspended solids ...16
2.1.2.4 Hydrophobicity and surface charge ...20
2.1.2.5 Floc morphology...20
2.1.3 Environmental and operational conditions ...21
2.1.3.1 Sludge retention time ...21
2.1.3.2 Imposed flux ...25
2.2 Mitigation of membrane fouling in MBRs...26
2.2.1 Modification of membrane characteristics...26
3.
Experimental methods...32
3.2.1 Extraction of EPS...39
3.2.2 Analysis of EPS ...42
3.2.3 Measurement of particle size distribution of sludge ...45
3.2.4 Measurement of molecular weight distribution of supernatant solutes ...45
3.2.5 Fractionation of supernatant solutes ...45
3.2.6 Determination of filtration resistance ...45
3.2.7 Specific cake resistance ...46
3.2.8 Fourier-transform infrared spectrometer...47
3.2.9 Characterization of nanosized TiO2 particles ...47
3.2.10 Characterization of morphology and chemical composition of membrane surface...47
3.2.11 Fouling test of composite membranes ...48
3.2.12 Ultrasonic wash of the TiO2 composite membrane ...48
3.2.13 Other analytical methods ...48
4.
Effect of sludge characteristics on membrane fouling in MBRs...50
4.1 Performance and fouling characteristics of membrane bioreactor under different sludge characteristics...50
4.1.1 Performance of membrane bioreactor treatment under different sludge conditions...50
4.1.2 Impact of bulking sludge on membrane fouling ...54
4.1.3 Effect of sludge properties on EPS ...59
4.1.4 Effect of sludge fractions on membrane fouling...62
4.2 Effect of SRT on sludge characteristics and membrane fouling ...66
4.2.1 Fouling rate at different SRTs ...66
4.2.2 Sludge characteristics at different SRTs...69
4.2.3 SMP characteristics ...74
5.
Fouling mitigation in MBRs by TiO
2-composite membrane ...80
5.1 Characterization of TiO2 and TiO2 composite membranes ...80
5.1.1 Particle size and crystal structure of synthesized TiO2...80
5.1.2 Surface characterization of the TiO2 composite membrane...84
5.2 Effect of TiO2 composite membranes on membrane fouling ...87
5.2.1 Fouling mitigation of the composite membranes...87
6.
Conclusions and recommendations...96
6.1 Conclusions ...96
6.2 Recommendations ...97
List of tables
Table 2.1. Membrane fouling in MBRs. ...5
Table 2.2. Relative Contribution of sludge components on membrane fouling (%). ...11
Table 2.3. EPS and SMP on membrane fouling... 13
Table 2.4. Relationship between MLSS and membrane fouling in MBRs... 17
Table 2.5. Effect of SRT on membrane fouling... 22
Table 2.6. Fouling mitigation by coating TiO2 on membranes. ... 28
Table 3.1. Composition of the synthesized wastewater. ... 35
Table 4.1. Comparison of sludge characteristics between normal sludge and bulking sludge. ... 58
Table 4.2. Contribution of sludge fraction to resistance at different stirring rates. ... 65
Table 4.3. Sludge characteristics at different SRTs... 72
Table 5.1. Contact angle of the virgin membrane and the TiO2 CA-composite membranes. ...86
Table 5.2. Relative atomic concentration of elements on the TiO2 composite membrane surface under ultrasonic washing... 95
List of figures
Figure 1.1. The schematic diagram of this study. ...3
Figure 2.1. Factors affecting membrane fouling in MBRs. ...7
Figure 3.1. Schematic of the membrane bioreactor system. ...34
Figure 3.2. Critical flux determination by the flux-step method. ...36
Figure 3.3. Schematic of the membrane bioreactor system with an aerobic selector. .37 Figure 3.4. Dead-end stirred cell set-up...38
Figure 3.5. Extraction of EPS from sludge flocs. ...41
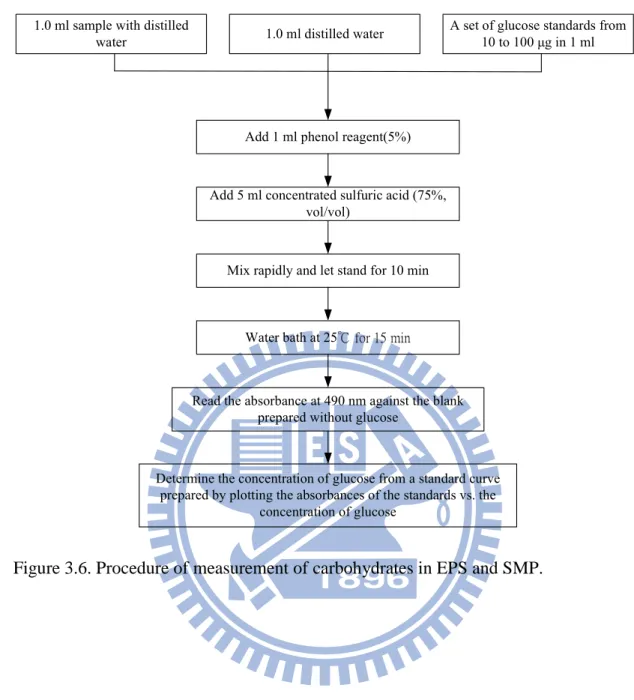
Figure 3.6. Procedure of measurement of carbohydrates in EPS and SMP...43
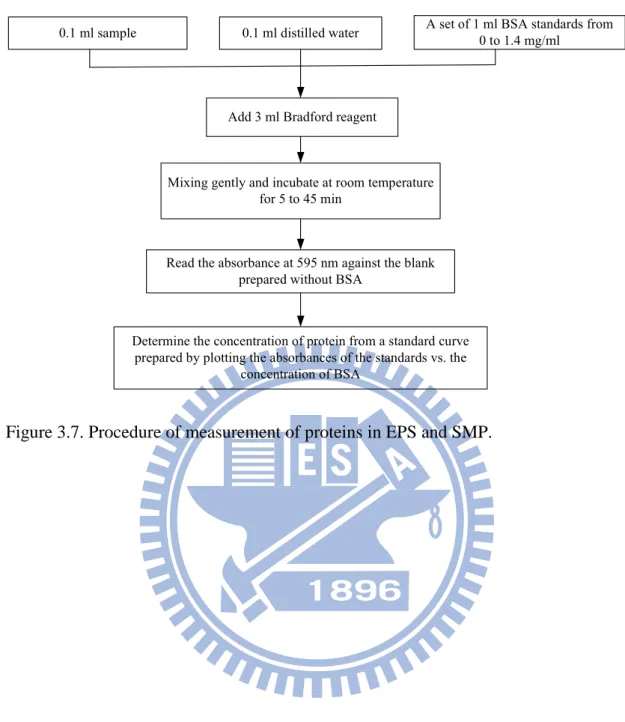
Figure 3.7. Procedure of measurement of proteins in EPS and SMP. ...44
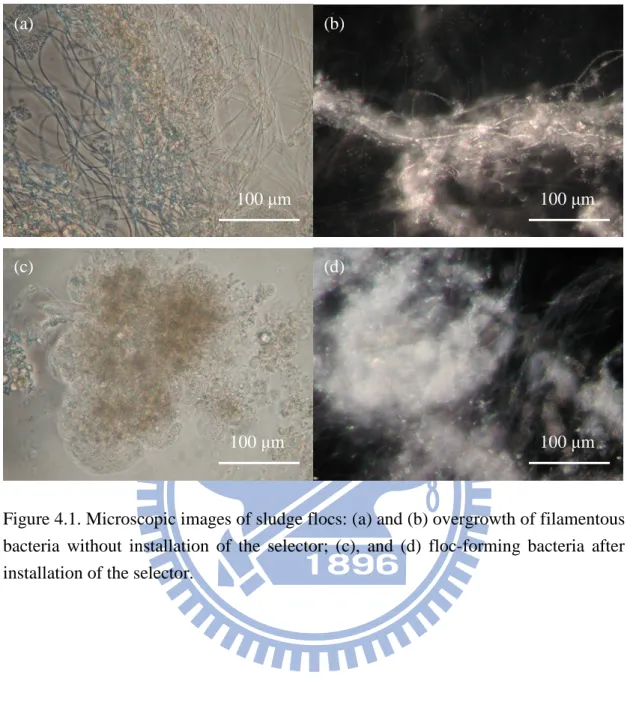
Figure 4.1. Microscopic images of sludge flocs. ...52
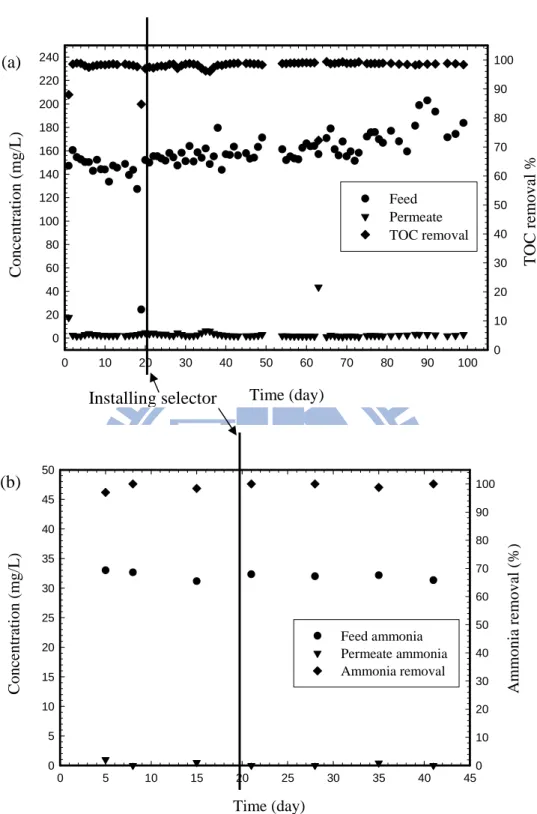
Figure 4.2. (a) TOC and (b) ammonia nitrogen removals by MBR treatment in bulking sludge and normal sludge. ...53
Figure 4.3. TMP profiles of different sludge properties ...56
Figure 4.4. Particle size distributions of normal sludge and bulking sludge. ...57
Figure 4.5. Comparison of EPS components in filamentous bacteria and floc-forming bacteria...60
Figure 4.6. FTIR spectra of fresh and fouled membranes. ...61
Figure 4.7. Resistances of sludge fractions at different stirring rates ...64
Figure 4.8. TMP profiles at different SRTs. ...67
Figure 4.9. Pictures of the membranes fouled at different SRTs ...68
Figure 4.10. Concentration of SMP (represented as TOC) in mixed liquor and effluent at different SRTs. ...71
Figure 4.11. Particle size distribution of sludge at different SRTs...73
Figure 4.12. Molecular weight distribution of the SMP in mixed liquor and effluents76 Figure 4.13. Changes of TOC with elapsed time. ...77
Figure 4.14. Hydrophilicity of SMP in the mixed liquor and effluent at SRT 10. ...78
Figure 4.15. Hydrophobicity of polysaccharides in the mixed liquor and effluent at SRT 10. ...79
Figure 5.1. TEM micrographs of the TiO2 particles ...81
Figure 5.2. 5.2. Particle size distribution of TiO2 synthesized in neutral sol...82
Figure 5.3. XRD patterns of the synthesized TiO2...83 Figure 5.4. XPS reports of (a) full survey of TiO2 composite-CA membrane; (b) TiO2 2p
Figure 5.7. Antifouling ability of TiO2 composite-CA membranes (0.45µm) with different dip-coating times in neutral TiO2 sol. ...91 Figure 5.8. SEM micrographs of (a) virgin CA membrane, (b) composite-CA
membrane coated with one-time coating of neutral TiO2 sol, and (c)
composite-CA membrane with three-time coating of neutral TiO2 sol. ....92 Figure 5.9. Clean water flux and permeability of the virgin membrane and the TiO2
Chapter 1
Introduction
1.1Background
Nowadays, membrane technology has been extensively applied to wastewater treatment due to its excellent effluent quality to meet the requirement by increasingly stricter regulations and its rapid development. Membrane bioreactor (MBR) has attracted a lot of attention because of the many advantages over the conventional activated sludge process, including excellent treated water quality, small footprint, less sludge production, and flexibility of operation. However, MBRs operation is commonly challenged by membrane fouling resulting in tremendous increase in costs, which has hindered its widespread application. Feed water, biomass, membrane and membrane module, and operating conditions are important factors affecting membrane fouling in MBR. Fouling in submerged MBRs can be significantly reduced by proper aeration and by operating at constant flux under a critical value, namely, critical flux.
Despite operation under subcritical flux, membrane fouling is inevitable. Many studies have been devoted to exam the mechanism of fouling and to search for the means for fouling mitigation in MBRs; however, there has not been a conclusion on the cause of MBR fouling, which may be due to the complication of mixed liquor and influent, different modules and different operation conditions implemented in the study. As a result, a comprehensive investigation of membrane fouling in MBRs is needed to facilitate proper fouling control in MBRs. Because fouling is the result of the interaction between sludge and membrane, sludge characteristics play important roles on membrane fouling.
The objective of this study is to investigate the effect of sludge characteristics on membrane fouling under long-term subcritical flux operation. Moreover, fouling mitigation by coating TiO2 on membrane surface was also explored to evaluate the feasibility of TiO2 composite membranes in MBRs.
1.2Outlines
In this study, the impact of sludge characteristics on membrane fouling in a submerged MBR was investigated. The cause for membrane fouling and the fouling
operated at SRT 10, 30 and 60 days to evaluate the effect of SRT on sludge characteristics and membrane fouling. Sludge properties at three SRTs, including MLSS, specific cake resistance, EPS, SMP and particle size distribution, were investigated to evaluate their impact on membrane fouling.
For fouling mitigation, a TiO2 composite membrane was prepared. A neutral sol containing 1% of TiO2 nanoparticles was prepared by chemical copreciptization-peptization. Membranes were dip-coated with the neutral sol to form the TiO2 composite membranes which were characterized by X-ray photoelectron spectroscopy (XPS). The fouling mitigations of the TiO2 composite membranes made from acidic TiO2 suspension and neutral TiO2 sol were compared. The fouling mitigation was explored on two kinds of membranes, cellulose acetate (CA) and mixed cellulose ester (MCE). Finally, ultrasonic washing was performed to evaluate the stability of TiO2 composite membranes. The schematic diagram of this study is illustrated in Figure 1.1.
Chapter 2 reviews literatures related to this study. It includes membrane fouling and mitigation of fouling in MBRs. For membrane fouling in MBRs, the effects of membrane characteristics, sludge characteristics, and environmental and operational conditions on membrane fouling are examined. For mitigation of membrane fouling in MBRs, modification of membrane characteristics is reviewed.
Chapter 3 describes the material and analytical methods used in this study.
Chapter 4 and 5 show the experimental results and discussion. In chapter 4, performance and fouling characteristics of MBR under different sludge characteristics (filamentous and floc-forming sludge) are presented along with the effect of SRT on sludge characteristics and membrane fouling.
Chapter 5 states the results concerning antifouling ability of TiO2 composite membranes for MBRs. The preparation and characterization of TiO2 composite membranes as well as the stability of TiO2 nanoparticles on composite membranes are included.
Chapter 2
Literature review
Membrane bioreactors (MBRs) have attracted a lot of attention in the last decade because of their advantages over conventional activated sludge processes. However, membrane fouling resulting in increase of operation and maintenance costs has become one of the most significant factors hindering the widespread application of MBRs. In this study, references considering membrane fouling in MBRs and the strategies to mitigate membrane fouling in MBRs are reviewed.
2.1 Membrane fouling in MBRs
Membrane fouling in MBRs is due to the deposition of materials into/onto the membrane, which is attributed to the interactions of membranes and activated sludge. Membrane fouling depends on nature of feed, sludge characteristics, operation conditions, etc. Although many investigations concerning fouling in MBRs have been performed, inconsistent results are usually observed in studies (as shown in Table 2.1) due to the complication of mixed liquor and influent, different modules and different operation conditions implemented in studies. Table 2.1 shows that most studies identified extracellular polymeric substances (EPS), especially the carbohydrates fraction, as the main foulant in MBRs (Cho & Fane, 2002; Kimura et al., 2005; Rosenberger et al., 2006). However, as shown in Table 2.1, some studies pointed out that other materials like biopolymer cluster, smaller particles or fatty acids were the major foulants on membranes (Bai & Leow, 2002; Wang & Li, 2008; Al-Halbouni et al., 2009).
According to Chang et al (2002), membrane, biomass, and operating conditions are three key factors influencing membrane fouling in MBRs. Recently, Liao et al (2004) also proposed four main parameters which have significant impact on membrane fouling in MBRs (as shown in Figure 2.1). Although some of these parameters in Figure 2.1 directly influence membrane fouling, others interact with other parameters and subsequently influence membrane fouling indirectly. Due to the complex interaction of parameters affecting membrane fouling, a comprehensive understanding and investigation of membrane fouling in MBRs should be provided to properly control fouling in MBRs. Some important factors affecting membrane fouling in MBRs are reviewed as follows.
Table 2.1. Membrane fouling in MBRs.
Influent Pore size (µm)
Membrane
configuration Major foulants
Test
duration Other References
UASB effluent 0.22 Flat sheet,
Hydrophilised PVDF
EPS (presented as
carbohydrates) 450 days -
Cho & Fane (2002) Synthetic wastewater 0.1 Hollow fiber, PVDF (Pall) Smaller particles in MLSS 250 mins -
Bai & Leow (2002) Municipal wastewater 0.2 Hollow fiber, polyethylene (Mitsubishi Rayon)
Carbohydrates 120 days - Kimura et al.
(2005) Municipal
wastewater 0.1-0.2 Hollow fiber
Polysaccharides fraction 1 year Pre-denitrification and post-denitrification in MBR Rosenberger et al. (2006) Municipal wastewater 0.04 Hollow fiber, PVDF (Zenon) Soluble humic substances and carbohydrates in complex with metal
2 years Pre-denitrification in MBR Lyko et al. (2007)
Table 2.1. Membrane fouling in MBRs (continued)
Influent Pore size
(µm) Membrane configuration Major foulants Test duration Other References
Municipal
wastewater 0.2
Hollow fiber,
PVDF (Zizheng, China)
Not only EPS but also other organic substances 160 days Pre-denitrification in MBR Wang et al. (2008) Synthetic wastewater 0.4 Hollow fiber,
(Mitsubishi Rayon) Biopolymer clusters 28 days
18-min-operation and 2-min-off Wang & Li (2008) Municipal wastewater 0.04 Hollow fiber,
PVDF (Zenon) Fatty acids 3 years -
Al-Halbouni et al. (2009)
Figure 2.1. Factors affecting membrane fouling in MBRs. (adapted from Liao et al., 2004)
Membrane
Fouling
Sludge characteristics (particle size, extracellular polymeric substance, MLSS, hydrophobicity and surface charge, flocmorphology)
Membrane characteristics
(hydrophobicity, surface charge, roughness, pore size)
Fluid Mechanics
(Shear stress on membrane surface)
Membrane module design
(fiber packing density, space distance,
aerators)
Environmental/Operating Conditions (pH, ionic strength, growth rate, nutrient,
hydraulic residence, Food/Microorganism, solids retention time, membrane flux, operating cycle length)
2.1.1 Membrane characteristics
Membrane characteristics, such as roughness, pore size, porosity, surface charge, and hydrophobicity have impact on membrane fouling.
2.1.1.1 Roughness
Membrane roughness has been reported to have direct impact on membrane fouling. In general, studies revealed that the rougher membrane surface is, the more serious fouling is. Elimelech and his co-workers published a series of experimental results on effects of membrane morphology on membrane fouling (Elimelech et al., 1997). They first compared the fouling rate of cellulose acetate and aromatic polyamide thin-film composite reverse osmosis membranes (RO), and concluded that surface roughness increased membrane fouling by increasing the rate of colloid attachment onto the membrane surface. In the consequent study, similar results were discovered in RO and nanofiltration (NF) membranes that rough membranes had higher fouling propensity because particles preferentially accumulated in the “valleys” of rough membranes, resulting in “valley clogging” which caused more severe flux decline (Vrijenhoek et al., 2001)
. He et al (2005) used a series of polyethersulfone (PES) UF membranes of various molecular weight cutoff (MWCO) and roughness to evaluate the effect of MWCO and membrane roughness on flux decline in an anaerobic MBR. They found that smoother membranes had less permeate flux decline because foulants found fewer crevices to fill in and to buildup the fouling layer. Recently, Choi & Ng (2008) also concluded that in a submerged MBR phase-inversed polytetrafluorethylene (PTFE) membranes had higher total filtration resistance than track-etched polycarbonate (PCTE) and track-etched polyester (PETE) membranes due to its higher degree of roughness.
2.1.1.2 Hydrophobicity and hydrophilicity
For membrane, hydrophilicity affects its wettability and the pressure to drive the liquid through the membrane. It also influences the adhesion characteristics of contaminants to the membrane materials. In most cases, membranes with hydrophobic characteristics have been found more prone to membrane fouling because of the hydrophobic-hydrophobic interaction between solutes, microbial cells and membrane materials (Madaeni et al., 1999; Choi et al., 2002; Yu et al., 2005). However, Maximous et al (2009) observed that hydrophilic membranes did not benefit membrane flux although hydrophilic membranes did show better reversibility in cake resistance. This result is consistent with the finding observed by Parsmore et al (2002) that young biofilms attached on the hydrophilic membranes are more facile to be removed than hydrophobic
membranes. Nevertheless, it is difficult to show the correlation between membrane hydrophilicity and fouling, because membrane hydrophilicity usually accompanied by the changing of other membrane characteristics such as roughness. For example, Zhang et al (2008), reported that PES membranes fouled more easily than polyacrylonitrile (PAN) and polyvinylidene fluoride (PVDF) membranes due to higher degree of roughness and hydrophilicity.
2.1.1.3 Pore structure and size
Pore structure of membranes is also one of the important membrane characteristics affecting membrane fouling. Ho & Zydney (1999) filtered protein with various membranes such as track-etched, isotropic, and asymmetric microfiltration (MF) membranes. The result showed that membranes with interconnected pores fouled more slowly since the fluid could flow around the blocked pores. Hwang & Lin (2002) have shown that membranes with cylindrical pore structures had better filtration than those with sponge pore structures for filtration of suspension containing polymethyl methacrylate (PMMA) spherical particles. Fang & Shi (2005) also demonstrated that PES membrane which has the sponge-like microstructure with large pore openings had the highest pore resistance for filtration of activated sludge due to its large pore openings (18-20 µm). As a result, MBR system should use cake-resistance-dominant membranes, such as track-etched polycarbonate (PC), PVDF and mixed cellulose esters (MCE) rather than pore-resistance-dominant membranes like PES.
Choo & Lee (1996) proposed that MF membranes with 0.1 µm had minimal fouling tendency compared to membranes with 0.02, 0.5, and 1 µm. However, researchers have found that membrane pore size have no significant impact on critical flux (Madaeni et al., 1999; Le-Clech et al., 2003b). Critical flux was affected only when membranes with small pore size and in low concentration of mixed liquor suspended solids. As a result, the effect of membrane pore size on membrane fouling may depend on both particle size of sludge and membrane.
2.1.1.4 Surface charge
Surface charge of the membrane is critical to membrane fouling because the interaction between organic compounds and membranes depends on membrane surface charge. Surface charge of the membrane can attract or repel charged species in water. It is generally accepted that negatively charged membrane is preferable in
greatly affect the adsorption of effluent organic matters (Jarusutthirak & Amy, 2001). Pasmore et al (2002) reported that biofilm attached on the membrane surface was easier to be removed when membrane surfaces bear neutral or slight negative charges.
2.1.2 Sludge characteristics
Sludge characteristics of MBRs directly relate to the feed characteristics and the environmental/operational conditions as illustrated in Figure 2.1. Different feed characteristics and the environmental/operating conditions result in different sludge characteristics. Membrane fouling is due to the interaction between sludge and membranes, and, therefore, sludge characteristics play a vital role in membrane fouling in MBRs.
2.1.2.1 Particle size
Sludge was generally divided into three components, suspended solids, colloids and solutes, by size to investigate their contributions on membrane fouling in MBRs. Table 2.2 compares the results concerning the contribution of sludge components on membrane fouling in various studies. Inconsistent results were observed in these published studies. Wisniewski & Grasmick (1998) showed that solutes were the main causes for membrane fouling. Others showed that suspended solids were the main contributor for membrane fouling (Defrance et al., 2000; Lee et al., 2003; Bae & Tak, 2005a). Bouhabila et al (2001), on the other hand, found that colloids were the major component for membrane fouling. These contradictory findings may be caused by the differentce in operational conditions, sludge properties, methods of sludge separation and others.
In order to mitigate membrane fouling in MBRs, shear stresses along membranes are created by aeration in submerged MBRs or tangential flows in side-stream MBRs. Therefore, activated sludge usually contains larger flocs, while MBR sludge contains primarily small flocs due to higher shear stress. High shear stress could break and sludge flocs and reduce their size, resulting in serious fouling (Wisniewski & Grasmick, 1998; Cicek et al., 1999)
. Chang & Kim (2005) compared the filtration performance of a submerged MBR and a tertiary treatment plant with membrane unit. They found that the tertiary treatment plant with membrane unit had worse filtration performance due to the small particle size in the secondary effluent. Bae & Tak (2005a) further fractionated the MBR sludge into solutes, colloids and suspended solids, and concluded that the fouling contribution of each sludge fraction was strongly related to particle size because both permeation drag and back transport velocity are particle size-related functions. Therefore, it is important to control the operational conditions to avoid breaking sludge flocs and simultaneously provide suitable shear stress for membranes filtration.
Table 2.2. Relative Contribution of sludge components on membrane fouling (%)
Fraction Wisniewski & Grasmick (1998)
Defrance et al. (2000)
Bouhabila et al.
(2001) Lee et al. (2003) Bae & Tak (2005a)
Suspended solids 24 65 24 63-72 72-83 Colloids 24 30 50 4-14 Solutes 52 5 26 28-37a 13-14 a supernatant
2.1.2.2 Extracellular polymeric substances
As mentioned in 2.1, EPS is the most commonly discussed foulant in studies. Extracellular polymeric substances is a complex mixture of macromolecular polyelectrolytes including polysaccharides, protein, nucleic acids, and humic compounds. It is generally subdivided into two categories: (1) bound or extractable EPS (sheaths, capsular polymers, condensed gel, loosely bound polymers, and attached organic material) and (2) soluble EPS (soluble macromolecules, colloids, and slimes) (Laspidou & Rittmann, 2002; Rosenberger & Kraume, 2002). According to Laspidou & Rittmann (2002) soluble EPS is the same as soluble microbial products (SMP) which is defined as the pool of organic compounds that are released into solution from substrate metabolism and biomass decay (Barker & Stuckey, 1999). However, Ramesh et al (2006) compared the physiochemical characteristics of soluble EPS and SMP and concluded that soluble EPS and SMP were not identical. Furthermore, since there is no standard extraction method of EPS, contradicting results were found in studies concerning fouling caused by EPS and SMP, which were listed in Table 2.3. Although different foulants were identified, recent studied have suggested that soluble fraction (soluble EPS and SMP), especially the carbohydrates, is the major foulants in MBRs (Table 2.3).
Not only the quantity of EPS or SMP, but also the composition of EPS or SMP is critical for membrane fouling in MBRs (Mukai et al., 2000). Carbohydrates and proteins are the most abundant components in EPS or SMP. Therefore, studies have focused on the effect of protein and carbohydrate ratio (protein/carbohydrate) on membrane fouling. Preferential adsorption of solutes and sludge particles on membranes was observed when protein/carbohydrate ratios were high by Ji & Zhou (2006) and Choi et al (2009). They found that gradually increase the protein/carbohydrate ratio in bound EPS was likely to increase fouling propensity. Moreover, Kim & Nakhla (2009) reported that the higher protein/carbohydrate ratio in SMP was related with higher fouling rate. In summary, higher protein/carbohydrate ratio is associated with membrane fouling, whether they are SMP or bound EPS.
Table 2.3. EPS and SMP on membrane fouling.
Influent Membrane module Details Major foulants identified References
Synthetic wastewater Loop-type hollow fiber;
polyethylene; 0.1 µm - Bound EPS
Nagaoka et al. (1996a)
Synthetic wastewater
Flat sheet; regenerated cellulose, acrylic copolymer, polysulfone (PS); 30k and 50k Da
- Extractable EPS Chang & Lee
(1998) Municipal wastewater Hollow fiber; polyethylene with hydrophilic coating; 0.4 µm SRT: 20, 50 and 100 days; HRT: 4 h; F/M: 0.1 and 1 kg COD/kg MLVSS SMP Cho et al. (2003) - - - SMP Jefferson et al.(2004)
Synthetic wastewater U-shaped hollow fiber; PS, 0.1 µm
Organic loading: 0.3-0.4 g
COD/g MLSS/d Soluble EPS
Hernandez Rojas et al. (2005)
Municipal effluent, municipal wastewater and Industrial wastewater
MF and UF Six pilot cases in Europe Polysaccharides, a part of bacterial EPS
Rosenberger et al. (2005) SRT: 8, 20 and 80 days;
Table 2.3. EPS and SMP on membrane fouling (continued)
Influent Membrane module Details Major foulants
identified References
Synthetic wastewater Hollow fiber; 0.1µm Constant pressure operation Extractable EPS Meng et al.
(2006c)
Synthetic wastewater Flat sheet; hydrophilic polypropylene; 0.2 µm
SRT: 10 and 30 days; TOC/m3/day;
Organic loading: 0.6-0.7 kg Constant flux operation
Polysaccharides in supernatant EPS (i.e. soluble EPS)
Zhang et al. (2006b) Municipal wastewater Hollow fiber (ZeeWeed 500); PVDF; 0.04 µm SRT: 5 and 12 days; MLSS: 10.9 to 21.1 g/L; Constant flux operation
Soluble EPS (soluble carbohydrates and humic substances) Fan et al. (2006)
Municipal wastewater (MBR for enhanced wastewater treatment involving nitrification,
denitrification and advanced biological phosphorous removal)
Hollow fiber; 0.1-0.2 µm SRT: 8, 8.6, 14.7 and 14.8 days; F/M: 0.13-0.21 kg COD/kg MLSS/d; Organic loading: 1.5-1.69 kg COD/m3/d Polysaccharide fraction of soluble EPS or SMP Ronsenberger et al. (2006)
Municipal wastewater Hollow fiber; 0.035 µm Constant flux operation SMP Trussell et al.
(2006)
Municipal wastewater Hollow fiber;
PVDF; 0.04 µm
SRT: 12 days;HRT: 7 and 10 h; Organic
loading: 0.88 and 1.03 kg COD/m3/d Soluble EPS
Geng & Hall (2007)
Table 2.3. EPS and SMP on membrane fouling (continued)
Influent Membrane module Details Major foulants identified References
Synthetic wastewater Flat sheet; polyethylene; 0.4 µm
HRT: 12 h; Organic loading:
0.36 and 0.9 kg TOC/m3/d
SMP Jeong et al.
(2007)
Synthetic wastewater and
domestic wastewater Flat sheet; PAN and PES; UF
HRT: 12, 13 and 17 h; SRT: 22-31 days; F/M:
0.11-0.66 g COD/g VSS/d
SMP but only under certain conditions such as larger particle size and low sludge age
Drews et al. (2008)
Synthetic wastewater Flat sheet; polypropylene; 0.1µm
Sequencing batch MBR; HRT: 12 h;
SRT: 10, 20, 40 and 60 days Carbohydrate in SMP
Dong & Jiang (2009)
2.1.2.3 Mixed liquor suspended solids
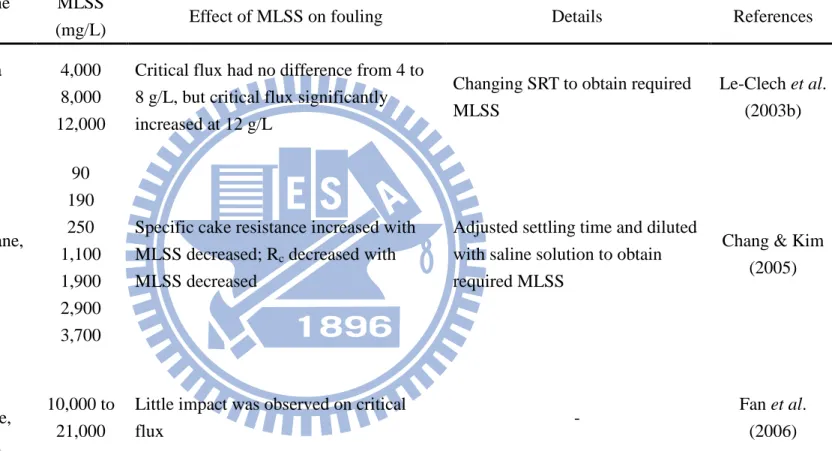
Concentration of mixed liquor suspended solids (MLSS) is considered to impact directly upon cake layer formation on the membrane surface. The deposited cake layer on the membrane surface can play an important role in flux decline or trans-membrane pressure (TMP) increase, although contradict results were observed in studies. Table 2.4 shows the effect of MLSS on membrane fouling. Nagaoka et al (1996a) found that higher MLSS in MBRs resulted in higher sludge viscosity which caused serious membrane fouling. The finding was in consistent with the result observed by Madaeni et al (1999). On the other hand, some studies reported that higher MLSS resulted in better filtration performance (Lee et al., 2001). Others have concluded that there was no significant impact of MLSS on membrane fouling or the impact depended on the concentration of MLSS (Defrance et al., 2000; Hong et al., 2002; Rosenberger & Kraume, 2002; Le-Clech et al., 2003b; Fan et al., 2006)
. This may be explained by the complex sludge composition. For example, sludge taken from different MBRs may possess different sludge properties such as particle size distribution and EPS, which are important in membrane fouling. Moreover, some studies evaluated the impact of MLSS on membrane fouling by settling sludge or diluting with saline solution, which neglected the non-settable fraction of sludge and small particles in sludge. Hence, the relationship between MLSS and membrane fouling is difficult to establish without considering other important factors.
Table 2.4. Relationship between MLSS and membrane fouling in MBRs.
Influent Membrane module MLSS
(mg/L) Effect of MLSS on fouling Details References
Synthetic wastewater Polyethylene, 0.1 µm,
loop-type hollow fiber -
Increasing MLSS resulted in decreasing filterability due to higher sludge viscosity
- Nagaoka et al.
(1996a)
- HVLP membrane (MIllipore),
0.45 µm 0 to 10,000
Critical flux was lower for higher concentration Testing with batch a crossflow cell Madaeni et al. (1999) Domestic water (75%) and industrial wastewater (25%)
Ceramic membrane, 0.1 µm 2,000 to 6,000 No significant effect
Adjusted settling time to obtain required SS
Defrance et al. (2000)
Table 2.4. Relationship between MLSS and membrane fouling in MBRs (continued)
Influent Membrane module MLSS
(mg/L)
Effect of MLSS on
fouling Details References
Synthetic wastewater Polyethylene, 0.1 µm, u-shaped hollow fiber
100 1,000 1,500 2,000 3,000 5,000 Increasing MLSS resulted in better membrane permeability Attached growth vs. suspended growth microorganisms Lee et al. (2001)
Municipal, domestic, fruit juice rinsing wastewater and wastewater containing surfactants
Zenon, Kubota, GKSS and X-flow
2,000 to
24,000 No effect -
Rosenberger & Kraume (2002)
Synthetic wastewater PS membrane, 0.1 µm, hollow fiber
3,600 6,800 8,400
Table 2.4. Relationship between MLSS and membrane fouling in MBRs (continued)
Influent Membrane
module
MLSS
(mg/L) Effect of MLSS on fouling Details References
- 200 kDa 0.1 µm 1 µm 4,000 8,000 12,000
Critical flux had no difference from 4 to 8 g/L, but critical flux significantly increased at 12 g/L
Changing SRT to obtain required MLSS Le-Clech et al. (2003b) Synthetic wastewater PS membrane, 30 kDa, 90 190 250 1,100 1,900 2,900 3,700
Specific cake resistance increased with MLSS decreased; Rc decreased with
MLSS decreased
Adjusted settling time and diluted with saline solution to obtain required MLSS
Chang & Kim (2005) Municipal wastewater PVDF membrane, 0.04 µm 10,000 to 21,000
Little impact was observed on critical
flux -
Fan et al. (2006)
2.1.2.4 Hydrophobicity and surface charge
Other sludge characteristics like hydrophobicity and surface charge of sludge also have significant impact on membrane fouling. Lee et al (2003) found that hydrophobicity and surface charge of flocs were closely related to composition and properties of EPS and were significantly related to composition and properties of EPS and could be used to estimate resistance caused by flocs. Arabi & Nakhla (2009) have reported that higher EPS concentration and relative hydrophobicity of flocs in nitrification and denitrification MBR resulted in increasing of cake resistance. Meng et al (2006b) concluded that higher hydrophobicity of flocs resulted from excess growth of filamentous bacteria would cause serious membrane fouling in MBRs. Ahn et al (2007) also found that severe fouling was due to the increased EPS and hydrophobicity of supernatant when using an anaerobic upflow bed filter combined with an aerobic MBR to treat high strength organic and nitrogen wastewater.
2.1.2.5 Floc morphology
By theory, all the biomass in MBRs can be retained by the membrane unit to maintain an excellent effluent quality regardless of the sludge seattleability. Hence, sludge bulking should not be a problem in MBRs. However, Chang & Lee (1998) reported that foaming sludge showed greater flux decline than the non-foaming sludge. Later, Chang et al (1999) also reported that bulking sludge had higher fouling tendency than normal sludge and pinpoint sludge. Among these three sludge morphologies, normal sludge had the least fouling tendency. More recently, studies have focused on the effect of filamentous bacteria on membrane fouling in MBRs. They have demonstrated that bulking sludge caused by overgrowth of filamentous bacteria resulted in deterioration of MBR performance (Meng et al., 2006a, 2006b, 2007). Meng et al (2006b) reported that the excess growth of filamentous bacteria formed a non-porous cake layer on the membrane surface which interfered with the membrane filtration. Meng et al (2006a, 2007) and Meng & Yang (2007) further suggested that bulking sludge caused the formation of a dense cake layer on the membrane surface due to the fixation of filamentous bacteria. You & Sue (2009) concluded that for relatively high hydrophobic membranes, foam-forming filamentous bacteria had negative effect on membrane fouling. On the other hand, for relatively low hydrophobic membranes foam-forming filamentous bacteria had no significant effect on membrane fouling. However, Li et al (2008) found an opposite result that filamentous bacteria had negligible effect on membrane fouling. In most of these studies, the sludge samples in test were taken from a different MBR reactor operated under different operation condition while the filtration resistance tests were performed under constant TMP operation in short filtration duration (4 hours) (Meng et al., 2006a, 2006b, 2007; Meng & Yang, 2007). It
has been well accepted that sludge from different influent wastewater and different processes (e.g. A/O MBR and sequencing batch MBR) possesses different characteristics, which may be the cause for such contradictory results.
2.1.3 Environmental and operational conditions
Environmental and operational conditions of MBRs directly alter the sludge characteristics and hydrodynamic conditions, which have important impact on membrane fouling. Sludge under different environmental and operational conditions will produce EPS in various quantity and quality which in turn will affect membrane performance in MBRs.
2.1.3.1 Sludge retention time
Sludge retention time which directly affects the properties of biomass and the concentration of MLSS is one of the most common operating conditions discussed in the studies. Due to the membrane unit applied in MBRs, SRT can be infinitely lengthened theoretically, which can reduce sludge production, tolerate unstable fluctuation of organic loading and reduce footprint of wastewater treatment plants. However, in order to avoid high sludge viscosity resulting from high MLSS concentration, most MBRs are operated at SRT from 10 to 60 days. Table 2.5 lists the studies concerning the effect of SRT on membrane fouling. Despite the decreased concentration of MLSS, most studies found that decreasing SRT resulted in deterioration of membrane fouling (Chang & Lee, 1998; Grelier et al., 2006; Ng et al., 2006; Zhang et al., 2006b; Ahmed et al., 2007; Holakoo et al., 2007; Liang et al., 2007; Al-Halbouni et al., 2008; Dong & Jiang, 2009)
. Some studies pointed out that higher fouling potential at shorter SRT is due to the higher concentration of SMP or EPS (Ng et al., 2006; Zhang et al., 2006b; Dong & Jiang, 2009). Other studies, however, showed contradictory result that longer SRT had higher fouling tendency (Rosenberger & Kraume, 2002; Lee et al., 2003)
. The ranges of SRTs used in these two studies were similar (5 to 60 days), totally opposite findings were observed. Therefore, a different approach must be taken to understand the effect of SRT on membrane fouling.
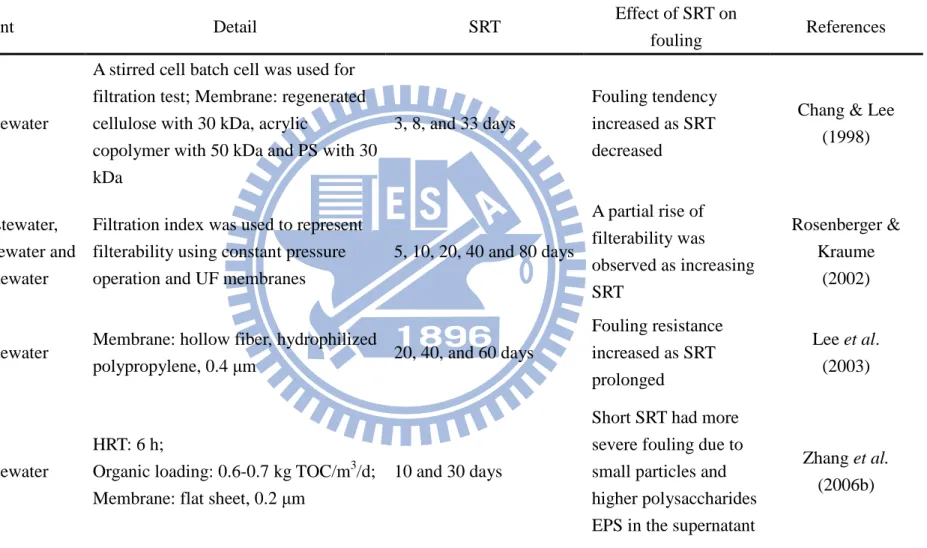
Table 2.5. Effect of SRT on membrane fouling.
Influent Detail SRT Effect of SRT on
fouling References
Synthetic wastewater
A stirred cell batch cell was used for filtration test; Membrane: regenerated cellulose with 30 kDa, acrylic
copolymer with 50 kDa and PS with 30 kDa
3, 8, and 33 days
Fouling tendency increased as SRT decreased
Chang & Lee (1998)
Municipal wastewater, domestic wastewater and industrial wastewater
Filtration index was used to represent filterability using constant pressure operation and UF membranes
5, 10, 20, 40 and 80 days A partial rise of filterability was observed as increasing SRT Rosenberger & Kraume (2002)
Synthetic wastewater Membrane: hollow fiber, hydrophilized
polypropylene, 0.4 µm 20, 40, and 60 days
Fouling resistance increased as SRT prolonged Lee et al. (2003) Synthetic wastewater HRT: 6 h;
Organic loading: 0.6-0.7 kg TOC/m3/d; Membrane: flat sheet, 0.2 µm
10 and 30 days
Short SRT had more severe fouling due to small particles and higher polysaccharides EPS in the supernatant
Zhang et al. (2006b)
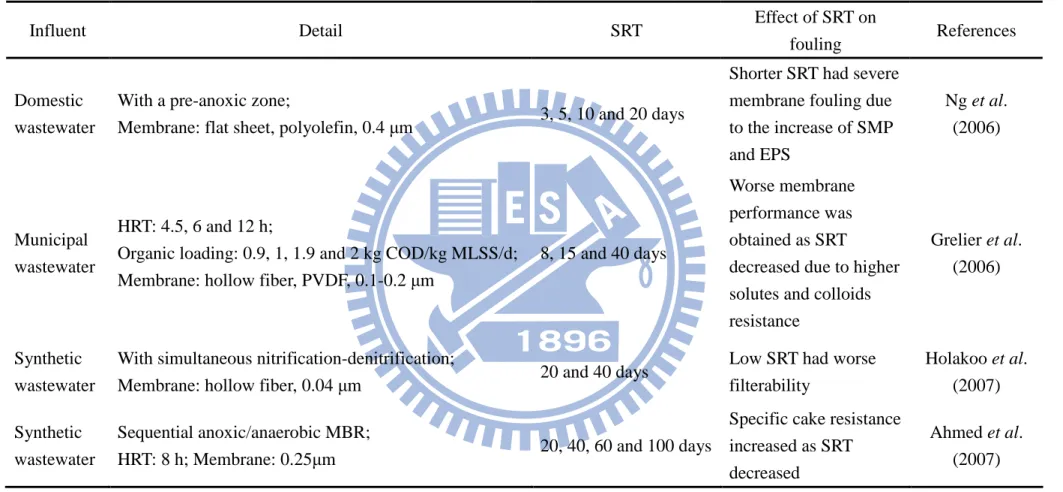
Table 2.5. Effect of SRT on membrane fouling (continued)
Influent Detail SRT Effect of SRT on
fouling References
Domestic wastewater
With a pre-anoxic zone;
Membrane: flat sheet, polyolefin, 0.4 µm 3, 5, 10 and 20 days
Shorter SRT had severe membrane fouling due to the increase of SMP and EPS Ng et al. (2006) Municipal wastewater HRT: 4.5, 6 and 12 h;
Organic loading: 0.9, 1, 1.9 and 2 kg COD/kg MLSS/d; Membrane: hollow fiber, PVDF, 0.1-0.2 µm
8, 15 and 40 days
Worse membrane performance was obtained as SRT
decreased due to higher solutes and colloids resistance
Grelier et al. (2006)
Synthetic wastewater
With simultaneous nitrification-denitrification;
Membrane: hollow fiber, 0.04 µm 20 and 40 days
Low SRT had worse filterability Holakoo et al. (2007) Synthetic wastewater Sequential anoxic/anaerobic MBR;
HRT: 8 h; Membrane: 0.25µm 20, 40, 60 and 100 days
Specific cake resistance increased as SRT decreased
Ahmed et al. (2007)
Table 2.5. Effect of SRT on membrane fouling (continued)
Influent Detail SRT Effect of SRT
on fouling References
Synthetic wastewater HRT: 10 h;
Membrane: flat sheet, polyolefin, 0.4 µm 10, 20, and 40 days
Shorter SRTs had high fouling potentials due to the hydrophilic neutrals of SMP Liang et al. (2007) Municipal wastewater HRT: 12 and 9 h; F/M: 0.09 and 0.14 kg COD/kg MLSS/d; Membrane: hollow fiber, PES, 0.05 µm
23 and 40 days
Low SRT had worse filtration index due to higher concentration of bound EPS , but the permeability of membranes was similar in both SRTs Al-Halbouni et al. (2008) Synthetic wastewater Sequencing batch MBR;
HRT: 12 h; Membrane: flat sheet, polypropylene, 0.1 µm
10, 20, 40 and 60 days
Fouling increased as SRT decreased due to higher SMP
Dong & Jiang (2009)
2.1.3.2 Imposed flux
Among all operational parameters, such as organic loading rate, flux and shear stress, imposed flux was found to have the greatest impact on membrane performance (Nagaoka et al., 1996b)
. To prevent rapid membrane fouling, constant flux operation is preferable and sub-critical flux is frequently chosen for crossflow filtration. The concept of critical flux was first proposed by Field et al (1995) that for microfiltration there was a flux below which a decline of flux with time does not occur; above it fouling is observed. Critical flux depends on the hydrodynamic conditions and other variables. They further divided the concept of critical flux into two forms: (1) strong form: Permeability (J/∆PT, K) is equivalent to the corresponding clean water permeability; (2) weak form: permeability is maintained at a constant. The latter is more practical for membrane filtration. Subsequently, different concepts of critical flux were proposed. Howell (1995) pointed out that under critical flux operation there is no membrane fouling by colloids and the value of critical flux is a function of particle size, hydrodynamics and membrane-colloid interactions. Chen et al (1997) proposed that under critical flux little (for MF) or negligible (for UF) hysteresis was observed. Li et al (2000) used direct observation through the membrane (DOTM) to identified critical flux as the start-up of the deposition of supermicron particles on MF membranes.
However, even under subcritical flux, membrane fouling is actually inevitable after operating for a period of time. Dramatic increase of TMP is eventually observed after a slow and progressive increase of TMP. The two-step TMP profile can be explained by the concept of local flux, proposed by Yu et al (2003) and Ognier et al (2004) when the MBR was operated under subcritical flux. At the state of filtration, the loss of effective filtration pores to the filtration occurs as a result of the deposit of macromolecules. Membrane pores for filtration will continue to be lost because of the gradual deposit of particles. Therefore, a slow and progressive increase in TMP will be observed on the initial period. The local flux of effective pores continuously increases in order to maintain the overall imposed flux. Once the loss of effective pores for filtration reaches a critical point, which means that the local flux is over the critical flux, a sudden TMP jump will be observed due to the formation of a cake layer. Despite the fact that membrane fouling still occurs, subcritical flux is usually practiced in MBRs to reducee the frequency of membrane cleaning. As a result, Choi
(changes in TMP for several fluxes), determination of inertial lift velocity, DOTM, mass balance, flux-step method and stepwise increase of TMP. Among these methods, flux-step method is more convenient and practical. Although the flux-step determination of critical flux cannot be used to predict long-term TMP behavior in real MBRs, it provides useful data on comparative fouling propensity. Combing specific hydraulic parameters such as initial TMP increase, rate of TMP increase, membrane permeability and average TMP with flux-step method, critical flux can be more precisely defined.
2.2 Mitigation of membrane fouling in MBRs
To mitigate membrane fouling in MBRs, several strategies have been proposed, including physical or chemical cleaning, optimization of membrane characteristics, optimization of operating conditions and modification of biomass characteristics (Le-Clech et al., 2006)
.
2.2.1 Modification of membrane characteristics
In most cases, membranes with hydrophobic characteristics have been found more prone to membrane fouling because of the hydrophobic-hydrophobic interaction between solutes, microbial cells and membrane materials as mentioned in 2.1.1.2. Several methods in surface modification of membrane such as plasma treatment (Yu et al., 2005, 2008)
, graft polymerization (Yu et al., 2007), and TiO2 modification (Bae & Tak, 2005b; Bae & Tak, 2005c; Bae et al., 2006)
have been proven efficient in reducing membrane fouling in MBRs. Recently, membrane surface modification by adding TiO2 onto membrane surface has attracted great attention due to its commercial availability and ease of preparation. Table 2.6 lists the studies which modified membrane surface by addition of TiO2 onto membrane surface. The idea of introduction of TiO2 onto membranes to mitigate membrane fouling was first proposed by Kwak and his coworkers (Kwak et al., 2001; Kim et al., 2003)
. They modified thin-film-composite (TFC) RO membranes by a coating of TiO2 nanoparticles. The composite membrane showed substantial prevention against microbial fouling under UV illumination. Luo et al (2005) then used the same method to prepare the composite UF membranes. They found that the composite membranes not only had antifouling properties but also perform better when filtering PEG solution. For MBRs, Bae and his coworkers performed a series of experiments investigating the antifouling ability of TiO2-entrapped membrane and TiO2-deposited membrane (Bae & Tak, 2005b, 2005c; Bae et al., 2006). Both membranes reduced fouling in filtration of activated sludge. The TiO2-deposited membrane had better antifouling ability than the entrapped one because larger amount of TiO2 was located on the membrane surface. More recently, several researchers have applied the similar
membrane modification technology to reduce membrane fouling under UV or non-UV illumination (Choi et al., 2007; Madaeni & Ghaemi, 2007; Yang et al., 2007; Rahimpour et al., 2008). No matter what the TiO2 composite membranes preparation is, all of the TiO2 composite membranes provide good antifouling ability for filtration of activated sludge, BSA, whey and non-skim milk. However, it is noted that most of these studies synthesized the composite membranes by dip-coating in acidic TiO2 solution (pH 1.5). This may have the risk of deteriorating membrane structure and shorting the lifespan of membranes.
Table 2.6. Fouling mitigation by coating TiO2 on membranes
Preparation of TiO2
Membrane and Method of
modification Details Results References
Controlling of hydrolysis of titanium tetraisopropoxide, Ti(OCH(CH3)2)4 under pH 1.5 TFC membranes (RO);
Dip-coating in TiO2 solution for 1h
Escherichia coli (E. coli) as a model bacterium
Antibacterial fouling was remarkably higher for the TiO2
hybrid membrane under UV illumination Kwak et al. (2001) Controlling of hydrolysis of titanium tetraisopropoxide under pH 1.5 TFC membranes (RO);
Dip-coating in TiO2 solution for 1h
Escherichia coli as a model bacterium
The TiO2 composite membrane
showed substantial prevention against microbial fouling under UV illumination Kim et al. (2003) Controlling of hydrolysis of titanium tetraisopropoxide under pH 1.5
PES membrane (UF);
Dip-coating in TiO2 solution for 1h
Polyethylene glycol (PEG-500) solution was used for evaluation of the separation
performance of the composite membrane
The composite membrane showed good separation performance and substantial prevention against hydrophobic substances
Luo et al. (2005)
Table 2.6. Fouling mitigation by coating TiO2 on membranes (continued)
Preparation of TiO2
Membrane and Method of
modification Details Results References
Commercial Degussa TiO2
PS, PVDF and PAN (UF)
membrane; addition of TiO2 into
casting solution (TiO2-entrapped
membrane) and dip-coating in TiO2 solution for 1 min and
pressuring at 400 kPa for 2 h (TiO2-deposited membrane)
Activated sludge (MLSS: 7,000 mg/L) from a submerged MBR was used to evaluate the antifouling potential of the composite membrane
TiO2 deposited membrane
showed greater fouling
mitigation than TiO2 entrapped
membrane Bae & Tak
(2005b) Controlling of hydrolysis of titanium tetraisopropoxide under pH 1.5
PES membrane (MF); sulfonattion and dip-coating in TiO2 solution
for 10 min
Activated sludge (MLSS: 6,900 mg/L) from a submerged MBR was used to evaluate the antifouling potential of the composite membrane
Membrane fouling was greatly reduced by the immobilization of TiO2 particles on the
membrane surface
Bae & Tak (2005c)
Controlling of
hydrolysis of PES membrane (UF); sulfonattion
Activated sludge (MLSS: 7,000
mg/L) from a submerged MBR The composite membrane
Table 2.6. Fouling mitigation by coating TiO2 on membranes (continued)
Preparation of TiO2
Membrane and Method of
modification Details Results References
Hydrolysis of titanium tetraisopropoxide in isopropanol with Tween 80 surfactant Al2O3 membrane;
Dip-coating in TiO2 solution
Activated sludge was used to evaluate the antifouling potential of the TiO2/Al2O3
membrane
The composite membrane exhibited less adsorption fouling tendency under UV illumination
Choi et al. (2007)
Commercial TiO2
was added into sodium dodecylsulfone (SDS) solution to acquire TiO2 powders PS membrane; addition of TiO2 into casting solution
1 % bovine serum album (BSA, 67 kDa) was used to evaluate the antifouling performance
At 2% TiO2 content, the composite
membrane exhibited good antifouling ability Yang et al. (2007) Commercial Degussa TiO2 TFC membranes (RO); Dip-coating in 0.003% TiO2
solution for 10 min
Whey was used to evaluate the antifouling
performance
The composite membrane acquired self-cleaning property and higher flux under UV illumination,
especially when incorporating SiO2
Madaeni & Ghaemi (2007)
Table 2.6. Fouling mitigation by coating TiO2 on membranes (continued)
Preparation of TiO2
Membrane and Method of
modification Details Results References
Commercial Degussa TiO2
PES membrane; addition of TiO2 into casting solution
(TiO2-entrapped membrane) and
dip-coating in TiO2 solution for
15, 30 and 60 min
(TiO2-deposited membrane)
Non-skim milk was used to evaluate the antifouling performance at 50 psi and 4 h
Both TiO2-entrapped and
TiO2-deposited membranes
showed good antifouling
properties under UV illumination but TiO2-deposited membranes
showed superior antifouling ability under UV illumination
Rahimpour et al. (2008)
Chapter 3
Experimental methods
3.1 Material
3.1.1 Membrane bioreactor and operation
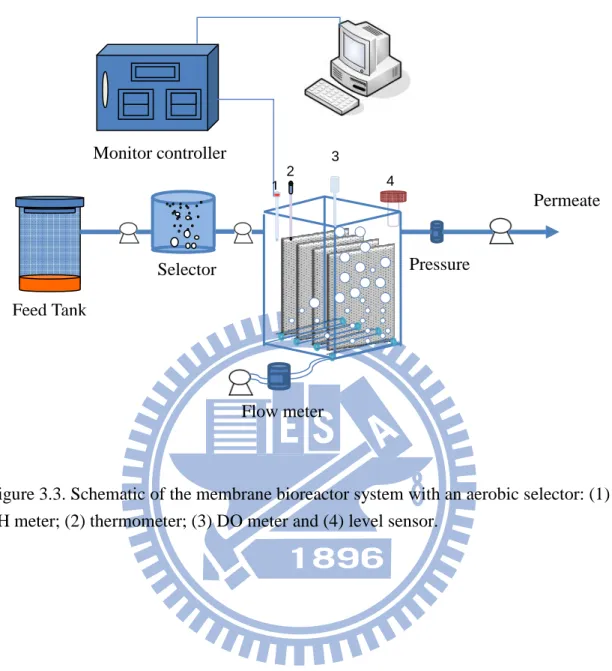
The experimental MBR system comprised a 30-L aerated tank as the bioreactor with a submerged flat sheet module (Kubota, Japan), which is shown in Figure 3.1. The MF membrane is a hydrophilic polypropylene membrane with a mean pore size of 0.4 µm. The synthetic wastewater we used in this study was modified from Ng and Hermanowicz (2005). Although the synthetic wastewater is likely to be more biodegradable than the real wastewater, the difference between synthetic and real wastewater should not affect our study. Many other researchers have used synthetic wastewater in similar studies based on the same reason (Meng et al., 2006b, 2006c; Li et al., 2008). The composition of the synthetic wastewater is given in Table 3.1. The concentrated synthetic municipal wastewater was pumped into the bioreactor continuously at a constant rate to maintain a fixed organic load rate (1.2 kg TOC/m3.day) to the MBR. Tap water was added to the bioreactor so that the feed flow rate matched the permeate flow rate. The concentrated sewage was diluted six-fold and the chemical oxygen demand (COD) concentration of the final feed was 400±10 mg/L. The seed for the MBR was obtained from a wastewater treatment plant in National Chiao Tung University, Taiwan. An ADAMview software and a programmable logic controller were used to adjust the flux by feedback control. A desired flow rate was first set. When the flow rate was detected by the permeate flow meter, a signal was sent to the computer and the pump speed was adjusted accordingly to keep the flow rate constant. The pH of the sludge suspension was adjusted to 7.0±0.2 by adding hydrate chloride and sodium hydroxide. In this study all the experiments were carried out after the MBR was acclimated for 3 SRT to ensure the stability of the sludge characteristics. The SRTs of the MBR were maintained at 10, 30 and 60 days, respectively. After 3 SRT, the critical flux was measured by flux-step method (Le-Clech et al., 2003a). The step duration and step height were chosen at 15 min and 6 L/m.h in this study, respectively. The initial flux was set at 12 L/m2.h. Each constant flux was operated for 15 min. The flux was increased by 6 L/m2.h at the end of each step until it reached 60 L/m2.h. As shown in Figure 3.2, the critical flux was around 24 L/m2.h over which TMP increased apparently. To maintain a subcritical operation, the imposed flux used in this study was set at 16 L/m2.h.
An aerobic selector of 1-L working volume was installed when sludge bulking became serious to change the sludge characteristics. The aerobic selector was set up
ahead of the MBR. The simulated sewage was fed into the aerobic selector and then, pumped to the MBR. The Membrane bioreactor system equipped with an aerobic selector is illustrated in Figure 3.3.
A dead-end stirred cell system, as shown in Figure 3.4, was used to analyze the filtration resistance contributed by individual sludge component as well as the contribution distribution. Sludge was filtered through the membrane by the pressure from a nitrogen cylinder. Permeate was continuously collected until a stable resistance was attained. The feed vessel in Figure 3.4 was replenished with clean water to maintain a fixed volume of 200 ml during the filtration. The diameter and the height of the stirred cell are 5.6 cm and 10 cm, respectively. A stirrer, which is 4.5 cm in length, is suspended above the membrane to generate shear rate by stirring. Two stirring rates, 400 rpm and 1,000 rpm, were selected in this study, to investigate the effect of shear rate on membrane fouling by sludge components. The effective area of the membrane is 24.63 cm2 and the working volume is 200 ml.
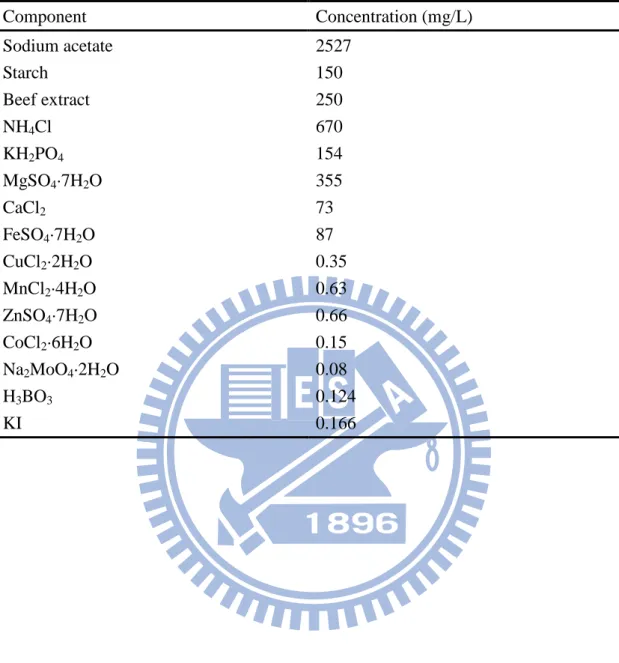
Table 3.1. Composition of the synthesized wastewater. (adapted from Ng & Hermanowicz, 2005) Component Concentration (mg/L) Sodium acetate 2527 Starch 150 Beef extract 250 NH4Cl 670 KH2PO4 154 MgSO4·7H2O 355 CaCl2 73 FeSO4·7H2O 87 CuCl2·2H2O 0.35 MnCl2·4H2O 0.63 ZnSO4·7H2O 0.66 CoCl2·6H2O 0.15 Na2MoO4·2H2O 0.08 H3BO3 0.124 KI 0.166
Time (min) 0 15 30 45 60 75 90 105 120 135 150 F lu x ( L /m 2 .h ) 0 10 20 30 40 50 60 70 T M P ( k P a) 0 2 4 6 8 10 12 14 16 Flux TMP
Figure 3.3. Schematic of the membrane bioreactor system with an aerobic selector: (1) pH meter; (2) thermometer; (3) DO meter and (4) level sensor.
Feed Tank 2 3 Monitor controller Flow meter Selector Pressure meter 4 1 Permeate
Figure 3.4. Dead-end stirred cell set-up: (1) nitrogen cylinder; (2) feed vessel; (3) pressure meter; (4) stirred cell; (5) magnetic stirrer; (6) permeate vessel and (7) electronic balance.
3.1.2 Preparation of nanosized TiO2 particles
The neutral TiO2 sol was prepared by a chemical coprecipitization-peptization method, as described in our previous study (Huang et al., 2007). Ammonium hydroxide (NH4OH) was dropped into a 1 M titanium tetrachloride (TiCl4) solution to form
Ti(OH)4. The yellow transparent TiO2 sol (1 wt% of TiO2) was obtained after 2 h peptization with hydrogen peroxide (10 %) and 24 h heating at 95℃. The TiO2 sol can remain homogeneous for a long period of time without any observable sedimentation.
The acidic TiO2 colloidal solution was prepared from the controlled hydrolysis of titanium tetraisoproposide, Ti(OCH(CH3)2)4 (Choi et al., 1994). A sample of 1.25 ml Ti(OCH(CH3)2)4 (Aldrich, 97%) was mixed with 25 ml of absolute ethanol. The solution was added drop by drop to 250 ml of distilled water (4℃), followed by pH adjustment to 1.5 with nitric acid. The mixture was stirred overnight until it was clear.
3.1.3 Preparation of TiO2 composite membranes
Two microfiltration (MF) membranes, cellulose acetate (CA) and mixed cellulose ester (MCE) membranes (Advantec MFS, Inc.), were used in this study. Both of them have nominal pore size of 0.2 µm and were cut into 24.63 cm2 to fit the experimental device. The virgin membrane was dipped in the TiO2 sol for one hour. After that, the membrane was washed with distilled water.
3.2 Analytical methods
3.2.1 Extraction of EPS
Many methods have been proposed for EPS extraction, including heating (Li et al., 2007)
, cation exchange (Meng & Yang, 2007), andextraction by EDTA chelating (Sheng et al., 2005) and formaldehyde-NaOH (Liu & Fane, 2002). The formaldehyde-NaOH extraction method was selected in this study since Liu and Fang (2002) have indicated that it is most effective and does not cause cell lysis. Extraction of EPS is illustrated in Figure 3.5. Ten milliliters of mixed liquor was sampled and centrifuged for 10 min at 4,000 rpm at 4℃ (U-320R Boeco, Germany), and then the supernatant was filtered through a 0.45 µm membrane filter (Mixed cellulose ester, Adventec). The permeate contained soluble EPS. The residual pellets were resuspended to 10 ml by using Milli-Q water, followed by the addition of 0.06 ml formaldehyde (63.5%). The suspension was
further purified by dialysis through a membrane of 3,500 molecular weight cut-off at 4℃ for two days to remove the extractant.