國
立
交
通
大
學
機 械 工 程 學 系
碩 士 論 文
放置可移動陶瓷粒子在一水平加熱銅板上
對 FC-72 池沸騰熱傳增強研究
Enhancement of FC-72 Pool Boiling Heat Transfer by
Movable Ceramic Particles on a Horizontal Plate
研 究 生:吳 錫 寰
指 導 老 師:林 清 發 教授
誌謝
兩年半的研究生活終於畫下句點。在交通大學我學到很多,也得到很多,許 多不如意的事開心的事依然歷歷在目,也因為這樣讓我變得更加圓滿,我喜歡新 竹,我喜歡交大,這裡的研究氣息、人文風氣我都很喜歡,在這裡我要跟交大說 一聲:謝謝。 在研究所的這段期間,很感謝林清發教授的細心指導。他是位真正的學者, 同時也是最好的老師,而且具備了高度的道德及人文素養。兩年多下來的陶冶, 我從什麼都不懂的小子慢慢變成稍微有點物理概念的研究生,我從老師身上學到 的遠比我想得多更多,至於今後我會永遠記得老師的指導、教誨。再來則是要感 謝博士班汪書磊學長的指導,雖然我們之間曾經發生過摩擦或是意見不合,但我 始終相信學長的出發點是為我好,希望之後你一切順利。再來是感謝我最敬重對 我最好的學長葉庭鈞,不僅在我的生活、研究想法甚至是我的思考,我的一切你 都毫無保留的與我分享給我意見,也徹底改變了我的價值觀,讓我變成一個隨順 圓滿的人,我想我們之間已經不是用同學就可以形容,你更像是我的哥哥。在這 裡也要親自跟你說聲謝謝,我想我們在追求目標的過程中,一定會再相遇。同時 也感謝學妹與學弟:李貞儀、江奕勳你們的活力熱血為實驗室注入了一股新的氣 息,也謝謝你們的幫忙讓我的實驗才可以順利完成,有你們真好。謝謝你們讓我 度過碩士生涯最開心的一學期,希望能夠莫忘加入實驗室的初衷,在未來路上將 自己的目標與理想發揚光大並加以實踐。家魁你永遠都是我的好夥伴 謝謝你聽 我訴苦也謝謝你的關心。仕文老大也感謝你在我寫論文時給我很多意見,陪我聊 天。同學薛正宏與我共同經歷了很多事情千言萬語大概也只有感謝與祝福。 在此也要感謝家人、王門的冠丞、顯文、建銘,謝謝你們在我實驗遇到困難 時幫我忙,以及保杰、 國淳時常鼓勵我以及其他關心過我的人,沒有你們的支 持與鼓勵我是無法走到今天的。他日我若有一點小小成就,那必然是你們曾經有 過的莫大幫助所造就的。滴水之恩,必定湧泉以報。 最後,我要對未來可能會翻閱到此頁的人和我說句話:也許已經過了很久, 或許現在已是十年、二十年甚至更久之後了,每個人都不應該向現實屈服而是要 仍不斷地學習成長、朝目標前進。不論何者,我都要說,請創造更好的未來吧, 為你我的家人朋友享受更好的未來,不論何時,不論幾歲,不論開心,不論難過, 這都要放在心上。 吳錫寰 2014/1 於新竹交大
放置可移動陶瓷粒子在一水平加熱銅板上
對 FC-72 池沸騰熱傳增強研究
研 究 生:吳 錫 寰 指 導 老 師:林 清 發 教授
國立交通大學機械工程學系摘要
本論文針對放置可移動陶瓷粒子於加熱銅板上對 FC-72 池沸騰熱傳增強實 驗研究。可移動顆粒放置於加熱銅板表面上並且由一個四方型的壓克力圍牆圍住, 來防止可移動顆粒不會因為液體的流動,導致可移動顆粒被沖離了加熱銅板表面。 在實驗中探討顆粒種類、顆粒直徑和顆粒的數量。在實驗參數範圍上,熱通量 q 從 0.1 到 6W/cm2,顆粒種類為氧化鋯和氮化矽,氧化鋯顆粒直徑有 1.0 和 1.6 mm, 顆粒的數量從 100 到 1800(對於直徑為 1.0 mm 的顆粒)和 100 到 700(對於直徑為 1.6 mm 的顆粒),而氮化矽顆粒直徑有 1.6 和 2.0 mm,顆粒的數量從 100 到 700(對 於直徑為 1.6 mm 的顆粒)和 100 到 500(對於直徑為 2.0 mm 的顆粒)。 實驗數據以壁過熱度對應輸入的熱通量及熱傳係數表示,比較對於光滑加熱 銅塊下熱傳增強的表現。放置可移動陶瓷氧化鋯粒子相較於光滑表面對於 FC-72 之池沸騰熱傳係數有 550%的增強效果。而對於放置可移動陶瓷氮化矽粒子相較 於光滑表面,整體的沸騰熱傳係數有 560%的增強效果。甚至當加熱銅板上覆蓋 滿顆粒(最多鋪滿兩層)對於整體的散熱效果有明顯的增強。但在高熱通量時,散 熱效果有降低的趨勢,特別對於氧化鋯顆粒放置直徑 1.6 mm 的顆粒,散熱效果 降低的趨勢很明顯,而對氮化矽而言散熱效果幾乎沒有降低。由數據呈現的圖形 可得,熱傳增強的表現會因其不同的參數搭配而有不同的增強效果,理想且良好 的熱傳增強表現在於適當的顆粒種類、顆粒直徑和顆粒數量的搭配。 由數據呈現的結果指出,放置可移動擾動粒子於加熱銅板上後對於整體的
散熱效果有增強的效果也有降低的效果。在高熱通量時,散熱效果有明顯降低的 現象。
i
Enhancement of FC-72 Pool Boiling Heat Transfer by
Movable Ceramic Particles on a Horizontal Plate
Student: His-Huan Wu Advisor: Prof. Tsing-Fa Lin
National Chiao Tung University
ABSTRACT
An experiment is carried out here to investigate how the saturated pool boiling heat transfer of liquid FC-72 over a horizontal heated copper plate of 3×3 𝑐𝑚2 in
surface area is affected by placing fine ceramic particles above the surface, intending to explore the possible pool boiling heat transfer enhancement by the boiling flow driven moving particles. Both zirconia and silicon nitride particles are tested. The particles are freely placed above the heated plate with a rectangular fence surrounding the plate so that the particles can be moved by the force induced by the boiling flow without being blown away. In the experiment, the imposed heat flux is varied from 0.1 to 6W/cm2 with the diameter of the particles fixed at 1.0 and 1.6 mm for the zirconia particles and at 1.6 and 2.0 mm for the silicon nitride particles. Besides, the total particle number placed on the plate ranges from 100 to 1800 for the small zirconia particles, from 100 to 700 for the particles at 𝑑𝑝=1.6 mm, and from 100 to 500 for the large silicon nitride particles at 𝑑𝑝=2.0 mm. The measured data are
presented in terms of boiling curves and boiling heat transfer coefficients for the case with the presence and absence of the particles. The experimental parameters include the imposed heat flux level and the size, material and number of the particles.
The data obtained from the present study for the saturated pool boiling indicate that placing the movable ceramic particles on the heated plate can significantly
ii
increase the pool boiling heat transfer coefficient of FC-72 at low and medium heat fluxes (wall superheats). For the zirconia particles the enhancement can be up to 550% over that for a bare surface for a certain combination of the experimental parameters. The best enhancement can be as high as 560% for the lighter silicon nitride particles. Even when more than one layer of particles is placed on the plate relatively significant boiling heat transfer enhancement can still be obtained. However, the boiling heat transfer enhancement varies nonmonotonically with the particle size, number and material and the heat flux applied, reflecting the complex mutual influences of the movable particles and bubble motion near the heated surface. An optimal boiling heat transfer enhancement could be procured by a suitable choice of the experimental parameters. Besides, the wall superheat for the incipient boiling can be substantially reduced by the moving ceramic particles. However, for cases at high heat flux (wall superheat) placing the large zirconia particles on the plate can noticeably reduce the boiling heat transfer. Moreover, the boiling heat transfer enhancement by the lighter ceramic particles is found to be somewhat better than that by the heavier metallic particles. Furthermore, the boiling heat transfer retardation at high heat flux by the ceramic particles in less severe.
The results from the visualization of the bubble and particle movement in the boiling flow over the copper plate reveals the complicate interactions between the particles and boiling flow, which is useful in identifying the mechanisms of enhancing and retarding the boiling heat transfer by the particles at different levels of the wall superheat. At high heat flux the retarding effect by the particles can be strong.
iii
TABLE OF CONTENTS
ABSTRACT(ENGLISH) i
TABLE OF CONTENTS iii
LIST OF TABLE v
LIST OF FIGURES vi
NOMENCLATURE xiii
CHAPTER 1 INTRODUCTION 1
1.1 Motive of the Present Study 1
1.2 Literature Review 3
1.3 Objective of Present Study 8
CHAPTER 2 EXPERIMENTAL APPARATUS AND PROCEDURES 10 2.1 Main Test Chamber 10 2.2 Test Heater Assembly 11 2.3 Confinement of Particles and Experimental Parameters 12 2.4 DC Power Supply 13 2.5 Data Acquisition 13 2.6 Optical Measurement Technique 13 2.7 Experimental Procedures 14
CHAPTER 3 DATA REDUCTION 22
3.1 Boiling Heat Transfer Coefficient 22 3.2 Uncertainty Analysis 24
C CHAPTER 4 POSSIBLE POOL BOILING HEAT TRANSFER ENHANCEMENT OF FC-72 OVER HEATED
COPPER SURFACE 30
4.1 Single-phase Natural Convection Heat Transfer 31 4.2 Saturated Pool Boiling on Bare Copper Surface 32
iv
4.3 Effect of Surface Aging on Bare Copper Plate 32 4.4 Effect of Moving Zirconia Particles on Boiling Heat
Transfer 32
4.5 Effects of Moving Silicon Nitride Particles on Boiling
Heat Transfer 36
4.6 Effects of Particle Material on Boiling Heat Transfer
Enhancement 37 4.7 Interactions between Particles and Boiling Flow 39 4.8 Proposed Correlation 41
CHAPTER 5 CONCLUDING REMARKS 111
v
LIST OF TABLES
Table 2.1 Thermophysical properties of FC-72 15 Table 2.2 Parameter of particle size and 𝑁𝑝 16
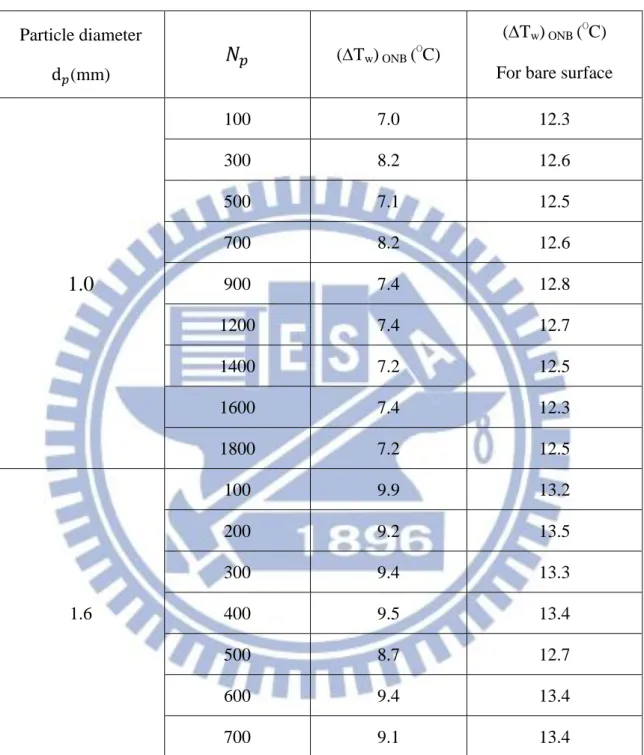
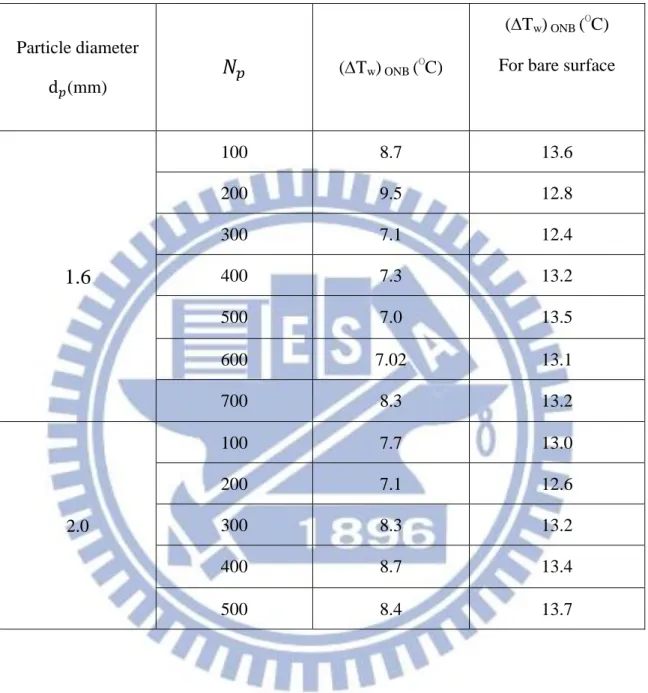
Table 3.1 Summary of the results from the uncertainty analysis. 27 Table 4.1 Wall superheats at onset of nucleate boiling
for copper particles.
43 Table 4.2 Wall superheats at onset of nucleate boiling
vi
LIST OF FIGURES
Experimental Apparatus
Fig. 2.1 Schematic diagram of the test apparatus. 17 Fig. 2.2 Schematic diagram of the test heater assembly (not to scale). 18 Fig. 2.3 Locations of three thermocouples in the copper block and one
thermocouple below the heater (not to scale).- 19
Fig. 2.4 Schematic diagram of placing strings on heating plate (not to
scale). 20
Fig. 2.4 Schematic diagram of placing movable particles on heating
surface with acryl rectangular enclosure (not to scale). 21
Data Reduction
Fig. 3.1 Schematic diagram of six main directions of the heat loss. 28 Fig. 3.2 Schematic diagram of T'5 and T'6. 29
Saturated Pool Boiling Heat Transfer
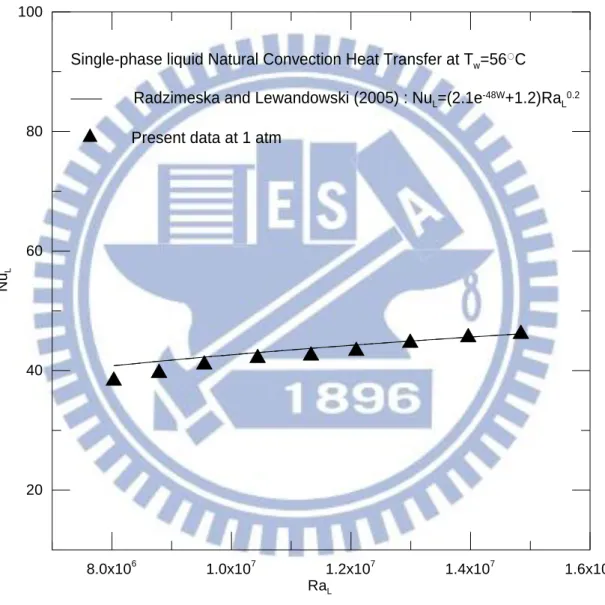
Fig. 4.1 Comparison of the present single-phase natural convection data with the empirical correlation of Radziemska and Lewandowski
(2005). 45
Fig. 4.2 Comparison of the present nucleate boiling heat transfer data on smooth plate with Rainy and You (2000). 46 Fig. 4.3 Effects of surface aging on saturated pool boiling curves
vii
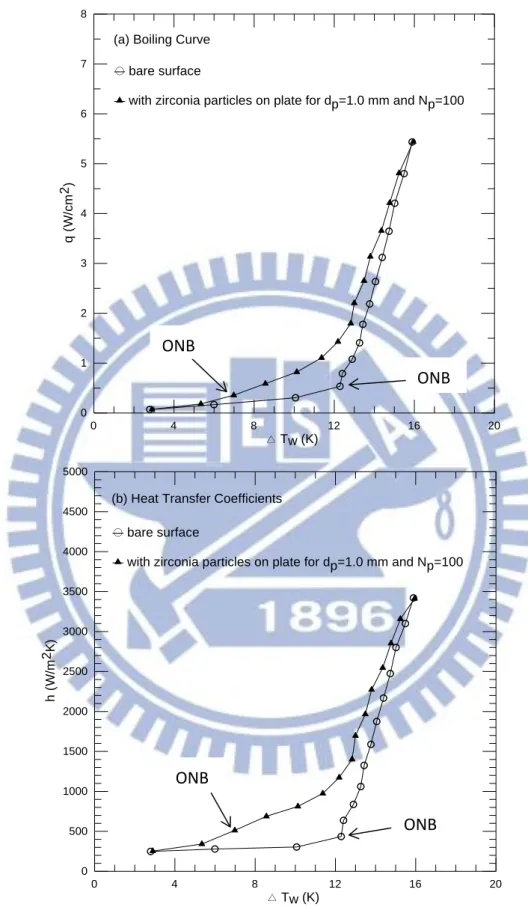
(a) and boiling heat transfer coefficients (b) forbare surface. 47 Fig. 4.4 Effects of zirconia particle diameter and number on saturated
pool boiling curves (a) and boiling heat transfer coefficients
(b) at d𝑝=1.0 mm and 𝑁𝑝 = 100 . 48 Fig. 4.5 Effects of zirconia particle diameter and number on saturated
pool boiling curves (a) and boiling heat transfer coefficients
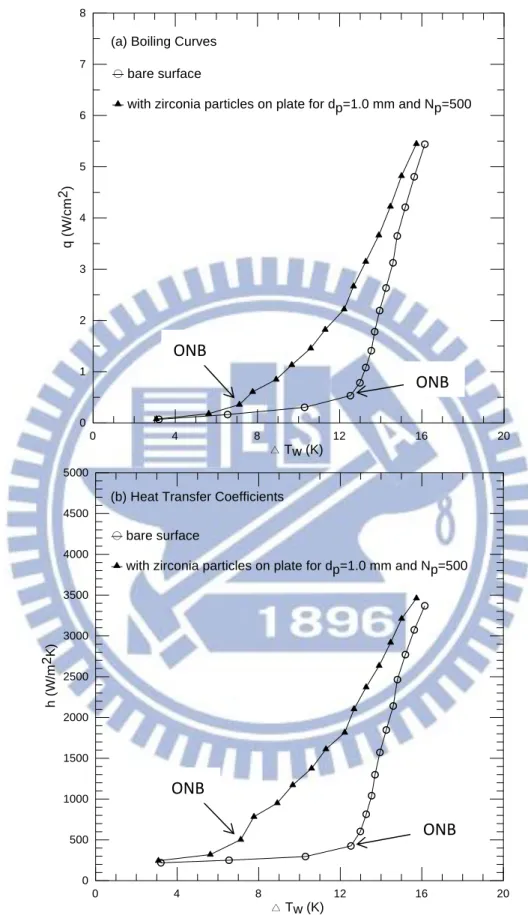
(b) at d𝑝=1.0 mm and 𝑁𝑝 = 300 . 49 Fig. 4.6 Effects of zirconia particle diameter and number on saturated
pool boiling curves (a) and boiling heat transfer coefficients
(b) at d𝑝=1.0 mm and 𝑁𝑝 = 500 . 50 Fig. 4.7 Effects of zirconia particle diameter and number on saturated
pool boiling curves (a) and boiling heat transfer coefficients
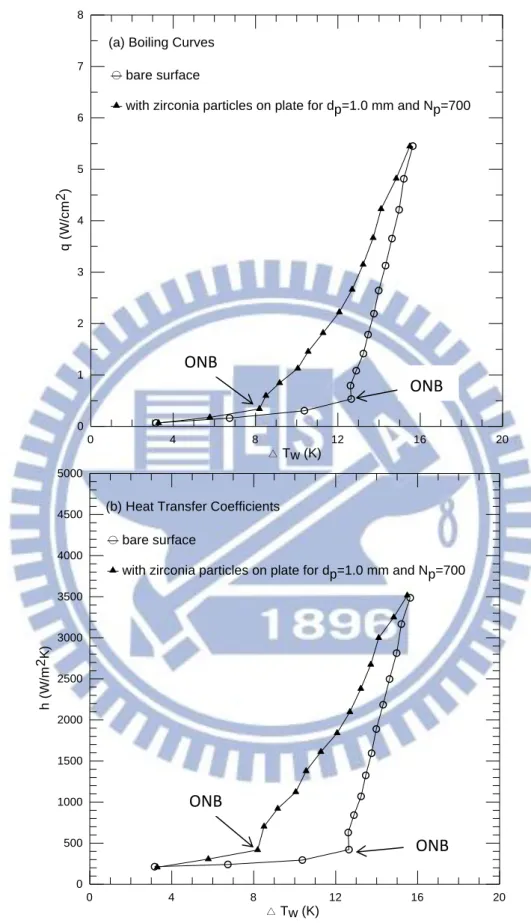
(b) at d𝑝=1.0 mm and 𝑁𝑝 = 700 . 51 Fig. 4.8 Effects of zirconia particle diameter and number on saturated
pool boiling curves (a) and boiling heat transfer coefficients
(b) at d𝑝=1.0 mm and 𝑁𝑝 = 900 . 52 Fig. 4.9 Effects of zirconia particle diameter and number on saturated
pool boiling curves (a) and boiling heat transfer coefficients
(b) at d𝑝=1.0 mm and 𝑁𝑝 = 1200 . 53 Fig. 4.10 Effects of zirconia particle diameter and number on saturated
pool boiling curves (a) and boiling heat transfer coefficients
(b) at d𝑝=1.0 mm and 𝑁𝑝 = 1400 . 54 Fig. 4.11 Effects of zirconia particle diameter and number on saturated
pool boiling curves (a) and boiling heat transfer coefficients
viii
Fig. 4.12 Effects of zirconia particle diameter and number on saturated pool boiling curves (a) and boiling heat transfer coefficients
(b) at d𝑝=1.0 mm and 𝑁𝑝 = 1800 . 56 Fig. 4.13 Variations of ℎ𝑝⁄ with wall superheat for various zirconia ℎ
particle numbers at d𝑝=1.0 mm (the middle area represent single phase for particles on heated plate and boiling for bare
surface) 57
Fig. 4.14 Effects of zirconia particle diameter and number on saturated pool boiling curves (a) and boiling heat transfer coefficients
(b) at d𝑝=1.6 mm and 𝑁𝑝 = 100 . 58 Fig. 4.15 Effects of zirconia particle diameter and number on saturated
pool boiling curves (a) and boiling heat transfer coefficients
(b) at d𝑝=1.6 mm and 𝑁𝑝 = 200 . 59
Fig. 4.16 Effects of zirconia particle diameter and number on saturated pool boiling curves (a) and boiling heat transfer coefficients
(b) at d𝑝=1.6 mm and 𝑁𝑝 = 300 . 60 Fig. 4.17 Effects of zirconia particle diameter and number on saturated
pool boiling curves (a) and boiling heat transfer coefficients
(b) at d𝑝=1.6 mm and 𝑁𝑝 = 400 . 61
Fig. 4.18 Effects of zirconia particle diameter and number on saturated pool boiling curves (a) and boiling heat transfer coefficients
(b) at d𝑝=1.6 mm and 𝑁𝑝 = 500 . 62 Fig. 4.19 Effects of zirconia particle diameter and number on saturated
pool boiling curves (a) and boiling heat transfer coefficients
ix
Fig. 4.20 Effects of zirconia particle diameter and number on saturated pool boiling curves (a) and boiling heat transfer coefficients
(b) at d𝑝=1.6 mm and 𝑁𝑝 = 700 . 64 Fig. 4.21 Variations of ℎ𝑝⁄ with wall superheat for various zirconia ℎ
particle numbers at d𝑝=1.6 mm (the middle area represent single phase for particles on heated plate and boiling for bare
surface) 65
Fig. 4.22 Effects of silicon nitride particle diameter and number on saturated pool boiling curves (a) and boiling heat transfer
coefficients (b) at d𝑝=1.6 mm and 𝑁𝑝= 100. 66 Fig. 4.23 Effects of silicon nitride particle diameter and number on
saturated pool boiling curves (a) and boiling heat transfer
coefficients (b) at d𝑝=1.6 mm and 𝑁𝑝= 200 . 67
Fig. 4.24 Effects of silicon nitride particle diameter and number on saturated pool boiling curves (a) and boiling heat transfer
coefficients (b) at d𝑝=1.6 mm and 𝑁𝑝= 300 . 68 Fig. 4.25 Effects of silicon nitride particle diameter and number on
saturated pool boiling curves (a) and boiling heat transfer
coefficients (b) at d𝑝=1.6 mm and 𝑁𝑝= 400 . 69
Fig. 4.26 Effects of silicon nitride particle diameter and number on saturated pool boiling curves (a) and boiling heat transfer
coefficients (b) at d𝑝=1.6 mm and 𝑁𝑝= 500 . 70 Fig. 4.27 Effects of silicon nitride particle diameter and number on
saturated pool boiling curves (a) and boiling heat transfer
x
Fig. 4.28 Effects of silicon nitride particle diameter and number on saturated pool boiling curves (a) and boiling heat transfer
coefficients (b) at d𝑝=1.6 mm and 𝑁𝑝= 700. 72 Fig. 4.29 Variations of ℎ𝑝⁄ with wall superheat for various silicon ℎ
nitride particle numbers at d𝑝=1.6 mm (the middle area represent single phase for particles on heated plate and boiling
for bare surface) 73
Fig. 4.30 Effects of silicon nitride particle diameter and number on saturated pool boiling curves (a) and boiling heat transfer
coefficients (b) at d𝑝=2.0 mm and 𝑁𝑝= 100 . 74 Fig. 4.31 Effects of silicon nitride particle diameter and number on
saturated pool boiling curves (a) and boiling heat transfer
coefficients (b) at d𝑝=2.0 mm and 𝑁𝑝= 200 . 75
Fig. 4.32 Effects of silicon nitride particle diameter and number on saturated pool boiling curves (a) and boiling heat transfer
coefficients (b) at d𝑝=2.0 mm and 𝑁𝑝= 300 . 76 Fig. 4.33 Effects of silicon nitride particle diameter and number on
saturated pool boiling curves (a) and boiling heat transfer
coefficients (b) at d𝑝=2.0 mm and 𝑁𝑝= 400 . 77
Fig. 4.34 Effects of silicon nitride particle diameter and number on saturated pool boiling curves (a) and boiling heat transfer
coefficients (b) at d𝑝=2.0 mm and 𝑁𝑝= 500 . 78 Fig. 4.35 Variations of ℎ𝑝⁄ with wall superheat for various silicon ℎ
nitride particle numbers at d𝑝=2.0 mm (the middle area represent single phase for particles on heated plate and boiling
xi
for bare surface) 79
Fig. 4.36 Effects of material of particle and number on boiling heat transfer coefficients (a) copper (b) zirconia at d𝑝=1.0 mm and
𝑁𝑝 = 300 . 80
Fig. 4.37 Effects of material of particle and number on boiling heat transfer coefficients (a) copper (b) zirconia at d𝑝=1.0 mm and
𝑁𝑝 = 500 . 81
Fig. 4.38 Effects of material of particle and number on boiling heat transfer coefficients (a) copper (b) zirconia at d𝑝=1.0 mm and
𝑁𝑝 = 700 . 82
Fig. 4.39 Effects of material of particle and number on boiling heat transfer coefficients (a) copper (b) zirconia at d𝑝=1.0 mm and
𝑁𝑝 = 900 . 83
Fig. 4.40 Variations of ℎ𝑝/ℎ with wall superheat for zirconia and copper
particles and number of particles at d𝑝=1.0 mm. (solid symbols
denote copper particles) 84
Fig. 4.41 Effects of material of particle and number on boiling heat transfer coefficients (a) copper, (b) stainless steel, (c) zirconia, and (d)
silicon nitride at d𝑝=1.5 & 1.6 mm and 𝑁𝑝 = 200 . 85
Fig. 4.42 Effects of material of particle and number on boiling heat transfer coefficients (a) copper, (b) stainless steel, (c) zirconia, and (d)
silicon nitride at d𝑝=1.5 & 1.6 mm and 𝑁𝑝 = 400 . 86 Fig. 4.43 Effects of material of particle and number on boiling heat transfer
coefficients (a) copper, (b) stainless steel, (c) zirconia, and (d)
xii
Fig. 4.44 Variations of ℎ𝑝/ℎ with wall superheat for zirconia, silicon
nitride, copper, and stainless steel particles for various 𝑁𝑝 at d𝑝=1.5 & 1.6 mm (solid symbols denote copper and
stainless steel particles) 88
Fig. 4.45 Photos taken from side view of boiling flow at selected time instants for q= 0.39 W/ m2 with zirconia particles on heated
surface at d𝑝=1.6 mm and 𝑁𝑝 = 250 89 Fig. 4.46 Photos taken from side view of boiling flow at selected time
instants for q= 0.61 W/ m2 with zirconia particles on heated
surface at d𝑝=1.6 mm and 𝑁𝑝 = 250 90 Fig. 4.47 Photos taken from side view of boiling flow at selected time
instants for q= 1.11 W/ m2 with zirconia particles on heated
surface at d𝑝=1.6 mm and 𝑁𝑝 = 250 91
Fig. 4.48 Photos taken from side view of boiling flow at selected time instants for q= 2.67 W/ m2 with zirconia particles on heated
surface at d𝑝=1.6 mm and 𝑁𝑝 = 250 92 Fig. 4.49 Photos taken from side view of boiling flow at selected time
instants for q= 5.42 W/ m2 with zirconia particles on heated
surface at d𝑝=1.6 mm and 𝑁𝑝 = 250 93
Fig. 4.50 Photos taken from side view of boiling flow at selected time instants for q= 0.22 W/ m2 with silicon nitride particles on heated surface at d𝑝=1.6 mm and 𝑁𝑝 = 250 94 Fig. 4.51 Photos taken from side view of boiling flow at selected time
instants for q= 0.39 W/ m2 with silicon nitride particles on heated surface at d𝑝=1.6 mm and 𝑁𝑝 = 250 95
xiii
Fig. 4.52 Photos taken from side view of boiling flow at selected time instants for q= 0.61 W/ m2 with silicon nitride particles on heated surface at d𝑝=1.6 mm and 𝑁𝑝 = 250 96 Fig. 4.53 Photos taken from side view of boiling flow at selected time
instants for q= 1.11 W/ m2 with silicon nitride particles on heated surface at d𝑝=1.6 mm and 𝑁𝑝 = 250 97 Fig. 4.54 Photos taken from side view of boiling flow at selected time
instants for q= 2.67 W/ m2 with silicon nitride particles on heated surface at d𝑝=1.6 mm and 𝑁𝑝 = 250 98
Fig. 4.55 Photos taken from side view of boiling flow at selected time instants for q= 5.42 W/ m2 with silicon nitride particles on heated surface at d𝑝=1.6 mm and 𝑁𝑝 = 250 99 Fig. 4.56 Photos taken from side view of boiling flow at selected time
instants for q= 0.22 W/ m2 with silicon nitride particles on
heated surface at d𝑝=2.0 mm and 𝑁𝑝 = 150 100
Fig. 4.57 Photos taken from side view of boiling flow at selected time instants for q= 0.39 W/ m2 with silicon nitride particles on
heated surface at d𝑝=2.0 mm and 𝑁𝑝 = 150 101 Fig. 4.58 Photos taken from side view of boiling flow at selected time
instants for q= 0.61 W/ m2 with silicon nitride particles on
heated surface at d𝑝=2.0 mm and 𝑁𝑝 = 150 102
Fig. 4.59 Photos taken from side view of boiling flow at selected time instants for q= 1.11W/ m2 with silicon nitride particles on
xiv
Fig. 4.60 Photos taken from side view of boiling flow at selected time instants for q= 2.67 W/ m2 with silicon nitride particles on heated surface at d𝑝=2.0 mm and 𝑁𝑝 = 150
104
Fig. 4.61 Photos taken from side view of boiling flow at selected time instants for q= 5.42 W/ m2 with silicon nitride particles on
heated surface at d𝑝=2.0 mm and 𝑁𝑝 = 150 105 Fig. 4.62 Schematic illustration of zirconia particles-bubble interactions in
boiling flow on heated surface at (a) low flux (b) medium flux (c)
high flux (∆t ≈ 0.01 sec.) 106
Fig. 4.63 Schematic illustration of silicon nitride particles-bubble
interactions in boiling flow on heated surface at (a) low flux (b) medium flux (c) high flux (∆t ≈ 0.01 sec.) 107 Fig. 4.64 Schematic illustration of retarding bubble growth and departure
by zirconia particles at high heat flux. 108 Fig. 4.65 Schematic illustration of particles-bubble interactions in single
phase on heated surface at (a) zirconia (b) silicon nitride
(∆t ≈ 0.01 sec.) 109
Fig. 4.66 Boundaries for boiling heat transfer augmentation and retardation for zirconia and silicon nitride particles with different
xiii
NOMENCLATURE
A area, mm2 cp specific heat, J/kg∙ dp diameters of particles, mm Np numbers of particlesNpf maximum particle number forming a single particle layer
h heat transfer coefficient, W/m2∙K
I measured current from DC power supply, A V measured voltage from DC power supply, V k thermal conductivity, W/m∙K L characteristic length, m NuL Nusselt number, k hL NuL P system pressure, kPa
Q heat transfer rate, W
qn net wall heat flux, W/cm2 Ra Rayleigh number T temperature, C t time, sec W plate width, cm Greek Symbols kinematic viscosity, m2/ s 𝜌𝑧𝑟𝑜2 zirconia density (𝜌𝑐𝑢=5948), kg/m3 liquid density, kg/m3 𝜌𝑝 particle density, kg/m3
𝜌𝑆𝑖3𝑁4 silicon nitride density (𝜌𝑠𝑠=3324), kg/m3 absolute viscosity, kg/m∙s
coefficient of expansion, /
surface tension, N/m
the distance between the thermalcouple tips and the upper surface of the copper plate, m
∆𝑇𝑤 wall superheat, K
xiv
g gravity, 𝑚 𝑠⁄ 2
α Thermal diffusion coefficient, m2
/ s 𝑖𝑙𝑣 Latent heat, kJ/kg
Subscripts Cu copper t total
1
CHAPTER 1
INTRODUCTION
1.1 Motive of the Present Study
Recent significant technological advances in the electronics industry have led to a rapid miniaturization of integrated circuits.Consequently, the power dissipation density in various micro processors increases substantially during their normal operation. How to effectively remove the large amount of dissipating heat from the processors poses a great challenge to heat transfer research community. In order to transfer the large quantity of the dissipating heat from the chips with an ultra high microelectronic component density, highly efficient heat transfer methods are required to control their temperatures at allowable level. Although air cooling has been used commonly today over a long period of time, this method has reached its upper performance limit and is unable to solve the cooling problems encountered in the current electronics industry [1]. Therefore, cooling techniques have to be improved and heat transfer systems with better efficiency have to be used. Cooling based on liquid convection and liquid-vapor phase-change heat transfer have been considered. Among these, boiling heat transfer is regarded as one of the most effective methods in electronics cooling comparing with the methods based on single-phase heat transfer because of the exchange of latent heat is involved in the boiling processes. Methods to further improve the boiling heat transfer are therefore of great interest.
Over the past decades a number of passive boiling heat transfer enhancement methods have been proposed by modifying geometrical structure of the heated surface such as adding certain micro-structures, pin fins and grooves to the surfaces. Significant pool boiling heat transfer enhancement can be obtained. Besides, coating the surfaces with particles and covering the surfaces with screens have been known to be effective. These enhancement
2
methods are based on various forms of extended surface fixed firmly onto the surfaces or directly fabricated on the surfaces. Moreover, some active boiling heat transfer enhancement methods such as vibrating and rotating working fluids and/or heated surface by external forces were suggested. These methods are very effective. But they are not welcome because the need to use external force. In the present study, enhancement of FC-72 pool boiling heat transfer by placing a large number of movable small solid particles above a heating plate will be explored. The particles can be moved violently by the vigorous motion of the bubbly flow in the pool boiling on one end. On the other end, the violently moving particles can increase the bubble departing rate from the heated surface and the turbulence level of the boiling flow. These mutual interactions of the particles and bubbly flow can be beneficial in promoting the boiling heat transfer from the heated surface. However, the presence of a large number of the particles can impede the bubble departure from the heated surface and liquid inrush to the surface. This in turn will retard the boiling heat transfer. In the present investigation we intend to delineate the ranges of experimental parameters over which boiling heat transfer can be enhanced by the moving particles.
The working fluid FC-72 is a dielectric fluorocarbon liquid manufactured by the 3M Company and gains popularity in electronics cooling application. It not only has suitable phase-change temperature for thermal control of I.C. components but also owns the quality that does not foul the boiling surface. Importantly, FC-72 has less impact on our environment than alternative liquids like chlorofluorocarbons or organic liquids. Copper has properties of better thermal conductivity than most metals and is often considered to be suitable for heat dissipating elements. Thus the heat transfer enhancement characteristics of pool boiling of the dielectric liquid on a copper plate by placing movable solid particles above the heated surface immersed in FC-72 liquid are explored in the present study. In an earlier study [2] Wei in our laboratory obtained significant enhancement in pool boiling heat transfer of saturated FC-72 over a horizontal heated copper plate by placing copper and stainless steel (metallic) particles
3
on the plate when the, size and number of particles are suitably chosen for low and medium wall superheats. In this study we move further to investigate the possibility of enhancing saturated pool boiling heat transfer of FC-72 by the movable zirconia and silicon nitride (ceramic) particles. These ceramic particles are much lighter than the metallic particles tested by Wei [2]. Besides, the ceramic material has low thermal conductivity.
1.2 Literature Review
In what follows the literature relevant to the present study is briefly reviewed. Pool boiling heat transfer is a process of vigorous heat transfer resulting from latent heat exchange associated with liquid-to-vapor phase change in a quiescent liquid. Nukiyama [3] conducted a pioneering pool boiling experiment in 1934 and arranged the experimental heat transfer data as a form of the wall superheat versus the heat flux, which is known as the “boiling curve” today. After that, the pool boiling heat transfer research has received considerable attention.
The state of the art cooling technologies for handling heat dissipation in microelectronic equipments have been developed extensively over the past 30 years. Several products were released including Air-Cooled Modules, High Thermal Conduction Modules, and Liquid-Cooled Modules, as discussed by Bar-Cohen [4].
In an early attempt to improve pool boiling heat transfer by using a micro-configured surface, Miller et al. [5] found that vapor retention could be a function of the scale and geometry of the micro-configurations.They pointed out that the relation between the stability of the potential nucleation sites and the micro-configuration size and geometry required further investigation, so that the size and the site density of the cavities could be optimized for boiling heat transfer enhancement.
Slightly later a few studies have been carried out to examine the influences of the surface fabricated microstructures on the pool boiling heat transfer. These include boiling of FC-72 on micro-porous surfaces with particle coating tested by Chang and You [6] and by Vemuri and
4
Kim[7], adding micro-porous pin-fins and in the meantime coating particles to the surface investigated by Rainey and You [8,9], and fabricating micro-pin-fins and submicron-scale roughness on the surfaces by Honda et al. [10] and Wei et al. [11]. The study of Rainey and You [8, 9] concluded that the microporous coating can significantly enhance the boiling heat transfer performance over the pin-finned surfaces. In examining the pool boiling on the micro-pin-fin surfaces, Honda et al. [10] and Wei et al. [11] noted that the boiling curves were characterized by a very small increase in the wall superheat could cause a large increase in the heat flux. And increasing the fin height was found to provide better heat transfer in the nucleate boiling regime and result in a higher critical heat flux. Nucleation site interaction in pool boiling on an artificial surface was investigated by Zhang and Shoji [12] and by Yu et al. [13]. The hydrodynamic interaction can be also influenced by some factors, such as the liquid properties, subcooling, system pressure. The study of Yu et al. [13] concluded that the critical heat flux was dependent on the cavity density. The evaporation/boiling heat transfer regimes in the capillary wicking structures were identified and discussed by Li et al.[14] and Li and Peterson[15]. Anderson and Mudawar [16] reported that microstructures in the forms of fins, studs, grooves and vapor-trapping cavities on the boiling surface significantly shifted the boiling curve toward lower superheats while increasing the incipience excursion. Their results also suggest that the maximum boiling heat flux is a function of surface geometry and orientation but independent of the initial conditions, surface roughness, or the presence of large artificial cavities. Intending to augment boiling heat transfer, O’Connor and You [17] painted silver flakes on the boiling surface. Their experimental data show that the incipience boiling superheats are 70-85% lower and the nucleate boiling superheats are 70-80% lower than the bare surface. Besides, the critical heat flux is increased by 109%. O’Connor et al. [18] then compared two methods of generating surface microstructures, “spraying” and “painting”, for pool boiling heat transfer enhancement. They noted that the incipient boiling superheat showed 33-55% reduction for the sprayed alumina and 63-85% reduction for the painted
5
diamond. The enhancement in the critical heat flux can be up to 47% for the sprayed alumina and 103% for the painted diamond microstructures. Chang and You [19] further studied the effects of coating different sizes of the diamond particles on the pool boiling heat transfer performances. They classified the coating thickness into two groups. For coatings thinner than 100 μm, increasing the coating thickness would generate a higher active nucleation density. But for coatings thicker than 100 μm, a further increase in the coating thickness does not always enhance the pool boiling heat transfer. They attributed this result to higher impedance for liquid-vapor exchange channels and higher thermal resistance for the thicker coating. Jung and Kwak [20] investigated the effects of submicron-scale roughness on the subcooled boiling heat transfer over a boiling surface anodized in DMF (dimethylforamide) and HF (hydrofluoric acid). Both surface treatments were found to increase the effective boiling area and served for increasing the nucleation sites and hence showed considerable enhancement in the boiling heat transfer. The critical heat flux also increases linearly. Honda and Wei [21] reviewed recent advances in enhancing boiling heat transfer from electronic components immersed in dielectric liquids through the use of surface microstructures and concluded that most of the surface microstructures were effective in decreasing the wall superheat at the boiling incipience. The nucleate boiling heat transfer also can be improved and the critical heat flux is raised. Rainey and You [22] and Rainey et al. [23] respectively studied the effects of the orientation and pressure on the pool boiling heat transfer from microporous surface. Their data show that nucleate boiling performance increases slightly for the surface inclined from 0(horizontal) to 45 and then decreases for the inclination angle ranging from 90 to 180. Moreover, for the plain and microporous surfaces increases in boiling performance and critical heat flux and decrease in the incipience wall superheat were noted as the pressure increased.
Chou et al. [24] arranged several grooved patterns on surfaces intending to enhance boiling heat transfer of distilled water. Their experimental data reveal that the radial grooved pattern has the best enhanced boiling heat transfer performance and the spiral or concentric
6
grooved pattern has poorer boiling heat transfer coefficient. The worst performance is noted for the grid or the spotted grooved pattern. All grooved patterns they investigated have better heat transfer performance than the plain surface and the denser groove is better than the sparser one for the same patterns.
Hasegawa et al. [25] covered a heat pipe with a woven screen to investigate the associated boiling characteristics and burnout phenomena. Their results disclose that the additional screen produces two opposite effects of inhibiting and enhancing the boiling heat transfer. Tsay et al. [26] explored pool boiling heat transfer enhancement by covering the boiling surface with a screen in distilled water. They found that the screen coverage could raise bubble generation frequency and enhance the boiling heat transfer. But the screen can also cover some nucleation sites and hence may retard the boiling heat transfer. They also noted that the boiling heat transfer became poorer at lowering the liquid level. They concluded that covering the heated surface with a screen could augment the pool boiling heat transfer if the mesh size was comparable with the bubble departure diameter. In boiling of methanol and HFE-7100, Liu et al. [27] pointed out that placing a fine mesh layer on the boiling surface enhanced nucleate boiling heat transfer at low wall superheat (∆T𝑠𝑎𝑡<10K) but an opposite trend resulted at a high superheat (∆T𝑠𝑎𝑡>10K). They also reported that the heat transfer in
nucleate boiling always became worse with a coarse mesh on the boiling surface when compared with that on a smooth surface. Moreover, Franco et al. [28] used dielectric refrigerant R141b to investigate enhancement in the boiling heat transfer performance by covering the heated surface with wire meshes. The boiling heat transfer coefficient was noted to increase significantly, especially at relatively low heat fluxes. They also found that the wire mesh coverage on the heating surface resulted in slower transition to steady film boiling. In studying the effects of the wall superheat and the mesh layer covering on boiling heat transfer, Kurihara and Myers [29] tested several working fluids including water, acetone, n-hexane, carbon tetrachloride, and carbon disulfide. They found that active nucleation sites on the
7
heating plate increased due to the mesh covering and the boiling heat transfer coefficient was proportional to the one-third power of the bubble column numbers at high numbers.
Shi et al. [30] investigated pool boiling heat transfer in liquid saturated particle bed and fluidized bed of distilled water. The tests were conducted for glass beads, steel ball, find sand and 𝐴𝑙2𝑂3 particles. They showed that boiling heat transfer could be enhanced greatly by adding the solid particles into the liquid whether in the fixed or fluidized particle bed. The boiling heat transfer enhancement is closely related to the particle size (𝑑𝑝=0.5, 1.0 and 2.0
mm), initial bed depth (𝐻𝑝=3.0, 6.5, 9.5 and 13.4 mm) and heat flux applied. The best heat transfer enhancement is 120% for the particle diameter 𝑑𝑝=1.0 mm and bed height 𝐻𝑝=9.5
mm. A similar study was conducted by Matijevic et al. [31] using lead spheres to cover a heating surface. The spheres were packed as closely as possible into a single layer. They noted that boiling heat transfer from the heating surface to water could be enhanced substantially by the metallic spheres (d=3.0, 3.5, 3.6, 4.0 and 4.5 mm), and the smaller spheres resulted in a better enhancement of boiling heat transfer.
Heat transfer enhancement by employing nanofluids has become very popular recently. In nanofluids a very large number of nano particles (diameters smaller than 100 nm) are added into a working fluid which is considered to significantly increase thermal conductivity of the fluid. Wen and Ding [32] reported an enhancement of boiling heat transfer coefficient for about 40% with alumina water based nanofluids. On the other hand, by using the same nanoparticles in the same fluid, Bang and Chang [33] found that the boiling heat transfer coefficient deteriorated for about 20% when the nanoparticles are added.
Some active techniques to enhance boiling heat transfer were also proposed in the literature. Jeong and Kwon [34] found that the CHF augmentation in pool boiling of water due to ultrasonic vibration was closely related to its effects on the process of bubble generation and its departure. They noted that the rate of increase in CHF for downward facing surface ranged from 87~126% as the water subcooling varied from 5 to 40℃. Cipriani et al. [35] imposed
8
electric field on pool boiling of FC-72 over a heated platinum wire (d=0.1 and 0.2 mm)and found that the boiling heat transfer was strongly influenced by the presence of the electric field at a low wire superheat. An increase of the boiling heat transfer coefficient up to 400% was encountered with the maximum applied voltage. But it is almost unaffected by electrical force at high wire superheat. Through heated surface vibration, Navruzov et al. [36] demonstrated that boiling heat transfer of ethanol could be substantially enhanced at low imposed heat flux. The amplitude of the surface vibration is found to be a governing parameter for heat transfer enhancement at low-frequency vibrations. Besides, the vibration of the heat transfer surface significantly alters the heat transfer process both in subcooled boiling and in free convection. The single-phase heat transfer curves are 70-80% above the basic curve at increasing heat loads.
1.3 Objective of Present Study
The above literature review clearly reveals that considerable works have been carried out in the past to investigate the enhancement in the pool boiling heat transfer over a surface by passive methods through fabricating surface microstructures such as roughness and micro-pin-fins and by covering the surface with mesh screens and particle coating. All these microstructures are fixed firmly onto the boiling surface. Besides, some effective active heat transfer augmentation methods such as vibrating or rotating heating surface and/or fluid and applying electric field to vibrate a heating surface have been suggested. In an earlier experimental study, Wei [2] from our laboratory showed that placing small copper and stainless steel particles on a heated plate could result in a great increase in the FC-72 pool boiling heat transfer over the plate at low and medium wall superheats. But at high wall superheat the boiling heat transfer is impeded by the presence of the metallic particles on the plate to a certain degree. In this continuing study, we intend to explore the possibility of enhancing the pool boiling heat transfer of FC-72 over a wider range of the wall superheat by placing much lighter ceramic particles on the plate. Besides, we expect the retarding boiling
9
heat transfer at high wall superheat can be improved by placing the ceramic particles. We emphasize that the method proposed here is passive in nature. However, it behaves like an active heat transfer enhancement method.
10
CHAPTER 2
EXPERIMENTAL APPARATUS AND PROCEDURES
A schematic arrangement of the experimental apparatus for the present investigation of the pool boiling heat transfer enhancement by movable ceramic particles driven by the boiling flow is similar to that employed in the previous study [2] and is shown in Fig. 2.1. The experimental system includes a main test chamber, a test heater assembly, and other auxiliary parts such as a D.C. power supply, a data acquisition unit and a high-speed photographic unit. The working fluid, FC-72, is a highly wetting dielectric fluorocarbon liquid produced by 3M Industrial Chemical Products Division, which has been considered as a good candidate fluid for liquid immersion cooling applications. It is chemically stable, dielectric, and has a relatively low boiling point (Tsat=56C at atmospheric pressure). Some thermophysical properties of FC-72 are given in Table 2.1.
2.1 Main Test Chamber
The main test chamber is a hermetic stainless steel pressure vessel of 205 mm in height and 216 mm in diameter. An internal water condenser is installed inside the chamber and connects with a thermostat (LAUDA RK20) to maintain the bulk temperature of the working fluid in the chamber at the preset level. The maximum cooling power of the thermostat is 180W (at 20C). We further use an external temperature controller (FENWAL MYSPEC Digital Temperature Controller) to control the bulk temperature of FC-72 liquid in the test chamber with an accuracy of
0.1C. Besides, a cartridge heater is located near the bottom of the test chamber to provide additional heating during the degassing process. In order to prevent the heat
11
loss from the vessel to the ambient, a superlon layer of 10-mm thick is wrapped around the chamber. Moreover, a pressure transducer with an operating range of 0-200 kPa is located at the gate valve to measure the pressure of the work fluid. Meanwhile, the working fluid temperature is measured by two resistance temperature detectors (RTDs) located at the gate valve and at a selected location 5 cm above the bottom surface of the chamber with a calibrated accuracy of 0.1C. An auxiliary tank of 10-liter liquid FC-72 is placed right above the test vessel and it is only used for subcooled pool boiling experiment to prevent regassing of the working fluid after degassing. A pressure transducer and a RTD are placed in the auxiliary tank to measure the internal gas pressure and liquid temperature. In addition, a test heater assembly is mounted to a stainless steel shelf to fix the PEEK (Polyether Ether Ketone) substrate. The working fluid is maintained at approximately 80 mm above the heated surface in the experiment.
2.2 Test Heater Assembly
A schematic of the test heater assembly is shown in Fig. 2.2. The assembly consists mainly of a film heater and it is adhered to the lower surface of a square copper plate by epoxy Omegabond 200. The plate is 10-mm thick with 30x30 𝑚𝑚2 in surface area. The heater supplies the required power input to the copper plate. The copper plate is flush mounted onto a much larger PEEK block. Liquid FC-72 boils on the upper surface of the copper plate. More specifically, the copper plate is heated by D.C. current delivered from a D.C. power supply to the film heater. Besides, three calibrated copper-constantan thermocouples (T-type) with a calibrated accuracy of 0.2C are installed at selected locations in the copper plate right below the boiling surface. They are used for the control and determination of the boiling surface
12
temperature. The detailed locations of the thermocouples installed in the copper plate are shown in Fig. 2.3. Note that the whole copper plate is inserted into a PEEK block which serves as a heat insulator (kT 0.25W/mK), intending to reduce the heat loss from the lateral and bottom surfaces of the plate to the ambient. Besides, the locations of thermocouples in the PEEK block are shown in Fig. 2.4.
2.3 Confinement of Particles and Experimental Parameters
Solid particles made from the same material and of uniform size are placed freely on the upper surface of the copper plate, as schematically shown in Fig. 2.5. In order to insure that the particles would not be blown away by the vigorous motion of the bubbles, we install an acryl fence of 2-cm high and 1-cm thick around the edges of the heating copper plate. In the present study tests will be conducted for zirconia and silicon nitride particles. The densities of zirconia and silicon nitride are measured before the experiment with 𝜌𝑍𝑟𝑂2 = 5948 𝑘𝑔 𝑚⁄ 3 and 𝜌𝑆𝑖3𝑁4 = 3325 𝑘𝑔 𝑚⁄ 3. These two sorts of ceramic particles are chosen here because the zirconia and silicon nitride have higher densities than liquid FC-72. But they are lighter than the copper and stainless steel particles tested by Wei [2]. Besides, the chosen particles should not be too small so that they float in the liquid above the plate and do not contact the heating surface. Moreover, they should not be too large and cannot be moved by the boiling flow. Here, the particle diameter is selected to be 1.0 and 1.6 mm for the zirconia particles, and 1.6 and 2.0 mm for silicon nitride particles. The chosen particle size and number for the cases tested here are summarized in Table 2.2. The measured data expressed in terms of boiling curves and boiling heat transfer coefficients will be compared with that of a bare heating surface.
13
2.4 DC Power Supply
The power generated in the film heater in the test heater assembly is provided by a programmable D.C. power supply (Gpc 3030D). It offers a maximum D.C. power of 180W for an output voltage of 60V and an output current of 3A. The power input to the copper block is transmitted through a GPIB interface to a personal computer. In order to measure the D.C. current, a precision ammeter (KYORITSU A.C./D.C. DIGITAL CLAMP METER) is arranged in series connection with the electric circuit. Besides, a YOKOGAWA data recorder is used to measure the voltage drop across the test heater assembly. All the voltage, current and power measurement devices are calibrated by a YOKOGAWA WT200 power meter according to the Center of Measurement Standards in Industrial Technology Research Institute of Taiwan.
2.5 Data Acquisition
A 20-channel YOKOGAWA data recorder (MX-100) combined with a personal computer is used to acquire and process the data from various transducers. All signals detected from the T-type thermocouples, RTDs, pressure transducer, ammeter, data recorders and power meter are all collected and converted by the internal calibration equations in the computer during the data acquisition.
2.6 Optical Measurement Technique
A high-speed camera along with a microscope is installed in front of the observation window to observe the boiling activity in the flow. The photographic apparatus consists mainly of a high speed digital video camera (IDT High-speed CMOS Camera), a micro-lens (Optem Zoom 16), and a three-dimensional positioning
14
mechanism. The high-speed motion analyzer can take photographs up to 143,307 frames/sec. In the present experiment the recording rate is 1000 frames/sec. After the experimental system reaches a statistical state, we start capturing the images of the particles and bubbles in the boiling flow. Besides, we store and display the images in the personal computer through an image-capturing software.
2.7 Experimental Procedures
The boiling surface is polished by fine sand paper (Number 3000, 2000 and 1000) and cleaned by ethyl alcohol before each experimental run. In each test, we place the chosen ceramic particles on the heated plate. Besides, we remove non-condensable gases existing in the empty test chamber by running a vacuum pump for about 15 minutes and then fill the FC-72 liquid into the chamber until the liquid level is higher than the heating plate for about 8 cm. Next, the FC-72 liquid in the test chamber is heated to the saturation state which is detected and maintained by a digital temperature controller. Moreover, the FC-72 liquid is boiled vigorously for 1 hour to further remove the dissolved non-condensable gases in it. After the working fluid pressure and temperature stabilize to one atmosphere and at the saturation state, we turn on the test heater. The imposed heat flux on the boiling surface is adjusted by controlling the electric current delivered to the heater from the D.C. power supply. Upon reaching the statistical state, we begin collecting the required heat transfer data and visualizing the boiling activity. Effects of the particle material, size and number density on the possible heat transfer enhancement are investigated in the experiment.
15
Table 2.1 Thermophysical properties of FC-72.
Properties at 25C FC-72
Appearance Clear, colorless
Average Molecular Weight 338
Boiling Point (1atm) 56C
Pour Point (1atm) -90C
Estimated Critical Temperature 449K Estimated Critical Pressure 1.83 × 10⁶ Pa
Vapor Pressure 3.09 × 10⁴ Pa Latent Heat of Vaporization hfg
(at normal boiling point)
88 J/g
Liquid Density 1680 kg/m3
Absolute Viscosity 6.4× 10⁻³ poises ; 6.4× 10⁻⁴ kg/m∙s Kinematic Viscosity 3.8 × 10⁻³ stokes ; 3.8 × 10⁻⁷ m2/ s Liquid Specific Heat cp 1100 J/kg∙C
Liquid Thermal Conductivity k 0.057 W/m∙C Coefficient of Expansion 0.00156 /C
16
Table 2.2 Cases covered in present study
Particles 𝑁𝑝 Particles 𝑁𝑝 Zirconia (d𝑝=1.0 mm) 100 Silicon nitride (d𝑝=1.6 mm) 100 300 200 500 300 700 400 900 500 1200 600 1400 700 1600 1800 Zirconia (d𝑝=1.6 mm) 100 Silicon nitride (d𝑝=2.0 mm) 100 200 200 300 300 400 400 500 500 600 700
17
Fig. 2.1 Schematic diagram of the test apparatus.
Liquid Level
P
Condenser Coil
Observation Window
To Degassing Tank and Drain
Computer GPIB MX100 Data Acquisition Heater Boiling Surface FC-72 Digital Temperature Controller Shelf RTD Condenser Test Heater Assembly Observation Window Electric Cord Signal Cord Programmable D.C. Power Supply Liquid Level
P
Condenser Coil Observation WindowTo Degassing Tank and Drain
Computer GPIB MX100 Data Acquisition Heater Boiling Surface FC-72 Digital Temperature Controller Shelf RTD Condenser Test Heater Assembly Test Heater Assembly Observation Window Electric Cord Signal Cord Programmable D.C. Power Supply
18
Fig. 2.2 Schematic diagram of the test heater assembly (not to scale).
30
30 7
100
Embedded Copper Plate
Electric Film Heater
Perspective view
Front view
Top view
PEEK substrate
PEEK substrate(unit:mm)
19
Fig. 2.3 Locations of three thermocouples in the copper plate and one thermocouple below the heater (not to scale).
Front view
Top view
(unit:mm)
Perspective view
#3,5 #3 #3 #1,8 #1,8 #1 #4 #2 #5 #2,4 #8 #5 #4 #2 1 5 5 30 3020
Fig. 2.4 Locations of two thermocouples in the PEEK block (not to scale).
(unit:mm)
Perspective view
PEEK
substrate
#7 #6Front view
3.5 #6 #7 12Top view
Copper Surface
#7 #6Copper Plate
Copper Plate
3121
Fig. 2.5 Schematic diagram showing movable particles on heating surface with acryl rectangular enclosure (not to scale).
Perspective view
Top view
PEEK substrate PEEK Surface(unit:mm)
Right view
22
CHAPTER 3
DATA REDUCTION
3.1 Boiling Heat Transfer Coefficient
The space-average natural convection and boiling heat transfer coefficients over the upper surface of the heated square copper plate when the flow is at a statistical state are both defined as
h = 𝑞𝑛
∆𝑇𝑤
⁄ (3.1) where qn is the net heat flux imposed on the upper surface andΔTw is the wall superheat defined as the difference between the average heated surface temperature and the saturated temperature of FC-72. The average heated surface temperature 𝑇𝑤 is estimated from the measured average temperature from the thermocouples installed at different locations near the upper surface of the copper plate according to the steady-state one-dimensional conduction heat transfer. Specifically,
Cu n Cu w k δ q T T (3.2) where
TCu = the average measured temperature from the thermocouples (C) kCu = the thermal conductivity of copper (W/m∙K)
= the vertical distance between the thermocouple tips and the upper surface of the copper plate (m)
The total power input Qt to the copper plate can be obtained from the measured voltage drop across the film heater in the test heater assembly and the current passing through it,
23 V
I
Qt (3.3) where
Qt = total power input to the upper surface of the copper plate (W) I = electric current passing through the film heater (Amp.)
V = voltage drop across the film heater (Volts)
The substrate of the test section is made from PEEK, which have a much lower thermal conductivity (kT 0.25W/mK) than the copper (k386W/mK). In evaluating total heat loss from the heater assembly, we focus on heat transfer from the heater and copper plate surface to the PEEK. Figures 2.3 and 2.4 are the schematic diagrams of the thermocouples buried in the copper plate and PEEK block. The heat dissipation model used to estimate the heat loss is shown in Fig. 3.1, and the total heat loss can be estimated as follows:
Q
loss= k
p∙
(T8−T7) L1∙ A
1+ 4 ∙ k
p∙
(TCu−T6) L2∙ A
2+
2π∙kp∙L3∙(TCu−T6) ln( r6 rCu,2)+
2π∙kp∙L4∙(TCu−T6) ln( r6 rCu,3)+k
p∙
(TCu−T′5) L5∙ A
5+k
p∙
(TCu−T′6) L6∙ A
6 whereT6 , T7 , T8 : the average measured temperatures at the measured locations inside the PEEK insulator, as schematically shown in Figs. 2.3 & 2.4
𝐿 1, 𝐿2 , 𝐿 3 , 𝐿 4 , 𝐿 5 , 𝐿 6: shortest distances between locations No.1~No.6 and the
film heater or copper plate (m)
A1 , A2, A3, A4, A5, A6 : bottom and lateral surface areas of the copper plate
T'5 , T'6 : these two temperatures are calculated by using interpolation method based on 𝑇6, as schematically shown in Fig. 3.2
24
Finally, the net imposed input heat flux to the upper surface of copper plate can be evaluated from the relation
Cu loss t n A Q Q q (3.5)
where ACu is the area of the upper surface of the copper plate.
3.2 Uncertainty Analysis
An uncertainty analysis is carried out here to estimate the uncertainty levels in the experiment. Kline and McClintock [37] proposed a formula for evaluating the uncertainty in the result F as a function of independent variables, X1, X2, X3∙∙∙∙∙∙∙∙∙∙∙∙Xn,
F=F (X1 ,X2, X3∙∙∙∙∙∙∙∙∙∙∙∙Xn) (3.6) The absolute uncertainty of F is expressed as
2 1 2 2 3 3 2 2 2 2 1 1 n n X X F X X F X X F X X F F (3.7)
and the relative uncertainty of F is
2 1 2 2 3 3 3 2 2 2 2 2 1 1 1 n n n X X nX nF X X nX nF X X nX nF X X nX nF F F (3.8) If F X1aX2bX3c... , then the relative uncertainty is
2 1 2 3 3 2 2 2 2 1 1 X X c X X b X X a F F (3.9) where i X F
and Xi are, respectively, the sensitivity coefficient and uncertainty level associated with the variableX . The values of the uncertainty intervalsi Xi are
25
obtained by a root-mean-square combination of the precision uncertainty of the instruments and the unsteadiness uncertainty, as recommended by Moffat [38]. The choice of the variableX to be included in the calculation of the total uncertainty i
level of the result F depends on the purpose of the analysis.
The uncertainties of the parameters in the present study are calculated as follows: (1) Uncertainty of temperature difference, Tw=Tw-Tsat
2 1 2 2 2 1 2 2 2 1 2 2 ) ( ) ( sat w sat sat w w sat sat sat w sat w w sat w w sat sat sat sat w w w w sat w sat w sat w T T T T T T T T T T T T T T T T T T nT T T n T T nT T T n T T T T (3.10) (2) Uncertainty of total power input, QtV I Qt (3.3) and 2 1 2 2 V V I I Q Q t t (3.11)
(3) Uncertainty of net wall heat flux, 𝑞𝑛
Cu loss t n A Q Q q (3.5) and
26 2 1 2 2 2 2 1 2 2 2 2 1 2 2 2 1 loss t loss loss t t Cu Cu loss loss loss t loss t t loss t t Cu Cu loss loss loss n t t t n Cu Cu Cu n n n Q Q Q Q Q Q A A Q Q Q Q Q Q Q Q Q Q A A Q Q nQ nq Q Q nQ nq A A nA nq q q (3.12) Where
Q
loss= k
p∙
(T8−T7) L1∙ A
1+ 4 ∙ k
p∙
(TCu−T6) L2∙ A
2+
2π∙kp∙L3∙(TCu−T6) ln( r6 rCu,2)+
2π∙kp∙L4∙(TCu−T6) ln( r6 rCu,3)+k
p∙
(TCu−T′5) L5∙ A
5+k
p∙
(TCu−T′6) L6∙ A
6 (3.4) (4) Uncertainty of space-average heat transfer coefficient, hsat n T q h Δ (3.1) and
2 1 2 2 2 1 2 2 2 1 2 2 1 1 sat w sat w n n sat w sat w n n sat w sat w sat w n n n T T T T q q T T T T q q T T T T T T n nh q q nq nh h h A summary of the results from the present uncertainty analysis is given in Table 3.1.