Improved Separation of Microheterogeneities and
Isoforms of Proteins by Capillary Electrophoresis
Using Segmental Filling with SDS and PEO in the
Background Electrolyte
Wei-Lung Tseng, Yang-Wei Lin, and Huan-Tsung Chang* Department of Chemistry, National Taiwan University, Taipei, Taiwan
To improve the separation efficiency while achieving high sensitivity for the analysis of proteins’ microheterogeneity, a segmental-filling technique has been developed and tested in capillary electrophoresis with laser-induced native fluorescence using a pulsed Nd:YAG laser. Using a short plug of SDS applied to the capillary and the anticonvectant poly(ethylene oxide) (PEO), the microhet-erogeneities of a number of proteins with pI values ranging from 4.5 to 11.1 could be detected. This high resolving power is due to reduced adsorption on the capillary wall, sieving, and the interaction with SDS. Consequently, the length and the concentration of the SDS plug play a significant role in determining the resolution and sensitiv-ity. The method has been applied to the analysis of salivary and cerebrospinal fluid (CSF) samples. Without any sample pretreatment, using a 10-s 1× SDS plug, six r-amylase isoforms in a salivary sample were resolved in 17 min and three more peaks were detected in a CSF sample. With simplicity, high resolving power, and rapid-ity, the method has shown great potential for proteomics.
Proteomics focuses on large-scale identification and quantifica-tion of proteins, as well as their localizaquantifica-tion, modificaquantifica-tions, interactions, activities, and ultimately their function.1,2To date, two-dimensional gel electrophoresis (2-D GE) in conjunction with mass spectrometry, which together provide high resolving power and extreme sensitivity, is the most popular tool for proteomics.3,4 However, the techniques developed so far involve tedious pro-cesses for staining, destaining, and spot excision and low dynamic ranges in sensitivity. A more serious problem is that the separation of trace proteins from those with high copy numbers, of hydro-philic proteins from highly hydrophobic ones (mostly membrane proteins), or of small proteins from extremely large ones. Analysis
of proteins is further complicated by microheterogeneity, whereas its analysis is important in order to understand proteins functions and to gain more insight for drug designs.
Because of its ease of automation, high-resolving power, and high speed, capillary electrophoresis (CE) has been commonly used for the analysis of proteins and has proven potential for proteomics.5-12 Several approaches have been developed and tested, including for example, capillary electrophoresis isoelectric focusing (CIEF) for separating hemogloblin variants in the single human erythrocytes13and micellar electrokinetic chromatography (MEKC) for determining the amount of five isoforms of the monoclonal chimeric antibody BR96.14Techniques based on heat-induced denaturation of proteins have also been employed for the analysis of isoenzymes.15,16Owing to a small injection volume and a short optical length, CE is often used in conjunction with mass spectrometry17,18or laser-induced fluorescence (LIF)12,13,19-28to achieve high sensitivity. There are two general approaches to detecting proteins by CE-LIF: (1) intrinsic fluorescence of proteins containing tryptophan, tyrosine, or phenylalanine by UV lasers;19-22 and (2) extrinsic fluorescence of protein derivatives (fluorophores) with relatively low-cost lasers, such as argon-ion laser and
He-* To whom correspondence should be addressed. Tel and Fax: 011-886-2-2362-1963. E-mail: [email protected].
(1) James, P. Biochem. Biophy. Res. Commun. 1997, 231, 1-6.
(2) Velculescu, V. E.; Zhang, L.; Vogelstein, B.; Kinzler, K. W. Science 1995, 270, 484-487.
(3) Marshall T.; Williams, K. M. Anal. Chim. Acta 1998, 372, 147-160. (4) Tonella, L.; Walsh, B. J.; Sanchez, J.-C.; Ou, K.; Wilkins, M. R.; Tyler, M.;
Frutiger, S.; Gooley, A. A.; Pescaru, I.; Appel, R. D.; Yan, J. X.; Bairoch, A.; Hoogland, C.; Morch, F. S.; Hughes, G. J.; Williams, K. L.; Hochstrasser, D. F. Electrophoresis 1998, 19, 1960-1971.
(5) Liang, H.; Wang, Y.; Wang, Q.; Ruan, M.-S. J. Chromatogr. B 1999, 724, 381-388.
(6) Kubo, K. Anal. Biochem. 1996, 241, 42-46.
(7) Huang, T.-L.; Richards, M. J. Chromatogr. A 1997, 757, 247-253. (8) Recio, I.; Pe´rez-Rodrı´guez M.-L.; Ramos, M.; Amigo, L. J. Chromatogr. A
1997, 768, 47-56.
(9) Sjo¨dahl, J.; Emmer, Å.; Karlstam, B.; Vincent, J.; Roeraade, J. J. Chromatogr. B1998, 705, 231-241.
(10) Tong, W.; Link, A.; Eng, J. K.; Yates, J. R., III. Anal. Chem. 1999, 71, 2270-2278.
(11) Manabe, T.; Oota, H.; Mukai, J. Electrophoresis 1998, 19, 2308-2316. (12) Lillard, S. J.; Yeung, E. S. J. Chromatogr. B 1996, 687, 363-369. (13) Yeung, E. S. J. Chromatogr. A 1999, 830, 243-262.
(14) Kats, M.; Richberg, P. C.; Hughes, D. E. Anal. Chem. 1997, 69, 338-343. (15) Rochu, D.; Georges, C.; Repiton, J.; Viguie, N.; Saliou, B.; Bon, C.; Masson,
P. Biochim. Biophys. Acta 2001, 1545, 216-226.
(16) Rochu, D.; Pernet, T.; Renault, F.; Bon, C.; Masson, P. J. Chromatogr. A 2001, 910, 347-357.
(17) Cao, P.; Moini, M. J. Am. Soc. Mass Spectrom. 1998, 9, 1081-1088. (18) Wei, J.; Yang, L.; Harrata, A. K.; Lee, C. S. Electrophoresis 1998, 19,
2356-2360.
(19) Chang, H.-T.; Yeung, E. S. Anal. Chem. 1995, 67, 1079-1083. (20) Chan, K. C.; Muschik, G. M.; Issaq, H. J. Electrophoresis 2000, 21,
2062-2066.
(21) Tong, W.; Yeung, E. S. J. Chromatogr. B 1996, 685, 35-40. (22) Zhang, X.; Sweedler, J. V. Anal. Chem. 2001, 73, 5620-5624. Anal. Chem.2002,74,4828-4834
4828 Analytical Chemistry, Vol. 74, No. 18, September 15, 2002 10.1021/ac020140m CCC: $22.00 © 2002 American Chemical Society
Downloaded by NATIONAL TAIWAN UNIV on July 30, 2009
Ne laser.23-28Some problems associated with labeling of proteins include the formation of byproducts, high background from fluorogenic reagents, and loss of biological activity. To overcome the loss of efficiency due to labeling, 5-furoylquinoline-3-carbox-aldehyde with submicellar concentrations of sodium dodecyl sulfate (SDS) or sodium pentasulfate has proven useful.26-28The use of submicellar concentrations of SDS also offers the advantage of low background because the quantum yield of most derivatizing agents increases in micelles.29,30On the other hand, SDS can cause denaturation of proteins, thereby decreasing intrinsic fluorescence. The quantum yields of proteins may also decrease due to Joule heating with increasing SDS concentrations. Another problem is that the fluorescence background increases with increasing concentrations of SDS. We have found that the fluorescence background is∼10 times higher and that sensitivity dramatically decreases in the presence of 1% SDS in the background electrolyte, compared with that of 10-4% SDS (data not shown), probably because SDS quenches the intrinsic fluorescence of tryptophan.31 Thus, an effort must be made to minimize the impact of SDS on sensitivity in the analysis of proteins.
On the other hand, adding an anionic surfactant to the background electrolytes is common for optimizing resolution and speed in the analysis of proteins (the increased negative charge raising the electrophoretic mobility of proteins).14,26-28,32-34It has been shown that the binding characteristics of SDS to proteins depends on its concentration, implying that the physical and chemical properties of protein complexes should relate to the ratio of SDS to proteins.35There are four distinct binding regions in the binding isotherm of SDS onto proteins: (a) At low SDS concentrations, there exists some binding to specific high-energy sites on the protein; (b) Beyond region a, there is either a plateau or a slow rising part of the isotherm; (c) In this region, there is a massive increase in the binding isotherm because of cooperative interactions, wherein the unfolding of the protein is believed to occur; and (d) There is no further SDS binding onto the protein, and the normal micelle formation occurs as excess surfactant is added. Overall, the binding saturation is expected to occur in the range of∼1.5-2 g of surfactants/1 g of proteins.35On the basis of the binding isotherm, SDS concentration should play some role in determining efficiency on the analysis of proteins by CE. Moreover, adding anionic surfactants into background electrolytes is useful to further minimize protein adsorption on the capillary wall, mainly by decreasing in Coulombic interactions.14, 26-28, 32-33
The primary purpose of this work was to develop a technique that would allow the analysis of proteins by taking advantage of adding SDS to background electrolytes to improve efficiency while minimizing the reduction in fluorescence intensity when using a Nd:YAG laser at 266 nm as the light source. To achieve this goal, we developed a segmental filling technique that is similar to that proposed for improving efficiency, concentration, or sensitivity in the analysis of small solutes by MEKC.36-41 Band broadening caused by mismatched conductivities inside the capillary needs to be considered, but applying external pressure has proven useful to partially overcome this problem.42However, we have found that band broadening can be minimized when the analysis is conducted in poly(ethylene oxide) (PEO) solution. In the presence of PEO, we have also found that SDS stacked at the moving boundary and interacted with proteins, leads to improvement in efficiency.
EXPERIMENTAL SECTION
Apparatus. The basic design of the separation system has
been previously described.43Briefly, a high-voltage power supply (Gamma High Voltage Research Inc., Ormond Beach, FL) was used to drive electrophoresis. The entire detection system was enclosed in a black box with a voltage interlock. The high-voltage end of the separation system was housed in a plexiglass box for safety. A pulsed Nd:YAG (model EPO-5000 from Con-tinuum, Santa Clara, CA) laser at 266 nm, 3000 HZ output, and a UG1 filter (Barrington, Edmund, NJ) were used to induce intrinsic fluorescence. When Nile red was used to explore the stacking of the SDS plug, a 1.5 mW He-Ne laser with 543-nm output from Melles Griot (Irvine, CA) was used for excitation with a 590-nm interference filter to block the scattered light. In both cases, the emitted light was collected with a 10× objective (numerical aperture ) 0.25) before reaching the photomultiplier tube (R928 from Hamamatsu, Shizuoka-Ken, Japan). The amplified current was transferred directly through a 10 kΩ resistor to a 24-bit A/D interface at 5 Hz (Borwin, JMBS Developments, Le Fontanil, France), and the data was stored in a personal computer. Fused-silica capillaries (Polymicro Technologies, Phoenix, AZ) with
75-µm i.d. and 365-75-µm o.d., without any coating process, were used
for protein separations. To elucidate the effects of SDS on separation efficiency, a commercial electrophoresis instrument from Bio-Rad (BioFocus CE 2000, Hercules, CA) was used.
Chemicals. SDS, proteins, and all chemicals for preparing
buffers were obtained from Sigma (St Louis, MO), except for PEO (Mw4 000 000), which was from Aldrich (Milwaukee, WI), and Nile red, which was from Molecule Probe (Eugene, OR). TB buffers prepared from tris(hydroxymethyl) aminomethane (Tris) were adjusted with boric acid to either pH 10.0 or 9.0. In this manuscript, the molarity of the TB buffer refers to that of Tris. A 10 mM stock solution of Nile red was prepared in dimethyl sulfoxide. The concentration of the 1× stock solution of SDS was greater than its critical micelle concentration (CMC), which is (23) Harvey, M. P.; Bandilla, D.; Banks, P. R. Electrophoresis 1998, 19,
2169-2174.
(24) Banks, P. R. Trends in Anal. Chem. 1998, 17, 612-622. (25) Hunt, G.; Nashabeh, W. Anal. Chem. 1999, 71, 2390-2397.
(26) Pinto, D. M.; Arriaga, E. A.; Craig, D.; Angelova, J.; Sharma, N.; Ahmadzadeh, H.; Dovichi, N. J.; Boulet, C. A. Anal. Chem. 1997, 69, 3015-3021. (27) Lee, I. H.; Pinto, D.; Arriaga, E. A.; Zhang, Z.; Dovichi, N. J. Anal. Chem.
1998, 70, 4546-4548.
(28) Zhang, Z.; Krylov, S.; Arriaga, E. A.; Polakowski, R.; Dovichi, N. J. Anal. Chem.2000, 72, 318-322.
(29) Jin L. J.; Giordano, B. C.; Landers, J. P. Anal. Chem. 2001, 73, 4994-4999. (30) Csapo, Z.; Gerstner, A.; Sasvari-Szekely, M.; Guttman, A. Anal. Chem. 2000,
72, 2519-2525.
(31) Gelamo, E. L.; Tabak, M. Spectrochim. Acta, Part A 2000, 56, 2255-2271. (32) Strege, M. A.; Lagu, A. L. Anal. Biochem. 1993, 210, 402-410. (33) Kats, M.; Richberg, P. C.; Hughes, D. E. Anal. Chem. 1995, 67,
2943-2948.
(34) Reynolds, J. A.; Herbert, S.; Polet, H.; Steinhardt, J. Biochemistry 1967, 6, 937-947.
(35) Turro, N. J.; Lei, X. G. Langmuir 1995, 11, 2525-2533.
(36) Nelson, W. M.; Lee, C. S. Anal. Chem. 1996, 68, 3265-3269.
(37) Muijselaar, P. G.; Otsuka, K.; Terabe, S. J. Chromatogr. A 1998, 802, 3-15. (38) Chankvetadze, B. Trends Anal. Chem. 1999, 18, 485-498.
(39) Amini, A.; Wiersma, B.; Westerlund, D.; Paulsen-So¨rman, U. Eur. J. Pharm. Sci.1999, 9, 17-24.
(40) Palmer, J.; Munro, N. J.; Landers, J. P. Anal. Chem. 1999, 71, 1679-1687. (41) Quirino, J. P.; Terabe, S.; Bocek, P. Anal. Chem. 2000, 72, 1934-1940. (42) Michalke, D.; Kolb, S.; Welsch, T. J. Chromatogr. A 2001, 916, 113-122. (43) Tseng, W.-L.; Chang, H.-T. Anal. Chem. 2000, 72, 4805-4811.
Downloaded by NATIONAL TAIWAN UNIV on July 30, 2009
0.23%. The solution that contains SDS injected to improve efficiency was called plug solution (PS). Lysozyme (LYS), trypsin inhibitor (TI), β-casein (β-CAS), ovalbumin (OVA), bovine serum albumin (BSA), conalbumin (CON), β-galactosidase (β-GAL), catalase (CAT), transferrin, and R-amylase were prepared in water and stored at 4°C. Salivary samples were collected from a normal male, and cerebrospinal fluid (CSF) samples were obtained from the Mackay Mermorial Hospital (Taipei, Taiwan). Prior to analysis, the CSF sample was stored at -80 °C. The samples were separated without any pretreatment.
Polymer Solutions. Increasing amounts of PEO were
gradu-ally added to the above buffers, in a water bath at 85 to 90°C with constant stirring to produce a homogeneous suspension. After adding PEO, the solution was stirred for another hour. PEO solutions were degassed with a vacuum system in an ultrasonic tank. Polymer solutions stored in a refrigerator at 4°C were usable for 4 days.
Treatment of Capillaries and Separation. Capillaries were
treated with 0.5 M NaOH overnight prior to use. Between runs, capillaries were washed with 0.5 M NaOH at 1.0 kV for 10 min to remove polymer solutions and refresh the capillary wall. This method has proven useful for achieving reproducible EOF, with relative standard deviation (RSD) values of 1-3% in the analysis of proteins and DNA, depending on the buffer used.43-46
The SDS solution was hydrodynamically injected into a capillary filled with 1.5 M TB, pH 10, for various times prior to injection of Nile Red or proteins at 30-cm height for 10 s. The end of the capillary was then immersed in PEO solution. During the analysis, PEO solution in the anodic reservoir entered the capillary by EOF.
RESULTS AND DISCUSSION
Effect of SDS and PEO. Although adding SDS to background
electrolytes has been shown to improve the efficiency of protein separation in CE,14,26-28,32,33its impact on detection sensitivity using laser-induced native fluorescence (LINF) has not been carefully studied. Our experiences in CE-LINF (unpublished results) have demonstrated that protein analysis using buffers containing more than 10-4% SDS was not successful with LINF because of quenching, mainly due to denaturation of proteins and Joule
heating. To optimize sensitivity and efficiency, we tested the possibility of applying a short plug of SDS. Upon interacting with SDS monomers or micelles, the mobility of protein complexes toward the anode should increase; however, band broadening occurred, leading to loss of resolution, which is common when applying a segmental filling technique. To overcome this problem, we conducted separations using higher concentrations of PEO solutions, the PEO entering the capillary from the anode by EOF after sample injection. As expected, band broadening is not serious in 1.0-2.0% PEO prepared in 0.4 M TB, pH 9.0, when applying a 1× SDS plug at 30-cm height for 180 s prior to protein injection. With increasing PEO concentrations, EOF and the separation window (BSA and β-casein) decreased. This is likely to be attributable to poor sieving and significant adsorption of PEO onto the capillary wall. In terms of resolution and speed, we inferred that 1.7% PEO is optimal.
To further explore the impact of an SDS plug on the separation of the test proteins shown in Table 1, we injected various concentrations of SDS (0-1×) at 30-cm height for different periods of time (0-300 s). In the presence of an SDS plug, PEO adsorption onto the capillary wall was reduced, leading to a slightly higher EOF. For example, the bulk EOF mobility values were 2.02 and 2.09× 10⁻⁴cm2V-1s-1in the absence and presence, respectively, of a 1× SDS plug applied at 30-cm height for 10 s. Table 1 shows that despite ovalbumin and trypsin inhibitor, the efficiency did improve by applying a short plug of SDS. The results also clearly indicate that a longer plug of lower concentrations of SDS is needed for separating microheterogeneous proteins. For example, to completely resolve the 4 peaks corresponding to β-casein, the injection times for 0.2× and 0.1× SDS were 60 and 140 s, respectively, a longer interaction time likely being required for a more dilute solution. It is also possible that the viscosity of PEO causes a decrease in the electrophoretic mobility of SDS, allowing it to stack and, thus, form micelles before interacting with proteins. In this respect, a longer plug of less concentrated SDS is required for forming micelles (see later discussion). It is interesting to note that, compared to the literature results, there were more peaks detected for lysozyme and β-casein under some conditions in this study. These peaks may represent microheterogenity or may be due to hydrolysis byproducts. Because the separations were not conducted near the pI of proteins, except for lysozyme (shown in Table 2), improvement in efficiency is unlikely to be attributable to isoelectric focusing.
(44) Chen, H.-S.; Chang, H.-T. Anal. Chem. 1999, 71, 2033-2036.
(45) Huang, M.-F.; Hsu, C.-E.; Tseng, W.-L.; Lin, Y.-C.; Chang, H.-T. Electrophoresis 2001, 22, 2281-2290.
(46) Tseng, W.-L.; Chang, H.-T. Electrophoresis 2001, 22, 763-776.
Table 1. Effect of the Length and Concentration of SDS Plug on the Resolution of the Microheterogeneity of Proteins
peak number
SDS (×) plug (sec) S. P. (min)a CAT LYS β-GAL TI CON BSA β-CAS OVA
0 0 10.82 1 1 1 1 1 5 1 10 10.67 1 3 3 1 2 2 1 1 0.5 20 10.75 1 2 3 1 2 1 3 1 0.2 60 10.98 1 2 3 1 2 1 4 1 0.1 140 11.13 1 2 2 1 2 1 4 1 0.05 300 11.10 2 2 2 1 1 3 4 1 literature 2b 2c 1d 1e 3f 5g 4h 13i
aSystem peak.bRef 47.cRef 48.dRef 49.eRef 50.fRef 7.gRef 6.hRef 8.iRef 51.
Downloaded by NATIONAL TAIWAN UNIV on July 30, 2009
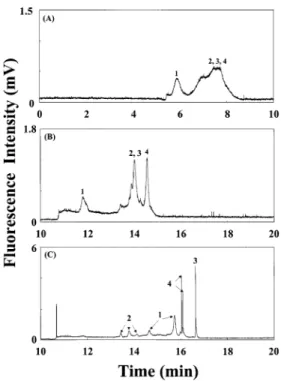
The main factors affecting the separation efficiency of CE include adsorption onto the silica surface, intrinsic microhetero-geneity, and other factors, such as sample injection, axial diffusion, thermal effect, and electrophoretic dispersion.53To compare the effect of an SDS plug and PEO on efficiency, we divided the proteins shown in Table 2 into two groups on the basis of their molecular weights. Group I included those with molecular weight less than 24 kDa (lysoenzyme, trypsin inhibitor, and β-casein), which have been shown to form a complex with a single SDS micelle.54The electropherograms depicted in Figure 1A-C show the impact of SDS on the separation. Comparing the peak profiles in Figure 1A and B, we concluded that the decreases in diffusion and protein adsorption, mainly due to dynamic adsorption of PEO on the capillary wall, are the two main reasons for sharper peak profiles in the presence of PEO.53Under this separation condition, the lysozyme with its positive charges (pI 11.1) migrated in the same direction as that of the EOF and, thus, did not enter the PEO solution and should be detected earlier. The fact that lysozyme was not detected indicated that interactions with the capillary wall took place. In the presence of the SDS plug, on the other hand (Figure 1C), three peaks corresponding to lysozyme, as well as two peaks for the other two proteins, were detected. With small sizes (<2 nm), the proteins could partition between the aqueous phase and SDS micelles that usually have a constant diameter (5.7 nm). The reversed migration order for trypsin inhibitor and casein also indicated that SDS interacted with these proteins. In addition, the increases in the electrophoretic mobility, peak heights, and plate numbers listed in Table 3 show evidence of the impact of an SDS plug. The electrophoretic mobility of trypsin inhibitor (the most hydrophobic protein) changed only slightly in the presence of the SDS plug, suggesting that it did not strongly interact with SDS. This is likely because of its negative charge and larger diameter as well as its globular form. Judging
by the dramatic change in the electrophoretic mobility of β-casein (fibrous), we believe that its interaction with SDS is greater than that of trypsin inhibitor. Because SDS micelles cause significant quenching, the increase in the fluorescence intensity of β-casein suggests that proteins may no longer be attached to SDS micelles by the time they reach the detection window. Comparing the peak number for each protein with literature results shown in Table 1, we concluded that the many sharp peaks in the profiles in the presence of the SDS plug may also be attributable to the resolution of microheterogeneity of proteins.
The rest of the proteins shown in Table 2 belong to group II, which form multimicellar SDS-protein complexes that have center-to-center intermicellar distances in the range of 7-12.0 nm.54To explore the impact of SDS and PEO on the separation of this group, we performed the analysis under the conditions (47) Pedrosa, M. M.; Reyes, A.; Vicente, C.; Legaz, M. E. J. Chromatogr. A 1995,
571, 571-578.
(48) Bergmann, J.; Jaehde, U.; Mazereeuw, M.; Tjaden, U. R.; Schunack, W. J. Chromatogr. A1996, 741, 381-389.
(49) Yao, S.; Anex, D. S.; Caldwell, W. B.; Arnold, D. W.; Smith, K. B.; Schultz, P. G. Proc. Natl. Acad. Sci. U.S.A. 1999, 96, 5372-5377.
(50) Kleindienst, G.; Huber, C. G.; Gjerde, D. T.; Yengoyan, L.; Bonn, G. K. Electrophoresis1998, 19, 262-269.
(51) Legaz, M. E.; Pedrosa, M. M. J. Chromatogr. A 1996, 719, 159-170. (52) Handbook of Biochemistry and Molecular Biology, Fasman, G. D., Ed.; CRC
Press: Boca Raton, FL, 1967.
(53) Stastna, M.; Radko, S. P.; Chrambach, A. Electrophoresis 2001, 22, 66-70. (54) Samso´, M.; Daban, J.-R.; Hansen, S.; Jones, G. R. Eur. J. Biochem. 1995,
232, 818-824.
Figure 1. Comparison of the separations of small proteins (Mw<
30 kDa) under three different conditions at 15 kV using a 50-cm capillary filled with 1.5 M TB buffer, pH 10.0. The effective length was 40 cm. Buffer vials contained 0.4 M TB buffers, pH 9.0, in (A), and 1.7% PEO in (B) and (C). A plug of 1×SDS solution was applied at 30-cm height for 10 s prior to sample injection in (C). Protein concentrations were 5µM. Peak identities: 1, lysozyme; 2, trypsin inhibitor; 3,β-casein.
Table 2. Chemical and Physical Properties of Proteins
proteins (source) MW pI Ra(nm) native conformation hydrophobic parameterb
ribnuclease A (bovine pancreas) 13 700 9.5 1.58 globular 780
lysozyme (chicken egg white) 14 200 11.1 1.59 globular 890
trypsin inhibitor (soybean) 21 000 4.5 1.81 globular 1150
β-casein (bovine milk) 23 500 5.1 1.88 fibrous NFc
ovalbumin (chicken egg) 45 000 4.7 2.34 globular 980
bovine serum albumin (bovine plasma) 66 000 4.7 2.66 globular 1000
conalbumin (chicken) 77 000 6.6 2.80 globular 980
β-galactosidase (Escherichia coli) 116 250 4.6 3.21 globular 970
catalase (bovine liver) 250 000 5.4 4.05 globular 1100
aSpherical radius, calculated by assuming that all the proteins are spherically shaped. The radii of these proteins were calculated from their
volumes using r ) (3V/4π)1/3.bRef 52.cNot found.
Downloaded by NATIONAL TAIWAN UNIV on July 30, 2009
shown in Figure 1. Figure 2A shows that the peaks were broad and that the last three proteins were not resolved in the absence of PEO. Although Figure 2B shows sharper peak profiles,
β-galactosidase and ovalbumin were not completely separated.
With a greater molecular weight, BSA was detected later than ovalbumin in the presence of PEO, indicating that the electro-phoretic mobility is sensitive to solvent.55Again, in the presence of the SDS plug, efficiency improved, and the migration order changed, as shown also in Table 3. From a slight change in the electrophoretic mobility of β-galactosidase, we concluded that it has the weakest interactions with SDS among the four proteins. A weak interaction is in agreement with its hydrophilic mobility
and explains why the migration order between conalbumin and
β-galactosidase reversed in the presence of SDS plug. BSA is more
strongly hydrophobic and, thus, interacts more strongly with SDS, leading to a reversed order between ovalbumin and BSA in the presence of the SDS plug, which suggests that BSA complexes were retarded strongly by PEO matrixes. This may be because of its greater size (2.66 nm) and possible changes in the hydrodynamic volume of proteins; 30% increases in the random coil of the folded globular protein in the presence of SDS have been demonstrated.56 Importantly, the peaks corresponding to BSA and ovalbumin (Figure 2C) are much sharper than that in Figure 2B. This again shows that the interaction with the capillary wall is dramatically suppressed in the presence of SDS. The data shown in Table 3 also suggest the possibility of separating hydrophobic proteins, such as membrane proteins, using this simple method. Although the microheterogeneity of OVA (with its nine different oligosaccharide chains) was not completely revealed by this method,51the sharp peak profile obtained in the presence of PEO and SDS plug indicates the potential of this method for the analysis of glycoproteins.
Separation Performance. To demonstrate the separation
performance of this simple technique, we separated the proteins shown in Table 2, with Mwranging from 14.2 to 250 kDa, by applying 1× SDS for 10 s, 0.2× SDS for 60 s, and 0.05× SDS for 300 s (only the SDS concentration of 1× is above its CMC). The electropherograms shown in Figure 3A-C clearly show efficient separation of all proteins in 18 min. To the best of our knowledge, this is the first example of a method allowing separation of the microheterogeneity of proteins with such a wide range in Mwand pI (4.5-11.1). The results demonstrate its potential for proteomics, for which hundreds of thousands of proteins need to be analyzed.3 In addition, it is almost impossible to achieve a similar result by capillary isoelectric focusing, because it allows a high resolution for proteins only at pH values near their pI values.7The advantages of this method over conventional methods include simplicity, ease of automation, and cost-effectiveness. When looking carefully at the three electropherograms, some differences were found. First, the peak corresponding to catalase (250 kDa) became broad and finally split into two peaks as SDS concentration decreased. (55) Douglas, N. G.; Humffray, A. A.; Pratt, H. R. C.; Stevens, G. W. Chem. Eng.
Sci.1995, 50, 743-754.
(56) Hollecker, M.; Creighton, T. E. Biochim. Biophys. Acta 1982, 701, 395-404.
Figure 2. Comparison of the separation of large proteins (Mw>30
kDa) under the same three different conditions as in Figure 1. Peak identities: 1, conalbumin; 2,β-galactosidase; 3, ovalbumin; 4, bovine serum albumin. Other conditions were as in Figure 1.
Table 3. Comparison of EOF, Electrophoretic Mobility (µep), Peak Height, and Efficiency for Proteins under Three Different Conditions
TB PEO PEO + 1× SDS plug
µeo× 10-4 (cm2V-1s-1) 4.05 2.02 2.09 µep× 10-5 (cm2V-1s-1) peak height (mV) plate number (×103) µep× 10 -5 (cm2V-1s-1) peak height (mV) plate number (×103) µep× 10 -5 (cm2V-1s-1) peak height (mV) plate number (×103) β-CAS 5.70 66 1.6 2.85 139 23.3 7.85 1590 164.0 TI 9.40 199 1.2 5.37 659 59.9 4.97 880 56.3 LYS NDa NDa NDa NDa NDa NDa 4.02b 569b 194.9b CON 3.47 259 1.1 1.79 292 11.2 6.50b 1221b 35.1b ×89-GAL 9.42 NDa NDa 4.71 NDa NDa 4.54b 287b 74.7b OVA 9.42 NDa NDa 4.71 NDa NDa 7.26 4568b 149.1 BSA 11.22 NDa NDa 5.28 1009 13.4 6.78b 3632b 364.6b
aNot determined because the peak was not detected.bThe major peak.
Downloaded by NATIONAL TAIWAN UNIV on July 30, 2009
Second, the peaks corresponding to conalbumin became broader with decreasing the concentration of SDS. Third, the resolution of BSA and β-casein increased with decreasing SDS concentration. Last, the migration order for some peaks changed. On the basis of these results, we suspected that the concentrations of SDS inside the capillary were changing. It has been shown that SDS micelles form inside the capillary as a result of stacking of SDS monomers.40,41To determine whether SDS micelles formed inside the capillary, we performed the analysis with buffer electrolytes containing Nile red (neutral dye) using a He-Ne laser. The fluorescence intensity of Nile red increased dramatically when dissolved in SDS micelles, making it a good fluorophore for our purpose.57 Figure 4 shows that SDS micelles did form when injecting 0.2× SDS for longer than 100 s, and 0.1× SDS for longer than 330 s (the correlated injection volumes are∼0.067, 0.133, and 0.439 µL, respectively). Unlike conventional methods,40,41in this study, SDS stacking was mainly due to decreases in the electrophoretic mobility when migrating in a viscous PEO solu-tion.43A slight increase in fluorescence when applying a shorter plug of SDS with its concentration below CMC is mainly due to increases in the quantum yield of Nile red in PEO, interaction with SDS monomer (less interaction with the capillary wall), or both.
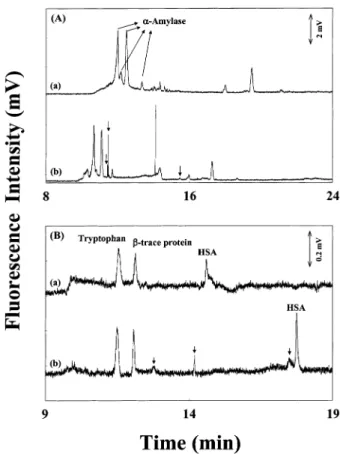
Analysis of Saliva and CSF. With improvements in sensitivity
and efficiency, this simple method has shown its potential for the analysis of biological sample. To demonstrate this potential, we analyzed a salivary sample from a normal male and a CSF sample from an abnormal neonate with and without a 10-s 1× SDS plug. Figure 5A shows four peaks, and six peaks were resolved corresponding to R-amylase without and with an SDS plug, respectively. These peaks were identified by the addition of standards, and the result was in good agreement with a report that in human saliva, there are six isoforms of R-amylase (Mw) 55-56 kDa), with pI values 7.3, 6.8, 6.7, 6.5, 6.4, and 6.3.58 Relatively slight changes in the electrophoretic mobility of (57) Daban, J.-R.; Samso´, M.; Bartolome´, S. Anal. Biochem. 1991, 199,
162-168.
Figure 3. Effect of SDS plug on the separations of proteins in the presence of EOF. SDS plugs in (A), (B), and (C) were at concentra-tions of 1×, 0.2×, and 0.05×as well as conducted at 30-cm height for 10, 60, and 300 s, respectively. Peak identities: 1, catalase; 2, lysozyme; 3,β-galactosidase; 4, trypsin inhibitor; 5, conalbumin; 6, BSA; 7,β-casein; 8, ovalbumin. Protein concentrations were 5µM. Other conditions were as in Figure 1C.
Figure 4. Fluorescence intensities of Nile red vs injection time of SDS solutions with the concentrations ranging from 0.05 to 1×. The concentration of Nile red was 1µM. Other conditions were as in Figure 1C.
Figure 5. Electropherograms of a salivary (A) and a CSF (B) sample. No SDS plug in (a), whereas a 10-s plug of 1×SDS was carried out in (b). Other conditions were as in Figure 1C.
Downloaded by NATIONAL TAIWAN UNIV on July 30, 2009
R-amylase isoenzymes (glycosylated proteins) in the presence of SDS suggest that the interaction between R-amylase and SDS was not strong under the separation condition. This is the first time that complete separation of six isoenzymes has been achieved at high pH by CE. With a high-resolving power and a good reproducible result [standard deviation (RSD) values for the migration times with the SDS plug were < 2.11% (n ) 3)], this method has shown useful for clinical diagnosis, such as that of dental caries and acute or chronic pancreatitis.59,60
Next, we performed the analysis of a CSF sample under the same conditions. Figure 5B shows that the migration times for tryptophan and β-trace protein (pI ) 7.6, Mw ) 21 kDa) were shorter, whereas that for HSA became longer in the presence of an SDS plug. It has been known that β-trace protein is the most abundant protein in the CSF, originating from the central nervous system.61 β-Trace protein is thought to be involved in the regulation of sleep, and its detection is important in the study of nervous system diseases, such as Alzheimer’s disease, cerebral infraction, and schizophrenia. It is interesting to note that there were three more peaks detected in the presence of the SDS plug simply because of improvements in sensitivity and efficiency. These peaks might correspond to peptides, other proteins, or the analytes dissociated from the proteins identified in the electro-pherogram. The RSD values for all peaks were∼2.0%, which again suggested that this method is robust.
CONCLUSION
The simultaneous analysis of the microheterogeneities of several proteins with a wide range of pI values has been achieved
by applying a short plug of SDS in PEO solution. The high resolving power of this method is mainly due to reduced protein adsorption, sieving, and interactions with SDS. Moreover, this method simply solves the problem associated with SDS in the analysis of proteins by CE-LINF. Because CE-LINF has proven important for single cell analysis, the results (improvements in efficiency and sensitivity) shown in this study may be applicable to such analyses. For example, it is worth analyzing the micro-heterogeneity of hemoglobin in single cells by this method with a CW UV laser, an instrument that is currently unavailable in this lab.
With the ability to separate proteins with pI ranging from 4.5 to 11.1 and to analyze biological samples such as saliva and CSF using a fused-silica capillary, this method has great potential for diagnoses. The ability to detect microheterogeneity while achiev-ing high sensitivity with this method should be emphasized, which is particularly important for proteomics. Without the need to derivitize with fluorophores, to pretreat the samples, or to perform isofocusing, this method has advantages over conventional meth-ods for proteomics.
Despite these advantages, this method is limited to proteins with intrinsic fluorescence characteristics. Thus, it is our goal to apply this method to the analysis of proteins labeled with suitable fluorophores. It is also important to combine this method with on-line concentration techniques43that we have developed recently for the analysis of trace proteins, particularly for proteomics.
ACKNOWLEDGMENT
This work was supported by the National Science Council of Taiwan, the Republic of China, under Contract no. NSC 90-2113-M-002-052. We thank Dr. Birgit An der Lan, Bethesda, MD, for editing this manuscript.
Received for review March 5, 2002. Accepted July 2, 2002. AC020140M
(58) Ferey-Roux, G.; Perrier, J.; Forest, E.; Marchis-Mouren, G.; Puigserver, A.; Santimone, M. Biochim. Biophys. Acta 1998, 1388, 10-20.
(59) Liang, H.; Wang, Y.; Wang, Q.; Ruan, M.-S. J. Chromatogr. B 1999, 724, 381-388.
(60) Rohlff, C. Electrophoresis 2000, 21, 1227-1234.
(61) Hiraoka, A.; Arato, T.; Tominaga, I.; Anjyo, A. J. Pharm. Biomed. Anal. 1997, 15, 1257-1263.
Downloaded by NATIONAL TAIWAN UNIV on July 30, 2009