SOO45-6535(96)00026-4 Copyright 0 1996 Elsewer Science Ltd Printed in Great Britain. All tights reserved 0045.6535/96 $15.00+0.00
The effects of pretreatment on the surface properties of soils
Chih-yu Chen*, Shian-thee Wu
Graduate Institute of Environmental Engineering, National Taiwan University, No, 71 Chou-shan Rd., Taipei, 10770, Taiwan, R. 0. C.
Abstract
(Received in Germany 18 November 1995; accepted 5 December 1995)
The specific surface areas of soil particles pretreated by sieving and degassing were measured with porosimeter to study whether these pretreatment procedures would result in changes on the surface properties of soil particles or not. It was found that different particle size and degassing temperature did not change the magnitude of specific surface area. The results revealed that the surface area of soil particles was contributed predominantly by internal surface and the degassing temperature did not affect the surface area till 250 OC. And an indirect method, based on the gas-solid adsorption isotherm data, was used to estimate the adsorption enerv distribution function for these soil-nitrogen system of different pretreaments. The results showed that the normalized distribution function was nearly similar for these two soils.
Introduction
Many soils had been contaminated with volatile organic compounds (VOCs) from improperly designed of hazardous waste disposal facilities, accidental spills, leaky under-ground storage tanks, pipes and so on. Most of these contaminants have been demonstrated having adverse effects on human health. And the adsorption process is one of the most important factor affecting the fate of organic pollutants inside the soils. To assess the hazardous risk to human and to evaluate the remediation alternatives, it is necessary to understand the adsorption processes thoroughly.
The adsorption mechanisms for VOC include capillary condensation, surface adsorption and partitioning in organic mat&. And two factors, surface area and porosity, are recognized playing complementary roles in adsorption phenomena. The specific surface area of soils is a common index of adsorption capacity of adsorbent. For soils, there is a series of procedures, such as air-dry, sieving and degassing under vacuum prior to the measurement of the specific surface area. We need to know that, which is the optimum particle size, what is the appropriate degas temperature while measuring the surface area, and whether the high degassing temperature will affect the surface structure significantly.
Because of the different extent of weathering and different composition of the soils the surface of soils is highly heterogeneous. Surface heterogeneity plays an important role in the adsorption processes by creating a variety of sorbing sites with different affinity to sorba&. It is necessary to understand the changes of surface properties before and after pretreatment in order to have consistent measurement results. An indirect method. based on the gas-solid adsorption isotherm data, can be used to estimate the adsorption energy distribution function for these soil-nitrogen system under different pretreament conditionss. The energy distribution function will reveal the surface heterogeneity of soil particle. And the changes of surface properties will be detected from the variation of distribution function.
1084
The purpose of this study is to clarify the effects of particle size on the surface area measurement and whether the pretreatments will change the surface properties of soils. Then, better pretreatment conditions can be detamined.
Materials and Methods
Determination of basic properties: There were two soils used in this study, slate alluvial soils and diluvium red soils. The soils were air-dried for about one month and then crushed by a wooden hammer. The crushed soils were sieved and the fractions with particle diameter smaller than 20 mesh were collected for use. Several basic properties of this two soils were analyzed. The moisture content of the air-dried soil was determined gravimetrically (oven-drying at 103.5 “C). The soil-pH was measured in a 1:l (w/w) solid- deionized water mixtur&. The organic carbon content of the soil was obtained by using the Walkley-Black procedur$. The cation-exchange capacity (CEC) of the soil was determined with the method proposed by Rhoades6. And the particle size analysis was conducted with pipette method. Table
1
lists the basic properties of these two soils.Table 1. Basic properties of slate alluvial soils and diluvium red soils. parameters
clay, % silt, % sand, % PH
slate alluvial soils diluvium red soils
23.0 06
46.0 $6.0
31.0 13:4
CEC, mot/Kg
organic carbon content, % moisture content, %
::: ;::
0.95 1.56
0.42 1.43
Isotherm determination: The soils collected were sieved into several fractions, and the fraction with sieve openings of 710-500 fi m, 500-300 g m and 250-180 fl m were selected for study. The specific surface area of soils were determined by BET nitrogen adsorption method with a porosimeter (Micromeritics Instrument Corporation, ASAP2000). The weight of soils used was about 0.6 grams in each measurement. To remove the impurities adsorbed onto the soil surface the sample was heated under vacuum. The degassing vacuum was 5 p mHg for at least three hours, and the degassing temperature was 120 “C. For the fraction of 500-300 pm of these two soils, three different degassing temperatures, 120 “C, 180 ‘C and 250 ‘C, were applied to investigate the effects of degassing temperature on the specific surface area.
Adsorption energy distribution function calculation: To estimate the adsorption energy distribution function of this adsorbate-adsorbent pair the overall adsorption isotherm can be described by the combination of local isotherms of specitic groups of sites with certain sorption energy’:
S,(P) = N,(P)/4 = I:,” @,(MF(c)n’E
3
(1)
where the N,(p)is the experimentally measured total amount of adsorbed vapor at vapor pressure p, N, is the monolayer adsorption capacity, E is the adsorption energy, @,(JJ,E) is the local adsorption isotherm for a specific group of adsorbing sites with same sorption energy, E, and E, is the minimum adsorption energy assumed to be equal to the energy of condensation of the adsorbates. The energetic heterogeneity of an adsorbing surface is characterized by the distribution function F(E) normalized to unity. Three adsorption isotherms are most frequently used to represent the local adsorption isotherm; they are Langmuir equation, Fowler-Guggenheim equation and BET equation7. And it was assumed that the local adsorption was identical for any adsorption energy level after the adsorption isotherm was selected.
surfaces can be described by exponential adsorption isotherm in the form9:
where the p, is the saturated vapor pressure. And this equation was derived from the description of the average number of sorbate molecules in the surface phase of an adsorption system by the methods of statistical mechanicsto. Equation (1) can be solved for exponential adsorption isotherm; equation (2) by using the method of condensation approximationg. The function giving pressure
p
versus adsorption energy E is calculated from equation of local adsorption isotherm 1. And for Langmuir-type local isotherm the function F(E) can be solved from equation (1) and equation (2) as799F(E) =
~JB,(Emin
-
&)‘-I
exp
CB,(&,,, -
E)’
[ ,=I
I[
OI
)
,=I
1
where the B, are defined as heterogeneity coefficients, which characterizes the structural and surface heterogeneity of a solid*. To evaluate B, for the local isotherm interpreted by BET model, equation (2) was modified by several researcherss. And the experimental adsorption data is approximated by the logarithmic polynomial
where .r = p/p, andy= +/(I - .I). The coefficient f$ is related to the monolayer adsorption capacity N, I
crp(B,,)
Results and discussion
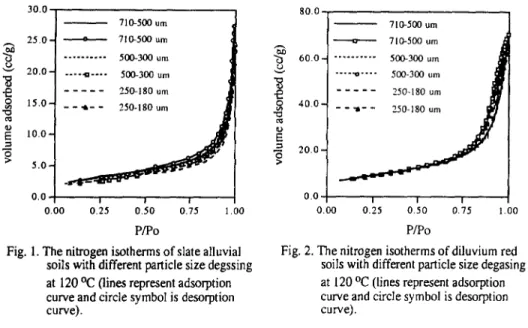
The nitrogen adsorption isotherm for slate alluvial soils and diluvium red soils are shown in Figure 1 and 2, respectively. Here the degassing temperature is 120 OC and the particle sizes are different. For both of these two soils it was found that the isotherms belonged to type III categorized by Brunauer-Deming-Deming-Teltert2. Due to the weak forces between adsorbent and adsorbate the amount adsorbed will be small under initial low pressure. Once the adsorbate being adsorbed the interaction between adsorbate and adsorbate will promote further adsorption-which is a cooperative process. This results in isotherms being convex to the pressure axisl. It is suggested that the interaction between nitrogen molecule and soil surface is weak and the heat of adsorption is equal to or less than the heat of liquefaction of the adsorbate. The adsorption isotherm did not vary with the particle size significantly. The increasing of external surface by reducing the particle sizes did not create any sizable adsorbing capacity. Since sorption processes are influenced by the properties of adsorbent and adsorbate including the micropore size and pore shape of adsorbent, the shape of isotherm is reflecting the surface properties and pore structure of the adsorbent (soil) directly t3-14. The similarity of the isotherms means that the surface properties and pore structure might be the same for soil with different particle size in the range from 180 p m to 710 /J m. In an other words, the working sieving sizes are much larger than the length scale of sorbing site.
It is believed that the micropores inside porous adsorbent create curved interfaces and the sorbate vapor will condense under pressure lower than the pressure specified with flat surface, therefore, adsorption hysteresis is often associated with porous geometry. It was known that certain shapes of hysteresis loop were associated with some specific pore structurest5. The hysteresis loop for diluvium red soils is more apparent than that for slate alluvial soils. For slate alluvial soils the desorption isotherm is almost on the top of the adsorption isotherm and the hysteresis loop is not shown at all. According to Cohan’s model 16, for conically shaped capillaries the
1086
-
710-500 urn 0.00 0.25 0.50 0.75 1 .oo P/PO 0.00 0.25 0.50 0.75 1.00 P/POFig.
1.
The nitrogen isotherms of slate alluvial Fig. 2. The nitrogen isotherms of diluvium red soils with different particle size degssing soils with different particle size degasing at 120 Oc (lines represent adsorption at 120 OC (lines represent adsorption curve and circle symbol is desorption curve and circle symbol is desorptioncurve). curve).
surface has its greatest curvature at the narrowest end, where a meniscus is formed. When condensation takes place the liquid meniscus is progressed to a wider part of the capillary. To allow further condensation of the vapor, its pressure must be increased. During desorption the process follows the same path but in an opposite direction, so the capillary condensation in conical pores is reversible. It is supposed that there are mainly conical capillaries in slate alluvial soil particles. For diluvium red soils the hysteresis loop belonged to A-type loop defined by de BoerIs, in which there are capillaries open at both end. Also, the hysteresis loop had a slope due to that the soils did not have a completely uniform structure. In this type of capillary structure, the interficial meniscus will not be formed until the sorbate films condensed on the inner surface of the capillary tubes reach a certain thickness. However, under desorption the meniscus will last much longer by only losing liquid at two fronts, and require lower pressure (higher vacuum) to remove sorbate against the surface tension.
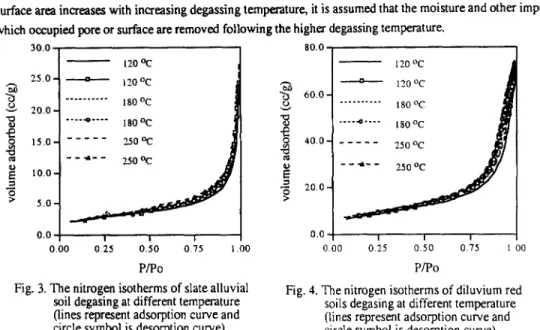
The sorption isotherms of nitrogen for slate alluvial soils and diluvium red soils with same particle size 500-300 LJ m and degassing at different temperature were shown in Figure 3 and 4. The results revealed that the nitrogen isotherm did not shift much with degassing temperature and the isotherms belonged to Type III also. It is suggested that the degas pretreatment, with temperature varying from 120 ‘C to 250 ‘C, did not modified the surface properties and pore structure significantly. But, slightly higher adsorption capacity can be observed. While degassing the moisture was lost, however, the removal of moisture had no apparent difference among different degassing temperature even under rigorous pretreatment situations (i.e.. high degassing temperature). The original moisture content of soils was considerably low and it is supposed that the removal of small amount of moisture do not change the surface properties and pore structure significantly.
The specific surface area of both soils estimated from BET/N2 adsorption isotherm was listed in Table 2. For different pretreatment processes there are slight difference on the results of specific surface area. The specific surface area decreases with decreasing particle size and increases with increasing degassing temperature. The total surface of porous solids included external surface and internal surface t. The external surface was taken to include prominences and cracks which were wide and shallow. The internal surface comprised the walls of cracks, pores and cavities which were deep and narrow. If the external surface predominated, the specific surface area of porous solids would increase with decreasing particle size. From the results that the specific surface area
did not increase with decreasing particle size, it was
concluded that the internal surface was much greater than the external surface. The total surface of soil particles was predominated by internal surface. Another results that the surface area increases with increasing degassing temperature, it is assumed that the moisture and other impurities which occupied pore or surface are- removed following the higher degassing temperature.0.00 0.25 0.50 0.75 P/PO 1.00 80.0 $ 60.0 g a 40.0 -0 m E 3 B 20.0 0.0 , / 3 015
o.;o
0.h I P/PO Fig. 3. The nitrogen isotherms of slate alluvialsoil degasing at different temperature
Fig. 4. The nitrogen isotherms of diluvium red (lines represent adsorption curve and
soils degasing at different temperature circle symbol is desorption curve).
(lines represent adsorption curve and circle symbol is desorption curve). Table 2. Specific surface area (BETIN2) of slate alluvial soils and diluvium red soils
for different oretreatment orocesses.
10
soil particle size ,,&O
degas temp. OC 120
specific surface area. m2/g repeated measurement from 4 11.11
1 I
.04 1I
.02 9.0500-300 120 9.70 9.78 9.85 8.1
slate alluvial soil 500-300 180 10.02 8.2
500-300 250 10.44 8.6
250- 180 120 9.08 8.94 1.3
710-500 120 31.18 26.7
500-300 120 30.67 30.37 26. I
diluvium red soil 500-300 180 32.48 21.8
500-300 250 32.37 32.35 21.9
250- 180 120 29.98 25.5
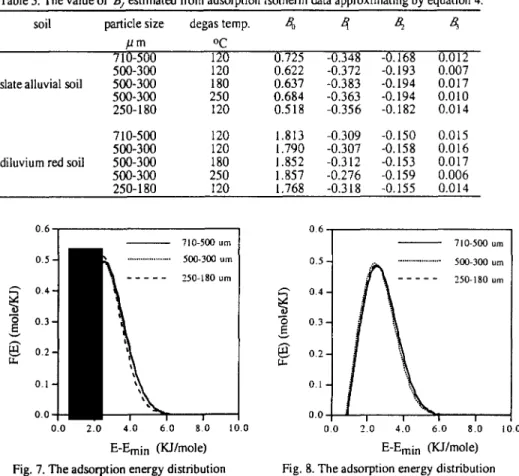
To further study the effects of pretreatment processes on the surface of soil particles the adsorption energy distribution function was estimated from adsorption isotherm data. The adsorption isotherm data was approximated by the logarithmic polynomial (equation 4) to evaluate the value of f?, listed in Table 3. Then the B, was substituted into equation (4) to calculate the isotherm data and the results were compared with the experimentally measured data (shown in Figure 5 and 6). It was found that the isotherm can be described well by equation (4). The monolayer adsorption capacity, N’, can be calculated from L+,. The specific surface area of soil were calculated with the cross-sectional area of a nitrogen estimated with the method of Tremaine and Gray”. In our system the specific surface area estimated from 4 was slightly smaller than that determined by BET model.
To evaluate the adsorption energy distribution function the B, previously obtained was substituted into equation (3). And the results were shown in F(E) versus & - Emin figures. For slate alluvial soils and diluvium red soils the normalized adsorption energy distribution functions were independent upon the particle size (Figure
1088 D . measured data
2
20.0 - 8 lS.O- D T3 m 2 10.0 - 3 9 s.o- .,
zd 4 3 . Y I I i : , ?? 40.0 20.0l_i
0.0.1 0.00 0.25 0.50 0.75 1 .oo 0.00 0.25 0.50 0.75 1.00 PIP0 PIP0 Fig. 5. The comparsion of adsorption isothermand simulated isotherm by equation 4 for Fig. 6. The comparsion of adsorption isotherm slate alluvial soils (particle size =760-500
and simulated isotherm by equation 4 for diluvium red soils (particle size =7&l-500 urn, degas temp. =120 OC). urn, degas temp. = 120 OC).
Table 3. The value of B, estimated from adsorption isotherm data approximating by equation 4.
soil particle size degas temp. 4 4 65 4
7 IGOO
OC
20 0.725 -0.348 -0.168 0.012
500-300 f20 0.622 -0.372 -0.193 0.007
slate alluvial soil 500-300 180 0.637 -0.383 -0.194 0.017
500-300 250 0.684 -0.363 -0.194 0.010
250-180 120 0.518 -0.356 -0.182 0.014
710-500 120 1.813 -0.309 -0.150 0.015
500-300 120 1.790 -0.307 -0.158 0.016
diluvium red soil 500-300 180 1.852 -0.3 12 -0.153 0.017
500-300 250 1.857 -0.276 -0.159 0.006 250-180 120 1.768 -0.318 -0.155 0.014 0.6 0.5 =: 0.4 % 8 0.3 g 0.2 0.1 0.0 - 710-500 urn . ...” . . . .._. 5@J_3@Jum 0.0 2.0 4.0 6.0 8.0 1 E-Emin (KJ/mole) Fig. 7. The adsorption energy distribution
functions for slate alluvial soil with different particle size degasing at 120 “Cc.
0.6
- 710-500 urn
0.0 2.0 4.0 6.0 8.0 I’ E-Emin (KJ/mole) Fig. 8. The adsorption energy distribution
functions for diluvium red soil with different particle size degasing at 120 “C.
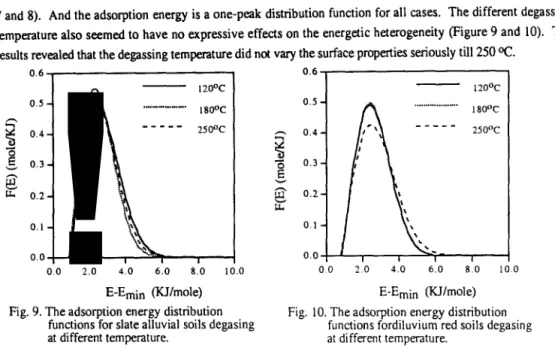
temperature also seemed to have no expressive effects on the energetic heterogeneity (Figure 9 and 10). The results revealed that the degassing temperature did not vary the surface properties seriously till 250 Oc.
0.6
0.0 2.0 4.0 6.0 8.0 10.0 E-Emin &J/mole)
o-o
2.-o
4.0 6:0 8 0 1 0E-Emin (K-l/mole) Fig. 9. The adsorption energy distribution
functions for slate alluvial soils degasing
Fig. 10. The adsorption energy distribution at different temperature.
functions fordiluvium red soils degasing at different temperature.
. . .
I . . .1 sow _-__-
250°C
It was interesting to find that the shape of normalized adsorption energy distribution function was nearly identical for these two soils. Although the surface of different soils was different, it seems that the adsorbate-site interaction was similar for these two kind soils. Kiselev and his associates’* distinguished between specific and non-specifc adsorption according to the energy of interaction between adsorbent and adsorbate. It was supposed that the interaction between nitrogen and soil surface belonged to non-specific adsorption. And the interaction energy was too weak to distinguish the difference on the adsorbing site properties of soils. The probing nitrogen was not appropriate to detect the difference in the energetic heterogeneity of adsorbing sites between these two soils.
Conclusion
The results revealed that the specific surface area was irrelevant to the particle size of soils. And the measured surface area was offered predominantly by the internal surfaces. The specific surface area of soils increases slightly with increasing degassing temperature because that the moisture and impurities occupied the surface or pore are removed. From the evidence of hysteresis loop the pore structure of soils is roughly obtained. The analysis of adsorption energy distribution function for soils with different particle size or degassing temperature showed that there were no significant changes on the energetic heterogeneity of soil particles. Under this nitrogen probing system both slate alluvial soils and diluvium red soils possess nearly identical normalized site energetic distribution function.
Acknowledge: The authors gratefully acknowledge the financial support of the National Science Council, R. 0. C., (Contract No.: NSC 83-0410-EOO2-116) for this research work.
Reference
1. Greg, S. J. and Sing, K. S. W., Adsorption, surface area, and porosity, Academic Press Inc., London, 1982. 2. Jaroniec, M. and Briuer, P., “Recent Progress in Determination of Energetic Heterogeneity of Solids from
1090
3. House, W. A., Jaroniec, M., Bduer, P., and Fink, P. “Surface heterogeneity effects in nitrogen adsorption on chemically modified aerosils, 1. discussion of the energy distribution functions evaluated by using the condensation approximation method”. Thin Solid Films, 85, 87-96, 1981.
4. MC Lean, E. O., “Soil pH and lime requirement” in Methods of soil analysis, part 2. Chemical and microbiological properties, 2nd edition, 1982.
5. M. Th. van Genuchten and Wierenga, P. J., “Mass transfer studies in sorbing porous media. I. analytical solutions”, Soil Sci. Sot. Am. J., 40(4), 473-480, 1976.
6. Rhoades, J. D. “Cation exchange capacity” in Methods of soil analysis, part 2. Chemical and microbiological properties, 2nd edition, 1982.
7. Jaroniec, M. and Btiuer, P. “Recent Progress in Determination of Energetic Heterogeneity of Solids from Adsorption Data”, Surface Science Reports, 6,65-l 17, 1986.
8. Sokolowska, Z., Jozefaciuk, G., Sokolowska, S. and Ourumova-Pesheva, A., “Adsorption of water vapor by soils: investigations of the influence of organic matter, iron, and aluminum on energetic heterogeneity of clays”, Clay and Clay Matters, 41(3), 346-352, 1993.
9. Jaroniec, M., “Adsorption on heterogeneous surfaces: the exponential equation for the overall adsorption isotherm”, Surface Science, 50, 553-564, 1975.
10. Heer, C. V., “Statistical thermodynamic theory for adsorption isotherms”, J. Chem. Phys., 55(8), 4066- 4071, 1971.
11. Cerofolini, G. F., “Localized adsorption on heterogeneous surfaces”, Thin Solid Films, 23, 129-152, 1974. 12. Brunauer, S., Deming, L. S., Deming, W. S. and Teller, E., “On a theory of the van der Waals adsorption
of gases”. J. Am. Chem. Sot., 62, 1723-1732, 1940.
13. Liu, H., Zhang, L. and Seaton, N. A., “Sorption hysteresis as a probe of pore structure”, Langmuir, 9, 2576-2582, 1993.
14. Se&Levy, A. and Avnir, D., “Effects of Heterogeneous Surface Geometry on Adsorption”, Langmuir, 9. 3067-3076, 1993.
15. Oscik, J. Adsorption, Ellis Horwood Ltd., 1982..
16. Cohan, L. H. “Sorption hysteresis and the vapor pressure of concave surfaces”. J. Am. Chem. Sot., 60, 433-435, 1938.
17. Tremaine, P. R. and Gray, D. G., ” Adsorption of non-swelling vapours on the surface of cellulose”, J. Chem. Sot. Faraday Trans., (1)71, ,2170-2185, 1975.
18. Kiselev, A. V., Kovaleva, N. V. and Nikitin, Yu. S., “Gas chromatography of monolayers”, J. Chromatogr., 58. 19-30, 1971.