An estimation of the health impact of groundwater pollution caused by dumping of
chlorinated solvents
Lukas Jyuhn-Hsiarn Lee
a,b, Chien-Hung Chen
c, Yu-Yin Chang
b, Saou-Hsing Liou
d, Jung-Der Wang
a,b,c,⁎
aDepartment of Environmental and Occupational Medicine, National Taiwan University Hospital, Taipei, Taiwan
bInstitute of Occupational Medicine and Industrial Hygiene, College of Public Health, National Taiwan University, Taipei, Taiwan c
Department of Internal Medicine, National Taiwan University Hospital and National Taiwan University College of Medicine, Taipei, Taiwan
d
Division of Environmental Health and Occupational Medicine, National Health Research Institutes, Miaoli, Taiwan
a b s t r a c t
a r t i c l e i n f o
Article history: Received 7 July 2009
Received in revised form 19 November 2009 Accepted 17 December 2009
Available online 8 January 2010 Keywords:
Groundwater pollution Quality-adjusted life years Liver cancer
Utility
Background: Hazardous waste sites are major environmental concerns, but few studies have quantified their expected utility loss on health.
Objectives: To evaluate the health impact of groundwater pollution by an electronics manufacturing factory, we conducted a health risk assessment based on expected utility loss from liver cancer.
Methods: Based on measurements of major pollutants, we estimated the likelihood of developing liver cancer after exposure to groundwater contamination. All patients with liver cancer between 1990 and 2005 in the Taiwan Cancer Registry were followed through 2007 using the National Mortality Registry to obtain survival function. Quality of life was assessed with two cross-sectional surveys, one employing the standard gamble method, and the other using the EQ-5D instrument. Quality-adjusted life expectancy (QALE) was estimated by multiplying the utility values with survival function under the unit of quality-adjusted life year (QALY). The difference of QALE between the cancer cohort and the age- and gender-matched reference population was calculated to represent the utility loss due to liver cancer.
Results: A total of 94,144 patients with liver cancer were identified. The average utility loss to development of liver cancer was 17.5 QALYs. Based on toxicological approach, we estimated that groundwater pollution caused 1.7 extra cases of liver cancer, with an overall loss of 29.8 QALYs. Based on epidemiological approach, the expected annual excess number of liver cancer would be 3.65, which would have been accumulated through the years, had the pollution not mitigated.
Conclusions: We demonstrated a practical approach for comparative health risk assessment using QALY as the common unit. This approach can be used for policy decisions based on possible health risks.
Crown Copyright © 2009 Published by Elsevier B.V. All rights reserved.
1. Introduction
Uncontrolled hazardous waste sites are major environmental and public health concerns in many countries (Johnson, 1995). In 1994, the Taiwan Environmental Protection Administration (EPA) declared an electronics factory in Taoyuan County, which was operational from 1970 until 1992, a hazardous waste site. From 1999 to 2000, we conducted a site-specific risk assessment on residents in the groundwater-contaminated community downstream from the facto-ry. We performed measurements on groundwater concentrations of seven chlorinated hydrocarbons in the 44 downstream residential wells. Vinyl chloride, tetrachloroethylene and trichloroethylene, were the carcinogenic chemicals classified by the International Agency of Research on Cancer (IARC) as groups 1 and 2A, all affecting the liver as
their major target organ based on animal studies retrieved from toxicological databases (U.S. EPA Integrated Risk Information System database, 2009; ATSDR, 2009). By following the guidance of the U.S. Environmental Protection Agency (U.S. EPA, 1989, 2001a), we found an increased carcinogenic risk based on the scenario of reasonable maximum exposure (RME) (Lee et al., 2002). The increased risk of liver cancer was corroborated by a case-control study, in which male residents in the downstream (exposed) village had an increased mortality odds ratio for liver cancer of 2.57 (95% Confidence interval: 1.21–5.46) compared with those in the upstream (unexposed) area after adjustment for age and period (Lee et al., 2003). The above estimates provided some information on how much could the preventive measures have contributed, had they been proactively taken earlier. However, the above estimates cannot be directly compared with the contribution of other healthcare services and cannot be used to promote prevention on a higher priority in health policy decision.
Quality of life (QOL) is an increasingly important measure of subjective health outcomes of cancer, in addition to an objective
Science of the Total Environment 408 (2010) 1271–1275
⁎ Corresponding author. Institute of Occupational Medicine and Industrial Hygiene, College of Public Health, National Taiwan University; Rm. 719, No. 17, Xuzhou Rd., Taipei 100, Taiwan. Tel.: +886 2 33668080; fax: +886 2 2322 4660.
E-mail address:jdwang@ntu.edu.tw(J.-D. Wang).
0048-9697/$– see front matter. Crown Copyright © 2009 Published by Elsevier B.V. All rights reserved. doi:10.1016/j.scitotenv.2009.12.036
Contents lists available atScienceDirect
Science of the Total Environment
j o u r n a l h o m e p a g e : w w w. e l s ev i e r. c o m / l o c a t e / s c i to t e n vindicator of survival (Testa and Simonson, 1996). To perform a comparative health risk assessment, we need to develop an approach using a common unit, such as quality-adjusted life year (QALY), for determining how to effectively spend clinical resources to maximize QALYs (Cohen et al., 2008). Although, as an English proverb says,“an ounce of prevention is worth a pound of cure”, there have been relatively few studies quantifying the expected loss of QALYs due to environmental and/or occupational pollution. The objective of this study is to estimate the total QALYs lost due to the occurrence of liver cancer, and the total expected loss of QALY resulting from ground-water pollution in a north Taiwanese community based on reasonable maximum exposure.
2. Methods
Our approach to estimate the health impact from groundwater contamination included two steps: the first step was to calculate cancer risk estimates based on on-site environmental exposure assessment, epidemiological data, and cancer slope factors based on toxicological studies, of which the target organ is the liver; the second step was to evaluate the consequence of the event of pollution by the metric of QALY. In thefirst step, we derived the estimates of likelihood of cancer from our previous studies on risk assessment (Lee et al., 2002, 2003), which were the estimates of lifetime excess risk related to the groundwater pollution. In this study, the expected excess number of cancer can be estimated by multiplying the lifetime excess risk estimates with the population at risk or the number of people resided in this community. Then, we estimated the impact of occurrence of a case of liver cancer in loss of QALY through integration of survival and quality of life. While the survival function of liver cancer can be obtained from linkage between the National Cancer Registry and the National Mortality Registry, we also conducted a questionnaire survey of quality of life among patients with liver cancer and the quality-adjusted life expectancy (QALE), as well as the loss of QALE under the unit of QALY.
2.1. Risk assessment on community residents exposed to the groundwater contamination
According to the British Standard 18004:2008, risk is the combination of the likelihood of a hazardous event or exposure(s) and the severity of injury or ill health that can be caused by the event or exposure(s) (British Standard Institution, 2008), which provides us a basis to quantify the impact of risk by multiplying the likelihood (or probability) of an event's occurrence with the consequence of the event.
Our risk assessments were based on two approaches: toxicological and epidemiological. The former is estimated by the exposure scenario of the reasonable maximum exposure (RME), which was a precautionary estimate proposed by theU.S. EPA (2001a). The RME is defined as the highest exposure that is reasonably expected to occur at a site, and is intended to estimate a conservative exposure case within the range of possible exposures (U.S. EPA, 2001b). Under the RME scenario, we used the upper-bound estimates of each input variable, which were the 95% upper confidence limit of the arithmetic mean for chemical concentrations and the 95th percentiles of exposure parameters for their corresponding distributions. Carcino-genic risk was an incremental probability of getting cancer over a lifetime, which was calculated from lifetime intake multiplied by a slope factor for individual chemical carcinogen. Based on the lifetime exposure doses in RME scenarios, we estimated that the likelihood of developing liver cancer due to exposure to groundwater polluted with vinyl chloride, trichloroethylene, and tetrachloroethylene was 8.4 × 10− 6, 1.4 × 10− 4, and 1.9 × 10− 4, respectively (Lee et al., 2002). As the population of the downstream (exposed) community was about 5000 people, we estimated the excess cases of liver cancer
during the lifetime resulting from groundwater pollution would be (8.4 × 10− 6+ 1.4 × 10− 4+ 1.9 × 10− 4) × 5000 = 1.7. We then calcu-lated the impact of a case of liver cancer under the metric of quality-adjusted life year (QALY).
The epidemiological approach is based on a study comparing the relative risk of liver cancer for people residing in the downstream versus upstream communities with polluted groundwater. The relative risk estimated was 2.57 after adjusted for age and calendar period (or residential period), but was only statistically significant among males (Lee et al., 2003). We thus applied the excess relative risk 2.57−1=1.57 and calculated the expected excess number of liver cancer based on our national cancer registry during 1996–2005, of which the annual average incidence rate of liver cancer for males was 93.1 × 10− 5per year.
2.2. Survival of liver cancer
The Taiwan Cancer Registry, a population-based cancer registry, was founded in 1979. All hospitals with a capacity of greater than 50 beds are recruited to participate in reporting all newly-diagnosed malignant neoplasms to the registry (Taiwan Cancer Registry, 2009). We analyzed the cases submitted to the Taiwan Cancer Registry Database from January 1990 to December 2005, and identified all cases of liver cancer using the International Classification of Disease for Oncology (ICD-O) code 155.0 (DOH, 1997). This dataset was then linked with the National Mortality Registry database to verify the vital status for every case up to the end of 2007.
2.3. Quality of life survey
From February to April 2002, 161 patients with liver cancer were enrolled for quality of life (QOL) assessment. We used the Taiwanese version of the WHOQOL-BREF, which has been validated for clinical use (Yao et al., 2002), and the standard gamble (SG) method for utility. The validation of these instruments for measuring QOL among patients with liver cancer has been described elsewhere (Lee et al., 2007). The institutional review board approved this study and informed consent was obtained from every participant prior to administration of the survey. For cross-validation with the QALY loss using the standard gamble utility, we collected EQ-5D data from another group of 199 patients with liver cancer, most of which were hepatitis B-associated. Developed by the EuroQol Group, the EQ-5D is a generic instrument for describing and valuing health. Data were collected between January 2007 and December 2008. The mean utility function of the sampled patients, who had different durations-to-date after diagnosis of cancer, was obtained by the kernel smoothing method. The survival curve was adjusted with the utility function to estimate the quality-adjusted survival for the cohort of liver cancer patients (Hwang and Wang, 1999; Fang et al., 2007).
2.4. Statistical analysis
The survival functions and median survival (in months) of liver cancer patients were calculated according to the Kaplan–Meier method. For the analysis of descriptive data and Kaplan–Meier analysis, SAS software (SAS, NC, Version 9.1) was used. Since the median survival of liver cancer in Taiwan is usually less than 1 year, most patients were deceased after 18 years of follow-up. However, we still extrapolated thefinal part of the survival function during the follow-up period to obtain the lifetime survival function (Hwang and Wang, 1999). Quality-adjusted survival (QAS) was estimated by incorporating the survival function of the cohort of liver cancer patients and the utility measurement from the cross-sectional survey. The details of the estimation method for 17 types of major cancer in Taiwan are described elsewhere (Chu et al., 2008a). Briefly, the survival function for an age- and gender-matched reference
population was generated, using the Monte Carlo method, from the life-table of the general population of Taiwan in year 2000. The lifetime survival of the patients with liver cancer (up to 50 years) was obtained using linear extrapolation of a logit-transformed curve of the survival ratio between the cancer cohort and reference population under the assumption of a constant excess hazard model (Chu et al., 2008a; Fang et al., 2007; Hwang and Wang, 1999). The expected years of life lost (EYLL) for a specific disease was defined as the lifetime survival difference between the disease cohort and an age- and gender-matched reference population. We estimated the average EYLL by calculating the difference in the areas under the long-term survival curves between the cohort of liver cancer patients and the age- and gender-matched reference population. Similarly, we applied the Monte Carlo method to each patient with liver cancer to simulate an age- and gender-matched person with the survival function of the general population. This produced an average survival curve of the reference population without liver cancer, of which the utility value is set at 1. To facilitate the estimation, we used a free software program, MC-QAS, which is built in the R statistical package, which can be downloaded fromhttp://www.stat.sinica.edu.tw/jshwang.
3. Results
A total of 94,144 patients with liver cancer were identified in the Taiwan Cancer Registry from 1990 to 2005. This retrospective cohort consisted of 71,051 men and 23,093 women, with a mean age of 60.6 ± 13.5. Females were significantly older than males (+5.1 years). The median survival was 8.5 months for all cases, 7.8 months for male cases, and 11.2 months for females.Table 1summarizes the epidemi-ological features of our patient cohort. The average EYLL due to liver cancer was 16.7 years. After adjustment with the QOL data measured using the standard gamble method, the expected QALYs lost from developing a liver cancer was 17.5 QALYs per patient.
Fig. 1illustrates the estimation of quality-adjusted survival (QAS) for the cohort of liver cancer patients during the follow-up period (which ended in 2007). The estimated mean utility function was plotted according to time afterfirst diagnosis, and then used to adjust the survival function for the corresponding duration-to-date. The shaded area under the curve represents expected cumulative
quality-adjusted survival (QAS) over the follow-up period. The estimated SG utility-adjusted survival function was extrapolated up to 50 years for the entire cohort of liver cancer patients. The difference of quality-adjusted life expectancy (QALE) between the liver cancer patient cohort and the age- and gender-matched reference population with perfect health (utility = 1) was 17.5 QALYs, which represents the average utility loss due to developing liver cancer (Fig. 2).
According to the risk characterization, based on the assessment of reasonable maximum exposure and cancer slope factors obtained from the toxicological databases, we expected that exposure to groundwater pollution would lead to an additional 1.7 cases of liver cancer. Multiplying the average QALE loss to a case of liver cancer by the estimated additional number of liver cancer in the downstream community, liver cancer from groundwater pollution led to a total health utility loss of 29.8 QALYs in the community (Table 2). Based on epidemiological data (Lee et al., 2003), the expected annual excess number would be 1.57 × 93.1 × 10− 5× 2500 = 3.65, and the estimated utility loss would be 3.65 × 17.5 = 63.9 QALY. If the pollution was not mitigated for the next 10 years, then there would be 639 QALY loss, in addition to all the healthcare expenditures for taking care of these patients.
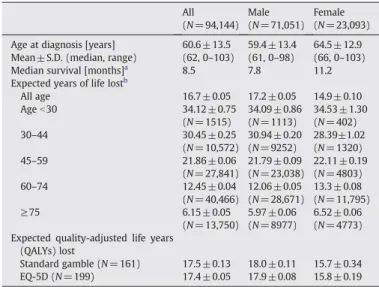
Table 1
The epidemiological features, median survivals, expected years of life lost and expected quality-adjusted life years lost of the liver cancer patient cohort.
All (N = 94,144) Male (N = 71,051) Female (N = 23,093) Age at diagnosis [years] 60.6 ± 13.5 59.4 ± 13.4 64.5 ± 12.9 Mean ± S.D. (median, range) (62, 0–103) (61, 0–98) (66, 0–103) Median survival [months]a
8.5 7.8 11.2
Expected years of life lostb
All age 16.7 ± 0.05 17.2 ± 0.05 14.9 ± 0.10 Ageb30 34.12 ± 0.75 (N = 1515) 34.09 ± 0.86 (N = 1113) 34.53 ± 1.30 (N = 402) 30–44 30.45 ± 0.25 (N = 10,572) 30.94 ± 0.20 (N = 9252) 28.39±1.02 (N = 1320) 45–59 21.86 ± 0.06 (N = 27,841) 21.79 ± 0.09 (N = 23,038) 22.11 ± 0.19 (N = 4803) 60–74 12.45 ± 0.04 (N = 40,466) 12.06 ± 0.05 (N = 28,671) 13.3 ± 0.08 (N = 11,795) ≥75 6.15 ± 0.05 (N = 13,750) 5.97 ± 0.06 (N = 8977) 6.52 ± 0.06 (N = 4773) Expected quality-adjusted life years
(QALYs) lost
Standard gamble (N = 161) 17.5 ± 0.13 18.0 ± 0.11 15.7 ± 0.34 EQ-5D (N = 199) 17.4 ± 0.05 17.9 ± 0.08 15.8 ± 0.19
a
Kaplan–Meier (KM) survival analysis.
b
Expected years of life lost were expressed as means ± SE. The reference population was based on Taiwan vital statistics in 2000, and matched for gender and age.
Fig. 1. Estimation of the quality-adjusted survival (black solid curve) for the liver cancer patients in the Taiwan Cancer Registry between 1990 and 2005. The estimated population-mean utility measures using the standard gamble (SG) are plotted in blue dotted curve, with the corresponding survival function in the red dashed curve. The shadowed area under the black solid curve represents the expected cumulative quality-adjusted survival (QAS) over the follow-up period (until 2007).
Fig. 2. The estimated difference in quality-adjusted life expectancy (QALE), measured by integration of utility and lifetime survival functions, between the cohort of liver cancer and the reference population of Taiwan. The difference is plotted against time up to 50 years. The difference (shadowed area) of QALE between the cohort of liver cancer patients and the age-, gender-matched reference population with perfect health (utility = 1) represents the average utility loss of developing a case of liver cancer, or 17.5 quality-adjusted life years (QALYs).
4. Discussion
This study demonstrated an empirical example of how QALY can be used to comparatively assess the health risk of groundwater pollution with regard to developing cancer. While the usual approach of risk characterization focuses on the quantification of the likelihood of significant health events, this study goes one step further to estimate the expected number of QALY loss. Adopting the concept of risk defined by the British Standard 18004:2008, we quantified the consequence of health outcomes (liver cancer) for a significant event (groundwater pollution). In other words, we have determined that this pollution event would cause extra 1.7 cases of liver cancer based on RME scenario, which would result in a loss of 29.8 QALYs for people living in the downstream community. As indicated by the standard error of mean, the calculated survival function is relatively accurate. This accuracy is due to the large patient cohort, length of follow-up (18 years), and low censor rate (16%). If the utility values of patients with liver cancer were replaced by the measurement of EQ-5D, then the total loss would be 29.6 QALYs, a minimal modification to the final value. Thus, we concluded that our method has practical applications in comparative health risk assessments. Future studies incorporating more different scenarios and/or cost for prevention or mitigation of pollution should be conducted to assess the cost-effectiveness of different health policy options.
Our method combines the patient's centered preference value and survival functions to produce quality-adjusted life expectancy and the expected QALY loss compared to the age- and gender-matched general population in Taiwan. The major contribution of our integrated approach is quantifying the utility loss of the patients with liver cancer. Compared with disability-adjusted life years (DALYs), which have been developed to assess global burden of disease based on disability weights from expert consensus, our approach takes individual preferences into consideration. Therefore, our method may be more useful for practical decision-making within a country, since different health risks/impacts can be directly compared for policy decisions under the same metrics, with QALY as the common unit.
This study does have following limitations. We only quantified the loss of utility related to health of the exposed population, and did not consider the societal loss of productivity or human capital resulting from premature mortality plus the health expenditure spent for caring liver cancer (Chu et al., 2008b). We have stratified the patients by age and gender in the EYLL estimation, which has revealed that the younger the age at diagnosis, the larger the amount of EYLL, as shown
inTable 1. Another limitation is that we only quantified the utility loss from the occurrence of liver cancer, but there are other possible adverse health effects from exposure to mixtures of chlorinated hydrocarbons, including breast cancer in females (Sung et al., 2007; Wang et al., 2002), and leukemia in the offspring of women exposed during periconception (Sung et al., 2008). Therefore, our estimated disease impact could be an underestimation of the total risk. Finally, our approach is based on a single scenario, reasonable maximal exposure (RME), proposed by the U.S. EPA. Future assessment should consider more different scenarios to indicate the range of uncertainty, and sensitivity analyses could provide more accurate and compre-hensive information for policy decision.
Epidemiological approach provides evidence based on observation of human population under real world conditions, and it can avoid extrapolation across species but has the inherent limitations related to statistical power, potential bias and confounding. In contrast, there is a great amount of uncertainty in the lifetime excess cancer risk estimates in the risk assessment derived from toxicological approach, including inter-species extrapolation from animal bioassays to human health effects, the assumption of an additive effect among several carcinogens potentially affecting the same target organ. In this study, vinyl chloride, tetrachloroethylene and trichloroethylene were IARC group 1 (definite) and 2A (probable) human carcinogens involving the liver as the most sensitive tumor site. The potential health risks associated with the complex mixtures of chlorinated hydrocarbons might be greater than those of a single chemical because synergistic interactions may occur when mixtures are encountered (Seed et al., 1995). Moreover, a high HBV carrier rate of 13.6% was reported in the residents of the downstream community. Therefore, the possibility of synergistic interaction between these chlorinated solvents and chronic hepatitis B infection (Du and Wang, 1998) might further aggravate the risk of liver cancer. Thus, it seems not a surprise tofind that the epidemiological approach revealed about more than 2 times of risk. As the life span of human is generally longer than those of rodents or other experimental animals, the annual incidence rate estimated by epidemiological method could come up with an even greater impact if the pollution is not mitigated within the next decade and the increased incidence of liver cancer might persist.
In conclusion, using QALY as the common unit, we have established a practical approach for comparative environmental health risk assessment which can be used to prioritize health policy decisions related to pollution. While this study mainly involves carcinogenic risks with a short survival, future studies can also be conducted upon health risks involving heavy impairment of quality of
Table 2
The estimation of health utility loss from liver cancer caused by groundwater contamination from dumped chlorinated solvents.
Measure
Quality-adjusted survival up to 18 years
QALE by Huang's extrapolation method QALE loss due to a case of liver cancer Liver cancer General population
Mean (SE) 2.5 (0.10) 3.1 (0.12) 20.6 (0.03) 17.5 (0.13)
QALY QALY QALY QALY
Quantitative carcinogenic risk based on toxicological data Population at risk Excess number of liver cancer
Utility loss due to liver cancer in the community Vinyl chloride Trichloroethylene Tetrachloroethylene
8.4 × 10− 6 1.4 × 10− 4 1.9 × 10− 4 5000 1.7 29.8 QALY Excess relative risk based on epidemiological data Population at risk
(males only)
Annual excess number of liver cancer
Utility loss due to liver cancer in the community annually National incidence rate for
male liver cancer during 1996–2005
Relative risk assumed to be adjusted mortality odds ratio
Excess relative risk for males
93.1 × 10− 5/year 2.57 1.57 2500 3.65 63.9 QALY
QALE: quality-adjusted life expectancy. QALY: quality-adjusted life year.
life with an extended period of time, such as chronic kidney diseases or injuries of spinal cord for comparative assessment of risks. Acknowledgements
We are very grateful to the Bureau of Health Promotion, Department of Health of Taiwan, for providing the dataset of the Taiwan Cancer Registry cross-linked with death certificate data.
Grant information:The National Health Research Institutes (NHRI) of Taiwan funded this research (NHRI-97A1-PDCO-01-0811-2). References
Agency for Toxic Substances and Disease Registry (ATSDR). Toxicological Profile Information Sheet. Available athttp://www.atsdr.cdc.gov/toxpro2.htmlaccessed in November 2009.
British Standard Institution. Guide to Achieving Effective Occupational Health and Safety Performance. London, UK: British Standards Institution; 2008. BS 18004. Chu PC, Wang JD, Hwang JS, Chang YY. Estimation of life expectancy and the expected
years of life lost in patients with major cancers: extrapolation of survival curves under high-censored rates. Value Health 2008a;11:1102–9.
Chu PC, Hwang JS, Wang JD, Chang YY. Estimation of the financial burden to the National Health Insurance for patients with major cancers in Taiwan. J Formos Med Assoc 2008b;107:54–63.
Cohen JT, Neumann PJ, Weinstein MC. Does preventive care save money? Health economics and the presidential candidates. N Engl J Med 2008;358:661–3. DOH (Department of Health) of Taiwan. Chinese Translation Version of the International
Classification of Disease for Oncology. 2nd ed. World Health Organization; 1997. June. Du CL, Wang JD. Increased morbidity odds ratio of primary liver cancer and cirrhosis of the liver among vinyl chloride monomer workers. Occup Environ Med 1998;55:528–32. Fang CT, Chang YY, Hsu HM, Twu SJ, Chen KT, Lin CC, et al. Life expectancy of patients with newly-diagnosed HIV infection in the era of highly active antiretroviral therapy. QJM-An Int J Med 2007;100:97-105.
Hwang JS, Wang JD. Monte Carlo estimation of extrapolation of quality-adjusted survival for follow-up studies. Stat Med 1999;18:1627–40.
Johnson BL. Nature, extent, and impact of Superfund hazardous waste sites. Chemo-sphere 1995;31:2415–28.
Lee LJH, Chan CC, Chung CW, Ma YC, Wang GS, Wang JD. Health risk assessment on residents exposed to chlorinated hydrocarbons contaminated in groundwater of a hazardous waste site. J Toxicol Environ Health A 2002;65:219–35.
Lee LJH, Chung CW, Ma YC, Wang GS, Chen PC, Hwang YH, et al. Increased mortality odds ratio of male liver cancer in community contaminated by chlorinated hydrocarbons in groundwater. Occup Environ Med 2003;60:364–9.
Lee LJH, Chen CH, Yao G, Chung CW, Sheu JC, Lee PH, et al. Quality of life in patients with hepatocellular carcinoma received surgical resection. J Surg Oncol 2007;95:34–9. Seed J, Brown RP, Olin SS, Foran JA. Chemical mixtures: current risk assessment
methodologies and future directions. Regul Toxicol Pharmacol 1995;22:76–94. Sung TI, Chen PC, Lee LJH, Lin YP, Hsieh GY, Wang JD. Increased standardized incidence
ratio of breast cancer in female electronics workers. BMC Public Health 2007;7:102. Sung TI, Wang JD, Chen PC. Increased risk of cancer in the offspring of female electronics
workers. Reprod Toxicol 2008;25:115–9.
Taiwan Cancer Registry, with summary information at the website available athttp:// crs.cph.ntu.edu.tw/main.php?Page=N1accessed in April 2009.
Testa MA, Simonson DC. Assessment of quality-of-life outcomes. N Engl J Med 1996;334:835–40.
U.S. Environmental Protection Agency (EPA). Risk assessment guidance for superfund. Human Health Evaluation Manual (Part A, Baseline Risk Assessment). Interim Final, vol. I. Washington, DC: Office of Emergency and Remedial Response; 1989. EPA/ 540/1-89/002.
U.S. Environmental Protection Agency (EPA). Risk Assessment Guidance for Superfund. Human Health Evaluation Manual (Part D, Standardized Planning, Reporting and Review of Superfund Risk Assessments) Final, vol. I. Washington, DC: Office of Emergency and Remedial Response; 2001b. Publication 9285.7-47.
U.S. Environmental Protection Agency (EPA). Risk Assessment Guidance for Superfund. Part A, Process for Conducting Probabilistic Risk Assessment, vol. III. Washington, DC: Environmental Protection Agency; 2001a. EPA/540/R-02/002.
U.S. Environmental Protection Agency (EPA). Integrated Risk Information System database. Available athttp://www.epa.gov/iris/accessed in November 2009. Wang FI, Kuo ML, Shun CT, Ma YC, Wang JD, Ueng TH. Chronic toxicity of a mixture of
chlorinated alkanes and alkenes in ICR mice. J Toxicol Environ Health A 2002;65:279–91.
Yao G, Chung CW, Yu CF, Wang JD. Development and verification of validity and reliability of the WHOQOL-BREF Taiwan Version. J Formos Med Assoc 2002;101:342–51. L.J.-H. Lee et al. / Science of the Total Environment 408 (2010) 1271–1275