Phase Transformation of Zn-4Al-3Cu Alloy during Heat
Treatment
B.J. LI and C.G. CHAO
The phase transformation in Zn-4 Al-3 Cu alloy employing various solution-treatment temperatures (230 7C to 325 7C) was studied by means of microhardness, scanning electron microscopy (SEM), electron probe microanalysis (EPMA), transmission electron microscopy (TEM), and X-ray diffrac-tion (XRD). The starting microstructure of the as-cast Zn-4Al-3Cu alloy consists of an a phase (aluminum-rich, fcc structure) in theh matrix (zinc-rich, h.c.p. structure) prior to solution-treatment. A platelikeεphase with 3-mm length and 0.5-mm thickness was found in the h phase matrix after solution-treating the as-cast material at 2407C for 1 hour. Theεphase was then dissolved gradually back into theh matrix above that temperature. A four-phase transformation, a 1ε →T '1h, was observed from the temperature 250 7C to 310 7C, wherein the T' phase formed at the interface ofε platelet andh phase matrix. This T' phase was further identified as a rhombohedral structure. As the solution-treatment temperature was increased to above 3107C, theεphase was completely dissolved back into theh matrix and numerous b phase particles were distributed uniformly in the h matrix. The b phase subsequently decomposed at room temperature to a fine a phase embedded in the h matrix. For the materials solution-treated above 2507C, the microhardness of theh matrix increased in 40 minutes during natural aging, which was associated with the formation of fineεphase of 0.15-mm diameter. The orientation relationship between this fineεphase andh phase was determined as [ 011]1 h // [ 011]1 ε, (01 2)1 h // (01 2)1 ε.
I. INTRODUCTION
T
HE Zn-4 Al-3 Cu alloy is a widely used commercial material for fabricating various construction parts through die casting. It is also a useful mold material in the trial mold applications for stamping and injection molding. The addition of copper results in an increase of strength of the alloy; however, the material will suffer dimensional insta-bility over a period of time at ambient temperature. The dimensional expansion is related to the copper-richεphase precipitated in theh matrix during aging at slightly elevated temperature after casting.[1]The phase transformations of heat-treated Zn-Al-Cu al-loys have been well investigated in the isothermal process by many researchers, such as Ko¨ster,[2] Gebhardt,[3] and
Murphy.[4] As a result, most of the ternary phase diagrams
were established. The aging of zinc alloys containing 19 to 38 pct Al and 0 to 4 pct Cu take place in the following reac-tions suggested by Savaskan and Murphy[5]and Lo¨bery:[6]
b 1ε →a 1 h at ;276 7C (eutectoid reaction) a 1ε →T '1h at 268 7C (four-phase reaction)
One can see in the preceding reactions that theb phase is unstable at room temperature after quenching. It decom-poses into a and h phases in 10 hours.[5] Some
investiga-tions[4,7]indicated that theεphase was a stable phase at the
B.J. LI, formerly Graduate Student, Institute of Materials Science and Engineering, National Chiao Tung University, is Scientist, Materials Research Laboratories, ITRI, Hsinchu 31015, Taiwan, Republic of China. C.G. CHAO, Professor, is with the Department of Materials Science and Engineering, National Chiao Tung University, Hsinchu 30050, Taiwan, Republic of China.
Manuscript submitted October 27, 1997.
temperature above 2687C and would be replaced by a sta-ble phase T ' during long-time aging below 2687C. In con-trast, Kovacheva et al.[8] found that theε phase dissolved
inh phase above 260 7C through the measurement of dif-ferential thermal electromotive force in Zn-Al-Cu alloy. The crystal structure of T ' phase (58 pct Al, 30 pct Cu, 12 pct Zn) present in the high-aluminum and high-copper zinc alloys was investigated by Arndt and Moeller[9] and
Mur-phy.[10] They had established that T ' has a rhombohedral
structure (a5 8.68 A˚,a 5 27.4 deg) with CsCl-type cells. Most of the investigations were concentrated in the high-aluminum zinc alloys. However, little work has been done on phase transformation of Zn-Al-Cu alloy with lower alu-minum content.
From the equilibrium ternary phase diagram of Zn-Al-Cu alloy,[4]it can be inferred that in Zn-4Al-3Cu alloy, the
h phase (zinc-rich, hcp structure), ε phase (CuZn4, hcp
structure), and a phase (aluminum-rich, fcc structure) are the stable phases below eutectoid temperature. On the other hand, the stable phases areb, h, and ε phases above that temperature.
In the present work, the phase transformations of the pri-maryh phase in an as-cast Zn-4 Al-3 Cu alloy during so-lution-treatment are investigated.
II. EXPERIMENTAL PROCEDURE
The alloy used in this study was Zn-4Al-3Cu alloy. Its alloy composition was analyzed by atomic absorption spec-troscopy. The alloy was melted in vacuum and poured at 4507C into a preheat permanent mold, then aged at room temperature for a period of more than 6 months before so-lution-treatment. The naturally aged specimens were de-fined as ‘‘as-received’’ specimens. For the measurements of electrical resistivity, 0.53 2.0 3 30-mm samples were
Fig. 1—The variations of relative electrical resistivity (Dr/r) and its temperature derivative (d(Dr/r)/dT) from 50 7C to 325 7C for the as-received alloy.
machined from the as-received billets. The electrical resis-tivity of the sample was monitored using a standard four-point probe technique from 50 7C to 315 7C. The as-re-ceived specimens were solution-treated at various temper-atures (from 2307C to 315 7C) for 1 hour in an inert gas atmosphere and then quenched in water.
Microhardness measurement was conducted using a Mi-tutoyo (Kanagawa, Japan) MVK-G1 hardness tester equipped with a Vicker’s diamond pyramid indenter. Scan-ning electron microscopy (SEM) was used to examine the morphology, and electron probe microanalysis (EPMA) was carried out to measure the composition of theh matrix. The phases in the alloys were identified by SIEMENS*
D5000 X-ray diffractometer
*SIEMENS is a trademark of Siemens Electrical Equipment, Toronto.
with nickel - filtered Cu Ka radiation, scanning at a speed
of 0.01 deg and a step time of 20 seconds.
Thin film specimens for transmission election micros-copy (TEM) were prepared by means of a double-jet elec-tropolisher with an electrolyte made up from 30 mL of perchloric acid, 250 mL of 2-butoxyethanel, and 700 mL of ethanol. The polishing temperature was kept between 215 7C and 225 7C, with a current density in the range of 0.3 to 0.7 A/cm2. The TEM analysis was performed on a
JEOL* 2000FX scanning transmission electron microscope
*JEOL is a trademark of Japan Electron Optics Ltd., Tokyo.
operating at 200 kV.
III. RESULT
A. Electrical Resistivity
Figure 1 illustrates the variation of relative electrical re-sistivity (Dr/r) and its derivative with respect to
tempera-ture d(Dr/r)/dT from 50 7C to 325 7C for the as-received alloy. It can be seen that the d(Dr/r)/dT value increases gradually with increasing temperature and then experiences a sudden drop at 250 7C to a value, which remains un-changed between 250 7C to 310 7C except a unique peak at 2887C. Beyond 310 7C, the d(Dr/r)/dT value rises pre-cipitously.
B. X-Ray Diffractograms
The X-ray diffractograms obtained from all the speci-mens are shown in Figure 2. It is clear thatεphase appears in all the solution-treated specimens, in addition toa and h phases, which were originally present in the as-received specimen. The (0002) reflection ofεphase appears at 42.5 deg for the specimen quenched from 2407C. However, an-other reflection of ε phase (indicated by ε* in Figure 2) appears at 42.0 deg for the specimen solution treated above 2407C.
Upon examining the X-ray diffraction (XRD) data, it was found that (0002) reflection ofh phase shifted from 36.4 to 37.1 deg as the solution-treatment temperature was in-creased from 240 7C to 300 7C. The characteristic (433) reflection of the T ' phase appeared at 44.8 deg for both solution-treatment temperatures, 2807C and 300 7C. As the solution-treatment temperature was increased to 3157C, the (002)aand (002)breflections began to appear. These (002)a
and (002)b reflections became more pronounced for the
so-lution treatment extended to 24 hours at 3157C. Figure 3 is an X-ray diffractogram of specimen solution treated at 3157C for 24 hours and aged at room temperature for 90 days. Theb phase disappeared after 90 days of natural ag-ing (compared with Figure 2).
C. Microstructure
Figure 4 shows the backscattered electrons image (BEI) of the as-received material. The contrast in the BEI depends principally on the atomic number of elements present in different phases. It shows the as-cast structure of the nat-urally aged alloy, which consists of primary dendrites (h phase) and eutectic structure ofb and h. The a phase (dark phase) precipitated in h matrix. According to the litera-ture,[1,11]the a phase formed in the central regions of
zinc-rich primary dendrites (h phase) immediately after casting. The micrographs obtained from the specimens solution treated at 2407C and 280 7C are shown in Figures 5 and 6, respectively. Platelike precipitates in h matrix (3-mm length and 0.5-mm thickness) are observed both in Figures 5 and 6. The composition of the platelike precipitate ana-lyzed by EPMA is 84.0 pct Zn-1.0 pct Al-15.0 pct Cu (by weight), which is similar to that of ε phase.[6] The white
phase of irregular shape in the eutectic region was also identified by EPMA to be an εphase. In Figure 6(b), glob-ular precipitates (dark, indicated by an arrow) also exist in addition to theεplatelets.
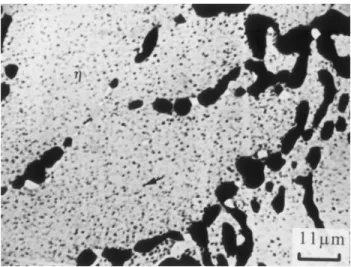
Figure 7 shows the BEI of the specimen solution treated at 3157C 3 24 hours. Numerous spherical particles (indi-cated by an arrow in Figure 7) are uniformly distributing throughout theh matrix without the presence ofεplatelets. When solution-treatment temperature was increased to 350 7C, the lamellar eutectic structure was transformed to
irreg-Fig. 2—X-ray diffractograms of specimens solution treated at various temperatures. It shows the (433)T'peak formed in the specimen solution
treated at 2807C and 300 7C, respectively. The phase indicated byε* is the same structure as theεphase.
Fig. 3—X-ray diffractogram of specimen solution treated at 3157C for 24 h and aging at room temperature for 90 days. It shows that nob phase presents in the specimen.
Fig. 4—BEI of as-received Zn-4Al-3Cu alloy. It shows that the as-cast structure of the naturally aged alloy consists of primary dendrites (h phase) and eutectic structure (b and h).
ularb phase, as shown in Figure 8. In addition, some glob-ularb phase can also be observed in the h matrix.
The compositions of the h phase analyzed by EPMA with various solution-treatment temperatures are listed in Table I.
D. TEM Observation
Figure 9(a) shows that the T ' phase formed at the inter-face betweenεphase andh matrix in the specimen solution treated at 300 7C. In addition, some a phase is also ob-served. Figure 9(b) is the selected area diffraction pattern (SADP) from the [111] zone of T ' phase, indicating the first-order Laue zone (hu1 kv 1 lw 5 1) of the T' phase, which is attributed to the relatively large lattice parameter (a5 8.68 A˚) associated with the rhombohedral structure.[12]
This led to the identification of {001}, as shown in Figure 9(b). Figure 10(a) is a TEM bright-field micrograph of the h matrix pertaining to the specimen solution treated at 280 7C and then naturally aged. It shows numerous precipitates
Fig. 5—Micrograph of the specimen solution treated at 2407C. It shows
εplatelets in theh matrix.
Fig. 7—BEI of the specimen solution treated at 3157C for 24 h. It shows a distribution ofb particles throughout the h matrix.
Fig. 8—BEI of the specimen solution treated at 3507C. It shows irregular b phase instead of lamellar b phase in the eutectic region and some globularb phase presents in the h matrix.
Table I. The Composition ofh Matrix with Various
Solution-Treatment Temperatures Composition (Wt Pct) Al Cu Zn as-received 1.55 0.1 3.85 0.2 94.75 0.2 2407C 3 1 h 1.95 0.1 2.45 0.2 95.75 0.3 2807C 3 1 h 1.45 0.2 3.15 0.3 95.55 0.4 3007C 3 1 h 1.35 0.1 3.35 0.2 95.45 0.2 3007C 3 6 h 1.25 0.1 3.55 0.1 95.35 0.2 3507C 3 1 h 0.55 0.1 4.05 0.1 95.55 0.2 (a) (b)
Fig. 6—(a) Micrograph and (b) BEI of the specimen solution treated at 2807C. It shows that T' phase andεplatelets exist in theh matrix.
in theh matrix. Figures 10(b) and (c) are SADPs from the [1¯011] zone and [2243] zone ofh matrix, which show the precipitate is a hcp structure. Figure 11(a) shows the bright-field TEM image of one of the numerous particles indicated by the arrow in Figure 7. The TEM micrograph shows the particle under high magnification, with a boundary (indi-cated by white triangles) separating itself from theh matrix. It can be seen that there are two phases present in the par-ticle. The SADP (Figure 11(b)) identifies these two phases to be h phase and a phase.
(a)
(b)
Fig. 9—(a) TEM bright-field micrograph derived from the specimen solution treated at 3007C. It shows that the T' phase forms at the interface between theε platelet andh matrix. (b) SADP from [111] zone of T' phase; the first-order Laue zone reflection spots are shown.
(a)
(b)
(c)
Fig. 10—(a) Convention TEM bright-field micrograph derived from the specimen solution treated at 2807C and then natural aged for about 10 days. (b) SADP of [1¯011] zone ofh matrix. The fine precipitate isεphase with the same structure ash phase (hcp). (c) SADP from [ 43] of h22 matrix.
E. Microhardness
Figure 12 shows that the microhardness ofh matrix is increased from HV124 to HV140, which took place in 40 minutes during natural aging after 280 7C solution treat-ment. However, in the case of solution treatment at 2407C; the microhardness was kept unchanged. Figure 12 also shows that both microhardness and time derivative of rel-ative electrical resistivity (d(Dr/r)/dt) show a similar trend during natural aging for the specimen solution treated at 2807C. The maximum microhardness attainable during nat-ural aging for various solution-treatment temperatures is shown in Figure 13. It can be clearly seen that the full potential of the solution plus aging treatment can only be realized for a solution-treatment temperature above 2507C.
(a)
(b)
Fig. 11—(a) TEM bright-field micrograph of a particle (indicated by white triangles) shown in Fig. 7. (b) SADP from the [2110] zone of theh phase; the diffraction spots from the [012] zone of thea phase are shown. It shows the particle ish phase embedded by tiny a phase.
Fig. 12—The microhardness and the time derivative of relative electrical resistivity vs aging time during natural aging for the specimens solution treated at 2407C and 280 7C, respectively.
Fig. 13—The relationship between maximum microhardness of the h matrix attainable during natural aging and solution-treatment temperature.
IV. DISCUSSION
A. Solution Treatment
For the specimen solution treated at lower temperature (2407C), the copper content in theh matrix was decreased from 3.8 pct (as-received) to 2.4 pct (2407C solution treat-ment). The decrease of copper content in h matrix was associated with the formation ofεphase, which was iden-tified by the result of EPMA and further confirmed by X-ray diffractograms in Figure 2.
It is well known that the electrical resistivity of an alloy
is principally influenced by the solute content in the matrix. In Figure 1, one does not see the expected rise of d(Dr/r)/dT between 250 7C and 310 7C, except a peak at 288 7C, which is eutectoid transition temperature. This anomaly can be understood by the following rationaliza-tion. As the solution-treatment temperature was increased from 2507C to 310 7C, the copper content in theh matrix was increased (due to the dissolution of εphase[8]); at the
same time, the aluminum content in theh matrix was de-creased (due to the formation of T ' phase). The effect as-sociated with the increasing copper content on resistivity was balanced off by that associated with the decreasing aluminum content. As a result, relatively constant value of d(Dr/r)/dT was observed in Figure 1. It is also interesting to note that T ' phase was observed to form at the interface between ε phase and h matrix for the specimen solution
treated at 3007C (Figure 9). It is, therefore, speculated that the T ' was formed involving the four-phase transformation, a 1ε → T ' 1 h, in the temperature range of 250 7C to 3107C
For the solution treatments above 3107C, the morphol-ogy of precipitates inh matrix changed entirely. Neitherε platelet nor T ' phase was found in theh matrix. Instead, numerousb particles were seen, as indicated in Figure 7. The b phase decomposed to a and h phases at room tem-perature, as confirmed by TEM (Figure 11). The formation ofb phase (80.1 pct Zn, 28 pct Al, 1.9 pct Cu) resulted in the increase of copper content and the decrease of alumi-num content in theh matrix. There was a rapid increase of the copper content inh phase from 3.1 pct for the specimen quenched from 2807C to 4.0 pct for the specimen quenched from 350 7C (listed in Table I). This was accompanied by the rapid increase of d(Dr/r)/dT above 310 7C. The SEM observation coupled with EPMA analysis demonstrates that theεphase is unstable above 2507C and dissolves rapidly above 3107C. The observation contrasts with the previous work by Murphy,[4] who showed the ε phase is a stable
phase above 2687C. However, the finding of this research is in agreement with that of Kovacheva et al.[8]
B. Natural Aging
As the solution treatment was increased to above 2507C, the fineεphase precipitated in theh matrix rapidly during natural aging due to the highly saturated h matrix with copper. Therefore, this resulted in an increase of micro-hardness. The negative value of d(Dr/r)/dt in Figure 12 indicates that the resistivity of the specimen decreased due to the precipitation of theεphase during natural aging. The SADP (Figure 10(b)) shows that there is a small angle be-tween (011¯1)εand (011¯1)h. The result is similar to the
pre-vious work by Durman and Murphy,[13] who showed that
the fineεprecipitate is semicoherent withh matrix, in ad-dition to (011¯0)ε// (011¯0)h, and [0001]εwas 4.5 deg from [0001]h. The c-axis lattice parameter ofh phase calculated
from XRD data was decreased from 4.93 A˚ for the speci-men quenched from 240 7C to 4.84 A˚ for the specimen quenched from 280 7C. This is believed to be caused by the large misfit of interplanar spacing at [0001] direction ((dε2 dh)/ dh 5 212.4 pct), as suggested by Durman and
Murphy. The c-axis lattice parameter of the fine ε phase (indicated byε* in Figure 2) calculated from the XRD data is 4.30 A˚ , which is larger than that of the regularεphase
(4.25 A˚ ). The increase of c-axis lattice parameter of the fineεphase is believed to be associated with the constraint stress imposed by the semicoherent interface between the fineεphase and h matrix. It is, therefore, concluded that the formation of fineεphase is through the process of pre-cipitation during natural aging after solution-treatment above 2507C.
V. CONCLUSIONS
The phase transformations of Zn-4 Al-3 Cu were studied. The main results obtained from this work are as follows. 1. The ε platelets form with 3-mm length and 0.5-mm
thickness for the specimen solution treated at 2407C for 1 hour.
2. The four-phase transformation,a 1ε →T '1h, occurs for the solution-treatment temperatures from 2507C up to 3107C. Furthermore, the T' phase forms at the inter-face betweenεplatelet andh matrix.
3. As the solution-treatment temperature is increased to above 310 7C, numerousb particles are distributed uni-formly throughout the h matrix. The b phase subse-quently decomposes toa and h during natural aging. 4. As the solution-treatment temperature is increased to
above 250 7C, the microhardness of the h matrix in-creases in 40 minutes during natural aging due to the precipitation of fineεphase.
REFERENCES
1. B.J. Li and C.G. Chao: Metall. Mater. Trans. A, 1996, vol. 27A, pp. 809-18.
2. W. Ko¨ster: Z. Metallkd., 1941, vol. 33, pp. 278-83. 3. E. Gebhardt: Z. Metallkd., 1941, vol. 33, pp. 297-305. 4. S. Murphy: Z. Metallkd., 1980, vol. 71, pp. 96-102.
5. T. Savaskan and S. Murphy: Mater. Sci. Technol., 1990, vol. 6, pp. 695-703.
6. K. Lo¨hberg: Z. Metallkd., 1983, vol. 74, pp. 456-57. 7. E. Gebhardt: Z. Metallkd., 1942, vol. 34, pp. 208-15.
8. R. Kovacheva, R. Dobrev, S. Zadgorski, and A. Lilova: Mater. Charact., 1993, vol. 31, pp. 217-24.
9. H.H. Arndt and K. Moeller: Z. Metallkd., 1960, vol. 51, pp. 596-600. 10. S. Murphy: Met. Sci., 1975, vol. 9, pp. 163-68.
11. M. Durman, K. Sawalha, and S. Murphy: Mater. Sci. Eng., 1990, vol. A130, pp. 247-56.
12. K.W. Andrews, D.J. Dyson, and S.R. Keown: Interpretation of Electron Diffraction Patterns, Rank Precision Industries Ltd., London, 1971, pp. 31-49.
13. M. Durman and S. Murphy: Acta Metall. Mater., 1991, vol. 39, pp. 2235-42.