OBJECTIVE IMAGE QUALITY MEASURE
FOR
BLOCK-BASED DCT CODING
Chi-Min Liu, Member, IEEE, Jine-Yi Lin, Kuo-Guan Wu, and Chung-Neng Wang Department and Institute of Computer Science and Information Engineering
National Chiao Tung University, Hsinchu, 30050, Taiwan E-Mail: cmliu Bcsie.nctu.edu.tw
Abstract-The block-based discrete cosine transform (DCT) coding has been widely adopted in image o r video compression standards, such as R E G and MPEG. Such type of coding will produce a noticeable artifalct known as the blocking effect a t very low bit rate applications. In the literature, there have been various postprocessing methods proposed to reduce the blocking effect. However, there is no suitable objective criterion evaluating the effectiveness of these various methods. This paper presents a new objective measure evaluating the postprocessing methods. The proposed measure also provides an analytical result on the underlying sources of artifacts.
I. Introduction
HE block-based discrete cosine transform (DCT) T c o d i n g is among the most popular transform techniques for image and video compression. It has been adopted in compression standards, such as JPEG and MPEG. Figure 1 shows the block diagram of the block-
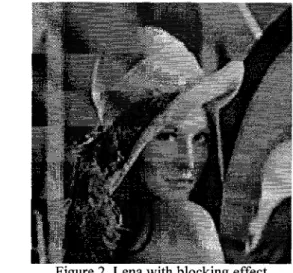
based DCT coding algorithm. Since DCT transform and quantiization steps are applied into each block, individually, quantization errors between blocks are discontinuous [ 6 ] . Such an encoding process will magnify the difference between neighboring blocks. This artifact is more obvious at very low bit rate coding and is known as blocking effect. Blocking effect can be observed from the Lena picture in
Figure 2 that is coded at JPEG standard with quantization scale 2. Besides blocking effect, there are other spatial
artifacts that can be found on the decoded image. But
block,ing effect is the most obvious spatial artifact of the
block-based DCT coding.
Figure 1. Block diagram of block-based DCT coding Since blocking effect degrades the visual quality of
Figure 2. Lena with blocking effect
DCT-compressed images seriously, there have been various postprocessing methods proposed to reduce
blocking effect in the literature [l-121. All the methods are
designed to improve the perceptual quality by smoothing the blocking effect while preserving the edge information
properly. If smoothing operation is applied to improper area, such as edge area, the texture and edge information of the image will be lost and the image looks like blurred. Hence, the effectiveness of one postprocessing method can be subjectively tested from the removing of blocking effect
and the blurring of the image. But, as we known, subjective tests are time consuming and require extensive viewers. Hence, the costs of the subjective tests are too high for the researches that have not developed a good enough method. The objective tests, which give performance based on mathematical numbers, are more efficient than the subjective tests. However, there is no objective criterion that can be used to evaluate the effectiveness on the images from these postprocessing methods. The traditional pixel-based objective measures, such as PSNR or SNR, are not suitable since that these measures can even reflect a result conflicting the subjective measures [l], [3], [4]. In this paper, we propose
a new objective measure BMR (blocking-to-masking ratio) evaluating the postprocessing methods. The measure
512 IEEE Transactions on Consumer Electronics, Vol. 43, No. 3, AUGUST 1997
evaluating the postprocessing methods. The measure provides blocking strength to estimate the improvement on
removing blocking effect and blurring strength to estimate
the degradation of the processed images from these postprocessing methods. The measure will be evaluated to have a consistent result with the subjective measure. Also,
The objective measure provides an analytical result on the underlying sources of artifacts.
11. The New Objective Measure
An objective measure can be evaluated from the following three aspects. First, an objective measure should have a consistent result with the subjective measure or the perceived quality. Second, the objective measure should try to provide an analytical result that is helpful to identifying the underlying sources of artifacts. Third, the relative values of the different measures should match the degree of the psychovisual phenomenon. Unfortunately, like the field in audio and speech processing, there is always no reliable objective measure that can satisfy the above three aspects to tell the quality of the postprocessed images. This difficulty is especially severe for image or video processing because we can not yet find a good psychovisual model that can model numerically the psychovisual effects of human visual system. In the following parts, we will not present a general objective measure for all image or video processing; on the other hand, we will present an objective measure for the block- based DCT coding. We believe the dedicated approach is necessary for the finding the suitable measures. This paper will present a new objective measure based on the above three evaluation aspects.
The basic idea of our measure is that the blocking effect
should result in an intensity varying discontinuities across block boundaries. If the coefficients are coarsely quantized, there should be a difference in the intensity slope change across the block boundaries. If this slope value is larger than original image block, some degree of blocking effect exists. Following this idea, we evaluate the block difference through the following four steps:
Step 1: Evaluating the block difference
Let S(i, j, m, n) be the slope between pixel(m, n) and pixel(m
+
1, n) at block (i, j). Since the block size adopted in JPEG and MPEG is 8x8, the range of m and n is from 0 to 7. Then, the average slope of left boundary of block (i,j) at n (0 5 n 17) is
(1)
SB,
( i , j , n ) = S ( i - l , j , 7 , 1 7 ) ( 2)1
2 >
and the change slope of the left block boundary is
sbfi
( I J , ~ ) = - ( $ ( I - 1,.1,6,n)+ s(l,.~,O,n))Then, the blocking degree in the left side of the block is
We can similarly define the degree from the right side, the top side and the bottom side as
A
Lrigh,(i, j),A
LtOp(i, j), 2ndA
Lotto&
j). The average blocking degree for the block (i, j) is thenStep 2 Including the perceptual effects
We define blocking-to-masking ratio (BMR) value to suitably include the psychovisual phenomenon as follows:
( 5 )
where
A
LJND(i, j) is used as the threshold of the just- noticeable-difference (JND) between the adjacent blocks. The value can be evaluated according to contrast sensitivity model [13]. The model formulates the relation between contrast sensitivity threshold and background luminance. The log operation is intended to translate the contrast sensitivity curve of human visual systems into a linear scale. Finally, the scaling factor 50 is used to adjustthe dynamic range of the measured value.
For this measure, if BMR(i, j) is smaller than 0, this block discontinuity must be invisible and all the corresponding blocks will be ignored.
Step 3: Separating the blocking and blurring measure
If the BMR(i, j) in the original image, labeled as OBMR(i,j), is larger than the BMR(i, j) in the processed image, labeled as PBMK(ij), it means this processed block is blurred after processing, and we group these blocks as BR set. If OBMR(i, j) is smaller, it means the block difference of the processed image are more serious than that of the original image, we group these blocks as BK set. Hence, we define two measure values: blocking
strength and blurring strength and
c
/ O B w i , j ) - pBMR(i, j)lI O B q i , j)
-
p ~j)l ~ i (6) blocking strength = Modr('~')tBKse'NBK 7
c
(7) blodi(i,j)& set blumng strength = N B Rwhere NB, is the number of blocks in the BK set and N,, is the number of blocks in the BK set.
The separating of the measure into the blocking effect
and the blurring effect can provide simultaneously objective test for the two effects arising from the postprocessing, and hence has more analytical results.
Slightly blurred Oversmooth
inferior
Step
4.
Constructing the Single BMR value
At the final step, we combine blocking strength value
and blurring strength value into one single
BMR
value. The single BMR value can be evaluated by the summing of the two strength values:Acceptable < 4 < 9 & > 7 Poor < 6 > 9
Very Poor > 6 > 9 B’MR = blocking strength
+
blurring strength.
(8)The BMR value can be looked as an indicator for the whole image perceived quality.
We also construct a reference table (Table 1) based on this measure to test the image quality on the blocking effect and blurring effect. The table classifies the image quality into six groups: blocky, slightly blocky, smooth, slightly blurred, oversmooth, and Inferior. Each image is
grouped according to the image blocking strength value
and blocking strength value. If the image quality belongs
to blocky, blocking effect should be obviously
discoverable in the image. If the image quality belongs to
slightly blocky, blocking effect should not be obvious and
the image is still acceptably clear. If the image quality belongs to smooth, blocking effect is removed well and the
image quality is still acceptably clear. If the image quality belongs to slightly blurred, the image is slightly blurred,
but the image is still acceptably clear. If the image quality belongs to oversmooth, blurring effect is serious but blockzng effect is not obvious. If the image quality falls in Inferior degree, the image quality is both poor in blocking
effect and in blurring effect. Following this classification, we can easily determine the image quality.
111. Experiment Results
We have evaluated the new criterion through three post- processing methods: space-variant low-pass filtering [3], low-pass filtering, and convex-projection method [4]. The main objective of these methods is to remove blocking effect while preserve edge information properly. We introduce these methods briefly to help understanding the experiment.
In the space-variant lowpass filtering methods, the whole image is divided into edge and nonedge areas. To preserve the edge information, lowpass filtering will be only applied on nonedge areas to reduce blocking effect. In different areas, different low-pass filters are applied.
In the convex projection (CP) methods, convex- projection theory [14] is applied on the decompressed imagle to restore the original image. The theory relies on the prior information of the original image, such as smoothing and edge information on removing blocking effect, to construct appropriate convex sets. Then, the decoimpressed image is processed by iterative projection operations to obtain the restored image [14].
Description Rating Blocking Blurring strength strength Block
< 7 Slightly blocky
I
AcceptableI
> 4 & < 6I
Smooth
I
GoodI
< 4The experiment results are summarized in Table 2 and Table 3. In these tables, “Ql” denotes quantization by the quantization table of JPEG standard; “Ql5” denotes
quantization by the standard table mu!tiplied by the factor 1.5; “Q2” denotes quantization by the standard table multiplied by the factor 2. We can see from Table 2 that lowpass filtering is the best method to reduce blocking effect, but, by comparing the decompressed image (Figure 4) and the lowpass filtered image (Figure 5 , 3 x 3 equal- weight average filter), we can know that it also blurs the image seriously. The corresponding PSNR and SNR value, however, can not reflect these phenomena. In our measure, all the processed images from lowpass filtering have blocking-strength values smaller than others, but their blurring-strength values are all larger than others. In the implementation of the space-variant lowpass filtering
[3], the flat areas are processed by lowpass filtering and
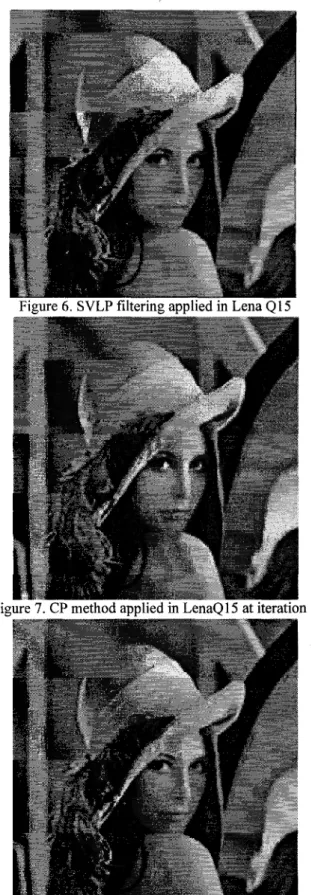
edge areas are left unprocessed. We can see the processed image in Figure 6 that the flat areas are well smoothed, but
the texture or edge areas are still acceptably clear. In the corresponding PSNR and SNR, we only know the quality of the processed images should be within that of the unprocessed images and that of the lowpass filtered images. In our measure, we can find the blocking-strength values and the blurring-strength values of the processed images are all within the values of the unprocessed image and the values of the low-pass filtered.
As to the CP method, we have implemented this method
according to the algorithm in [4]. The evaluation results of all the processed images at each iteration are summarized in Table 3. Figures 7
-
9 show the processed images at iterations 1, 3, and 10. From these images, we can see the difference between each images at each iteration are small, but in some texture areas, such as hat area, we find the smoothing effect disappears gradually and blocking effect becomes more apparently as the iteration number increases. This is due to the fact that smoothing filter is only applied at the first step and, in the iterations, there is no any operation to keep smooth property. In the measures of Table 3, we find that the PSNR or SNR values are stable as iteration number increases. Hence, these two measures can not reveal the visual quality of CP-processed514 IEEE Transactions on Consumer Electronics, Vol. 43, No. 3, AUGUST 1997
images. However, in the proposed BMR measure, result for both the blocking effect and the blurring effect blocking strength approximately increases and blurring of the images due to postprocessing. This measure has strength approximately decreases with the iteration considered the perceptual effect by including the contrast number, which matches the subjective evaluation of these sensitivity model of human vision system, and has been
images. evaluated to have a consistent result with the subjective
measure.
IV. Conclusion
This paper has proposed a new objective measure for block-based DCT coding. The measure gives an analytical
Table 2. LP filter (window size 3 x 3, coefficients are all 0.1 11). SVLP filter (use [3]).
Table 3. Convex-Proiection Method (141). Processed image is Lena015
1. 2. 3. 4. 5. 6. 7. \ L A, U
.
Iteration
1
PSNR(dB)I
SNR(dB)I
(blocking, blurring)I
BMR 1I
30.3183I
25.4846I
(4.5534. 7.1460)I
11.6994References
B. Ramamurthi & A. Gersho, “Nonlinear Space-Variant Postprocessing of Block Coded Images,“ IEEE Transactions on Acoustics, Speech, and
SignalProcessing, pp. 1258-1267. October 1986.
Y. Sung &A. Gersho, “Contour-Based Postprocessing of Coded Images,”
Visual Communications andImge ProcessingIV, pp. 1440-1449.1989.
W. E. Lynch, A. R. Reibman, and B. Liu, “Postprocessing Transform Coded Images Using Edges,” ICASSP , pp. 2323-2326.1995. J.K. Su and R.M. Mersereau, “Postprocessing for Artifact Reduction In PEG-Compressed Images,”
Y.Y. Yang & N.P. Galatsanos, “Iterative Projections Algorithms for Removing The Blocking Artifacts of Block-DCT Compressed Images,’‘
ICASSP, pp. 405408.1993.
S. Minami and A. Zakhor, “An Optimization Approach for Removing Blocking Effects in Transform Coding,” IEEE Transactions on Circuits
andSystems for video Technology, vo1.5, n0.2,
J. Luo, C.W. Chen, K.J. Parker, and T.S. Huang, “A New Method for Block Effect Removal In Low Bit-Rate Image Compression,” ICASSP. 1994. ICASSP , pp. 2363-2366. 1995. pp. 74-81. April 1995. 8. 9. 10. 11. 12. 13. 14.
H.C. Reeve I11 and J.S. Lim, “Reduction of Blocking Effects in Image Coding,” OpticalEngineering, pp. 34-37. JanuaryFebmary 1984. T. S. Liu, L. W. Chang, “An Adaptive Temporal-Spatial Filter for MPEG Decoded Video Signals,” Multidimensional Systems and Signal
Processing, 110.6, pp.251-262, 1995.
J. M. Boyce, “Noise Reduction of Image Sequence Using Adaptive Motion Compensated Frame Averaging,” Proc. ICASSP, pp. 111.46 I - III.464,1992.
R. Homg and A. J. Ahumada, “A Fast DCT Block Smoothing Algorithm,” Viswl Communication, SPIE, pp. 28-39, 1995.
L. Yan, “A Nonlinear Algorithm for Enhancing Low Bit-Rate Coded Motion Video Sequence,” IEEE Transactions on Acoustics, Speech, and Signal Processing, pp. 923-921, 1994.
C. H. Chou and Y.C. Li, “A Perceptually Tuned Subband Image Coder Based on the Measure of Just-Noticeable-Distortion Profile,”
Transactions on Circuits and Systems for video Technology, vo1.5, no.6,
pp. 467476, December 1995.
H. Stark, Image Recovery - Theory and Application, Chapter 2, Academic press, 1986.
Figure 3 . Original Lena
I
Fig
Figure 4. Lena0 15
3 Figure 8.CP method applied in LenaQ15 at iteration
1 1
= 3 equal-weight average filter)
516 E E E Transactions on Consumer Electronics, Vol. 43, No. 3, AUGUST 1997
Figu = 10
Biographies
Chi-Min Liu received the B.S. degree in Kuo-Guan Wu received the B S. degree in electrical engineering from Tatung Computer Science and Information Institute of Technology, Taiwan, R.O.C. Engineering from National Chiao-Tung in 1985, and the M.S. degree and Ph. D. University, Hsinchu, Taiwan, in 1991. He is degree in electronics from National Chiao currently working toward the ph.D. degree. Tung University, Hsinchu, Taiwan, in His research interests include target tracking,
1987 and 1991, respectively. adaptive filters, speech coding and image Professor of the Department of Computer
Science and Information Engineering, National Chiao Tung University, Hsinchu, Taiwan. His research interests include
He is currently an Associate restoration.
video/audio compression, speech recognition, radar processing, and application-specific VLSI architecture design.
Jine-Yi Lin graduated from the Department of Computer Science and Information Engineering, National Chiao Tung University (NCTU), Taiwan, R.O.C., in 1995. He is now a master student in the Institute of Computer Science and Information Engineering, NCTU. His current research interests are image and video compression.
Chung-Neng Wang was born in Pingtung, Taiwan, in 1972. He graduated from the Department of Computer Science and Information Engineering, National Chiao Tung University (NCTU), Taiwan, R.O.C., in 1994. He is now pursuing his ph.D. degree in the Institute of Computer Science and Information Engineering, NCTU. His current research interests are videohmage compression and artificial intelligence.
![Table 2. LP filter (window size 3 x 3, coefficients are all 0.1 11). SVLP filter (use [3])](https://thumb-ap.123doks.com/thumbv2/9libinfo/7702690.144997/4.910.148.837.253.755/table-lp-filter-window-size-coefficients-svlp-filter.webp)