Research into two source-based control algorithms for
Internet traf®c ¯ows
Chyan Yang*, Chen-Hua Fu
Institute of Information Management, National Chiao Tung University, MB 307, 1001 Ta Hsueh Road, Hsin Chu 300, Taiwan, ROC Received 17 April 2000; revised 9 January 2001; accepted 11 January 2001
Abstract
TCP and UDP are the major applications over the Internet, the characteristics of them lead to different network transmission behaviors. Two source-based mechanisms are proposed in this paper to regulate TCP and UDP ¯ows. One is the congestion control mechanism, which uses TCP ¯ows' congestion signal to regulate the ¯ows at the source node. The other is the time slot mechanism, which is a time-sharing application to control their ¯ow transmission. Based on the priorities of ¯ows, different bandwidth proportions are allocated and differential services are provided for ¯ows. Several scenarios are simulated to observe the transmission operations of these two mechanisms. Simulation results show some insights into two mechanisms. Moreover, the several simulation parameters that may impact the performance of these two mechanisms are summarized. q 2001Elsevier Science B.V. All rights reserved.
Keywords: Differential service; Network congestion; Congestion control mechanism; Time slot mechanism; Priority; Transmission performance
1. Introduction
The TCP and UDP are the two major protocols over the Internet. These two protocols have different transmission operations. TCP is connection orientated whereas UDP is connectionless. TCP uses `slow start' mechanism [2] as the end-to-end congestion control mechanisms to prevent network congestion. UDP simply uses `store and forward' mechanism to transfer its data. If there is no proper control mechanism to handle UDP's transmissions, UDP traf®c will share most of the bandwidth over the Internet. These characteristics of TCP and UDP lead to different network transmission behaviors. The drop-and-run UDP is unfavor-able to self-controlled TCP when the proportion of UDP is relatively higher than that of TCP.
Since most of the Internet applications are based on TCP, the performance of TCP will impact the Internet ef®ciency. How to improve the TCP transmission performance and restrict too much bandwidth shared by UDP transmissions is the focus of this study. In this study, a differential service mechanism is proposed to handle the transmission of TCP and UDP traf®c. Priority setting for each TCP or UDP trans-mission ensures each ¯ow gets the different bandwidth
share. The higher the priority is, the better the performance gets.
Two ¯ow control mechanisms are proposed to control the TCP and UDP traf®c transmissions in this study. One is a congestion control mechanism. It uses the TCP traf®c congestion signal and the priority of each ¯ow to control the transmissions. The other is a time slot control mechan-ism. According to the priority of each ¯ow, the different amount of time slots is assigned. Network simulator ns-2 [1] is used to simulate the traf®c transmission operations of these two mechanisms. Simulation results indicate that both of the two control mechanisms can provide a differential service for the larger transmission data, such as 1MB, and the congestion control mechanism has a better transmission performance than the time slot mechanism. Moreover, some factors, such as queueing disciplines and parameter settings, may impact the performance of the proposed control mechanisms.
2. Analysis of TCP/UDP traf®c transmission
The transmission protocols of TCP and UDP are quite different. The difference between TCP and UDP calls for different transmission behaviors and, therefore, they have different transmission performance over the Internet.
TCP is a connection-oriented protocol and it uses the `slow start' mechanism [2] to control the traf®c transmission Computer Communications 24 (2001) 1661±1672
www.elsevier.com/locate/comcom
0140-3664/01/$ - see front matter q 2001Elsevier Science B.V. All rights reserved. PII: S0140-3664(01)00311-5
* Corresponding author. Tel.: 1886-3-5712121, ext. 57407/57417; fax: 1886-3-5723792.
E-mail addresses: [email protected] (C. Yang), [email protected] (C.-H. Fu).
and response the network congestion. UDP is a connection-less protocol and it has no congestion control mechanism to response to network congestion. When the network is congested, an extreme unfairness situation exists among TCP/UDP ¯ows: the bandwidth should be shared by the TCP ¯ows, which are occupied by the UDP ¯ows. This unfairness results from responsive and irresponsible ¯ows competing for bandwidth. The UDP ¯ow effectively `shuts out' the responsive TCP traf®c [3].
In this study, two simple simulation scenarios are established with the ns-2 network simulator [1] to observe the transmission situation of TCP and UDP traf®c. The network topology is shown as Fig. 1. The S1, S2, D1 and D2 are the source and destination nodes. There are four TCP ¯ows and three UDP ¯ows from S1to D1, and three TCP ¯ows and UDP ¯ows from S2 to D2. Each TCP ¯ow uses FTP traf®c as its traf®c source, whereas the traf®c source of each UDP ¯ow is the constant bit rate traf®c.
The ®rst simulation scenario is that each TCP/UDP ¯ow transmits the assigned data size simultaneously. The length of assigned data size is from 10 KB to 100 MB. The simula-tion results of the transmission time of each TCP and UDP ¯ow are listed in Table 1. Table 1 shows that all transmis-sion time of the UDP ¯ows are shorter than the TCP ¯ows and the transmission performance differences between TCP
and UDP ¯ows increase as the transmission size increases. This phenomena shows that the UDP ¯ows always have larger shares of bandwidth than that of TCP ¯ows and there-fore receive a better transmission performance. On the other hand, TCP ¯ows regulate their transmission by the `slow start' mechanism when the network is congested; they do not transmit packets until UDP ¯ows ®nish their transmission. This is a reason why the TCP ¯ows have the longer trans-mission time than the corresponding UDP ¯ows.
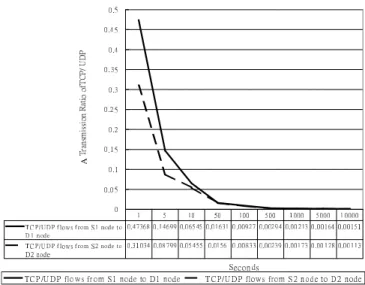
The second simulation scenario is that the TCP/UDP ¯ows have a same period to transmit traf®c and record the traf®c sizes they transmitted. This simulation tries to record the transmission size of the TCP/UDP ¯ows in a same period. The range of a simulation transmission period is 1±10000 s and nine timer checkpoints are selected to collect the transmission size of the TCP/UDP ¯ows. Fig. 2 shows the results of this simulation; the ratio variability of band-width shared by TCP ¯ows and UDP ¯ows.
S 1 S 2 n 1 n 2 n 3 D 1 D 2 B a n d w id th : S 1 - n 1 1 0 M B p s S 2 - n 1 1 0 M B p s n 1 - n 2 -n 3 1 M B p s n 3 - D 1 1 0 M B p s n 3 -D 2 1 0 M B p s
Fig. 1. A topology of simulation scenario.
Table 1
A listing of transmission performance of TCP/UDP ¯ows (Unit: second)
Flows Size 10 KB 100 KB 1 MB 10 MB 100 MB S1 to D1 TCP1 2.6 13.5 122.9 1080.1 10462.1 TCP2 2.7 14.7 121.7 1066.7 10475.8 TCP3 2.7 16.4 207.5 1089.9 7488.9 TCP4 2.7 14.8 121.8 1073.1 10436.5 UDP10.8 5.0 48.5 474.7 4769.6 UDP2 1.4 6.0 48.0 480.8 4794.8 UDP3 0.7 5.3 48.1481.0 4802.3 S2 to D2 TCP5 2.6 14.5 122.8 1079.1 10482.2 TCP6 2.7 14.6 124.8 1080.7 9851.1 TCP7 2.8 15.5 129.9 710.3 7544.9 UDP4 0.8 4.2 46.5 479.2 4797.0 UDP5 0.6 3.2 47.8 480.5 4782.4 UDP6 0.9 5.149.2 471.6 4788.6 A
The curves in Fig. 2 show the ratio of bandwidth shared by TCP ¯ows and UDP ¯ows that is inversely changed as the transmission period increases. The curves also show that the bandwidth share of TCP ¯ows drop dramatically from the ®rst second to the 50th second, and the bandwidth share of TCP ¯ows is less than 1% after the 100th second. These results show exactly why the UDP ¯ows have the better performance than the TCP ¯ows in the ®rst simulation scenario, because most of bandwidth is shared by the UDP ¯ows during the transmission period.
The results from the second simulation demonstrate that the TCP ¯ows have a higher bandwidth share at the begin-ning of a transmission period because the network is not so congested. When the UDP ¯ows continue to send their packets on the network, gradually the network congestion becomes even more congested. The TCP ¯ows continue to responsd the network congestion by reducing their transmis-sion rates, and their bandwidth shares continue to decrease. If the UDP ¯ows keep their traf®c transmission, UDP traf®c will receive more bandwidth share. This in turn will cause TCP ¯ows to continue slowing down TCP transmissions and the bandwidth share of TCP is going lower than that of UDP.
The above two simulation results show that an unfairness situation exists between the transmissions of the TCP ¯ow and the UDP ¯ow. So it is obvious that a proper control mechanism is needed to regulate the transmission of UDP ¯ow and prevent the bandwidth share overused by the UDP ¯ows. This is why the two source-based [4] ¯ow control mechanisms are studied here.
3. Source-based ¯ow control mechanisms
Generally speaking, traf®c management or bandwidth control is a mechanism that treats different users or ¯ows differently Ð ranging from simple Weighted Fair Queueing
to RSVP and per-session traf®c scheduling.1,2 Most proposed differential service mechanisms involve the capability of the gateways on a routing path and these mechanisms need gateway devices to support their opera-tions.
In this study, two source-based ¯ow control mechanisms are compared: the congestion control mechanism and the time slot mechanism. Both mechanisms use a priority of ¯ows to regulate the utilization of network bandwidth. Priority overwrites the types of protocols. That is, the prior-ity 1of UDP traf®c takes higher preference to the priorprior-ity 2 of TCP traf®c. For the same type of protocol, priority deter-mines the preference.
3.1. Congestion control mechanism
The congestion control mechanism is a source-based ¯ow control mechanism. It operates at the source node, when it detects the network congestion, it reacts with a slower trans-mission, hoping not to worsen the network congestion. The idea of this control mechanism comes from the character-istics of TCP and UDP ¯ows and the simulation results from [3]. If the congestion signal from TCP ¯ows can be used as a congestion indicator for the source node, this could help the source node control the TCP and UDP traf®c transmissions. When the transmission path is congested, the source node can stop the transmissions of lower priority ¯ows and let higher priority ¯ows keep their transmissions. With regu-lated transmission, higher priority ¯ows can have better transmission performance.
Depending on the importance and time constraint of a transmission, network administrators may assign a proper transmission priority to TCP/UDP ¯ow at the source nodes. A time critical ¯ow can receive a higher transmission prior-ity than otherwise. The congestion control mechanism C. Yang, C.-H. Fu / Computer Communications 24 (2001) 1661±1672 1663 Start the permitted
TCP/UDP flows transmission
Check congestion at the source end Check maximum priority
of TCP/UDP flows
Stop lower priority UDP and TCP flows
transmission
Start higher priority UDP and TCP flows
transmission
Priority aging process for transmitting flows
Yes No
Each flow get its time slot number according to its priority
According to its time slot number, each flow transmits its packets
in a round robin scheduling
Priority aging process for transmitting flows
Fig. 4. A diagram of time slot mechanism.
Fig. 3. A diagram of congestion control mechanism.
1 URLhttp://www.ietf.org/html.charters/diffserv-charter.html. 2 URLhttp://diffserv.lcs.mit.edu/.
collects ¯ows' priority information. TCP and UDP ¯ows can concurrently transmit their packets. The diagram of the congestion control mechanism is shown in Fig. 3. 3.2. Time slot mechanism
The time slot mechanism is a time-sharing application that divides bandwidth into many transmission units (time slot). Each transmission unit is a time slot. In each time slot, the source node only allows one ¯ow to transmit its packets and this ¯ow can use all available bandwidth as much as it can. All other ¯ows must yield the right of way. How many time slots can a ¯ow get? It depends on the priority, assigned by network administrators at a source node, of a ¯ow.
A round robin scheduler is used by the time slot mechan-ism to arrange each ¯ow's transmission. A high priority ¯ow receives more time slots than otherwise and therefore receives the required bandwidth. In other words, the UDP ¯ows can no longer occupy the bandwidth share irrespon-sibly. Moreover, the transmission performance of each ¯ow can be ensured with its priority. The diagram of time slot mechanism is shown in Fig. 4.
Both of the congestion control and time slot mechanisms can regulate the TCP and UDP ¯ow transmissions. Fig. 5 is a snapshot of bandwidth utilization with these two mechanisms. 4. A simulation of congestion control and time slot mechanisms
Several simulation scenarios are simulated to illustrate the operations of these two mechanisms. With the simula-tion results, one can obtain some transmission performance about these two mechanisms. We also investigated the factors that may affect the algorithms.
The Network Simulator Ð ns (version 2 beta release 5) [1,5] is used as the simulation tool. The simulation topology is same as Fig. 1. A number of TCP/UDP ¯ows are
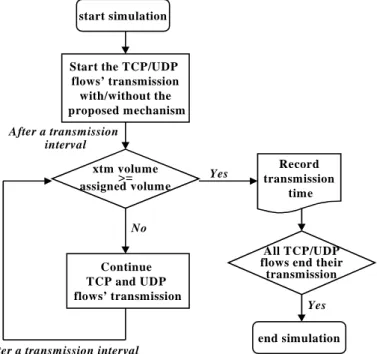
simu-lated to transmit packets from the S1and S2 source nodes to the D1and D2 destination nodes. Fig. 6 shows the transmis-sion procedure in each simulation scenario.
The ratio of Internet TCP/UDP ¯ow is basic to our simulation scenarios. From the MCI/NSF's very-high-performance Backbone Network Service (vBNS) project,3 one can ®nd the ratio of TCP/UDP ¯ows is 90:10. Based on this, with 100 ¯ows, the TCP may vary from 81 to 99 whereas UDP varies from 19 to 1 during simulation. With different TCP/UDP ¯ow combinations, the transmission performance of the proposed mechanisms can be analyzed further. The transmission size is another factor that may impact the transmission behavior of ¯ows. The 10 KB and 1MB are the two transmission lengths that are used as the sources of TCP/UDP ¯ows in the simulation scenarios.
For a differential service simulation, six bits in IP header are reserved to indicate the priority of the ¯ow [6,7]. These six levels of priorities are available in both proposed mechanisms. For the congestion control mechanism, priority is used to determine whether a ¯ow continues its transmission when the network is congested. For the time slotmechanism,priority is used to determine the number of time slots allocated for a ¯ow. Let P denote the priority of a ¯ow where P 1; 2; ¼; 6: Let tsn(P) denote the number of time slots assigned to a ¯ow with priority P. A binary bandwidth allocation of tsn(P) can be de®ned as tsn(P) 2Ã(9 2 P). Therefore, the difference between tsn(i) and tsn(j) is u2i2 2ju. The time slot mechanism assigns 256 time slots as the round robin transmission time to the highest priority ¯ow P 1: A lowest priority ¯ow P 6 will receive only 8 time slots as its round robin transmission time. In this research, four level priorities are assigned to the TCP ¯ows. Let TCPidenote a TCP ¯ow of priority i. Two priorities, 3 and 4, are assigned to the UDP ¯ows. Let UDPi denote a UDP ¯ow of priority i.
Queueing disciplines are also important since they may T C P 1 T C P 2 U D P 1 … T C P 1 T C P 2 U D P 1 .. Bandwidth allocation in the time slot
mechanism Bandwidth allocation in
the congestion control mechanism Available bandwidth TCP 1 TCP 2 UDP 1 TCP 3 UDP 2 A congestion signal issued from TCP flows
TCP 1 TCP 2 TCP 3 UDP 1
A snapshot of bandwidth allocation in the congestion control mechanism
A snapshot of bandwidth allocation in the time slot mechanism Fig. 5. Bandwidth allocations of congestion control and time slot mechanisms.
impact the transmission performance of the two proposed control mechanisms. In our simulations, four different queueing disciplines: FCFS (First Come First Serve), SFQ (Stochastic Fair Queue) [8], RED (Random Early Detection) [9] and DRR (De®cit Round Robin) [10] are implemented to schedule network applications' transmissions.
The congestion control mechanism and time slot mechan-ism may coexist with other transmission control mechanmechan-isms and with the best-effort traf®c. Co-working with a different control mechanism, the proposed mechanisms may have a different transmission performance. Table 2 illustrates the ®ve different simulation environments. Table 3 summarizes key parameters in the simulation scenarios.
5. Results and analysis
Transmission size, queueing disciplines, TCP/UDP ratios, environment settings and parameter settings are the major parameters used for the simulation. Based on these parameters, several simulation results are observed and analyzed.
5.1. Sensitivity to transmission size
Two different sizes of data transmission, 10 KB and 1MB, are used to measure the size sensitivity of the conges-tion control mechanism and the time slot mechanism. The simulation results show the congestion control mechanism provides a differential service for 10 KB TCP/UDP ¯ows. But, there are cases that the transmission performance is inconsistent with their transmission priorities. For 1MB TCP/UDP ¯ows, the congestion control mechanism provides
a signi®cant differential service among the TCP/UDP ¯ows. In cc/cc and cc/be transmission environments, most of the 1MB TCP/UDP ¯ows receive a different transmission performance based on their transmission priorities. That is, the priority of the ¯ow indicates the transmission performance.
Likewise, the differential service transmission behaviors only occur in the 1MB TCP/UDP ¯ows in the ts/ts and ts/be transmission environments. But, when the transmission size C. Yang, C.-H. Fu / Computer Communications 24 (2001) 1661±1672 1665
start simulation
Start the TCP/UDP flows’ transmission with/without the proposed mechanism xtm volume >= assigned volume Record transmission time Continue TCP and UDP flows’ transmission
After a transmission interval After a transmission
interval
No
Yes
All TCP/UDP flows end their
transmission
end simulation
Yes
Fig. 6. A ¯ow chart of simulation scenario.
Table 2
Speci®cation of the ®ve transmission environment settings
Let cc(Si, Dj) denote the congestion control mechanism applied to the ¯ows from source Sito destination Dj; Let ts(Si, Dj) denote the time slot mechanism applied to the ¯ows from source Sito destination Dj; Let be(Si, Dj) denote best-effort traf®c applied to the ¯ows from source Sito destina-tion Dj
Environment settings Purpose 1. cc(S1, D1) and cc(S2, D2): cc/
cc To simulate a transmissionenvironment controlled by the congestion control mechanism 2. ts(S1, D1) and ts(S2, D2): ts/ts To simulate a transmission
environment controlled by the time slot mechanism 3. cc(S1, D1) and be(S2, D2): cc/
be To simulate a transmissionenvironment controlled by a congestion control mechanism and a best-effort traf®c mechanism
4. ts(S1, D1) and be(S2, D2): ts/
be To simulate a transmissionenvironment controlled by a time slot mechanism and a best-effort traf®c mechanism 5. be(S1, D1) and be(S2, D2): be/
be To simulate a transmissionenvironment controlled by the best-effort traf®c mechanism
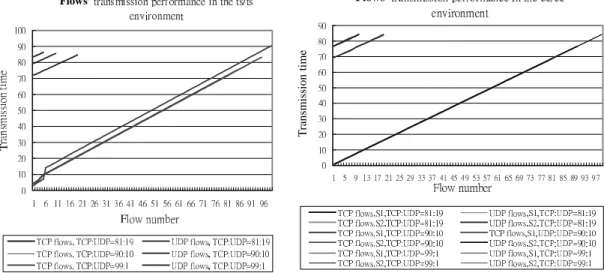
is of 10 KB, a ®rst-come-®rst-serve transmission behavior exists in each TCP/UDP ¯ow's transmission in the ts/ts and ts/be environments. This ®rst-come-®rst-serve transmission behavior of the time slot mechanism causes the ®rst trans-mitted ¯ow to receive the best transmission performance since there is no waiting. However, the last transmitted ¯ow gets the worst transmission performance. Fig. 7 shows that the total transmission time required is linearly proportional to the number of ¯ows. In the ts/ts setting, since the ¯ows start to transmit at the equal spacing of time slots, various ratios of TCP/UDP produce same straight lines and overlays as in Fig. 7.
Fig. 7 also shows that the ts/ts and ts/be settings cannot work properly to provide a differential service for TCP/UDP ¯ows when the transmission size is relatively small to each assigned time slot. Comparing with the congestion control mechanism, the time slot mechanism is more sensitive to a transmission size.
5.2. Differential service operations in the control mechanisms
Table 4 shows the summary of average transmission performance of ¯ows from the S1source node to the D1 destination node and the S2 source node to the D2 destina-tion node. These ¯ows are cc, ts or be. In each of the environment settings, four queueing disciplines (FCFS, DRR, RED and SFQ) are used. The transmission size of
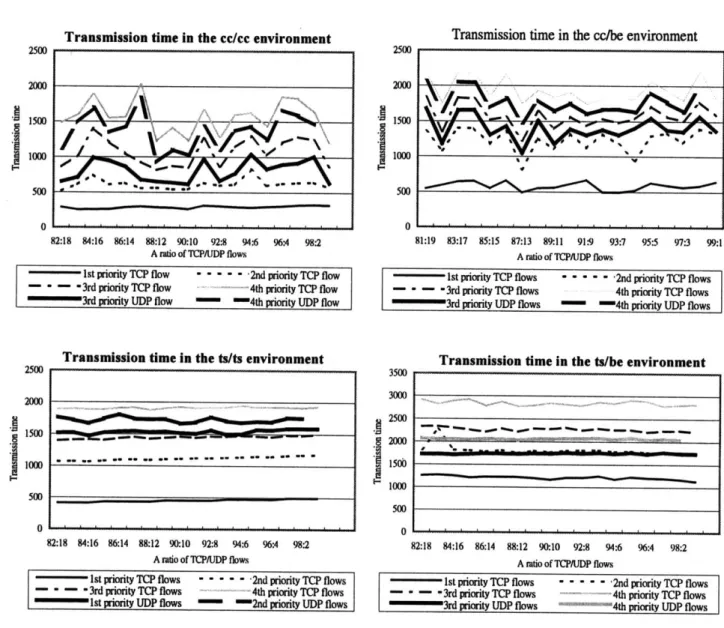
each ¯ow is of 1MB. Fig. 8 shows the average transmission performance of TCP/UDP ¯ows with the FCFS queueing discipline in different transmission environments. Table 4 and Fig. 8 show differential service operations that are provided by the congestion control and time slot mechan-isms and the higher transmission priority ¯ows get better transmission performance than the lower transmission priority ¯ows.
Fig. 8 also shows the simulated results of various ratios of TCP/UDP data ¯ows. The line charts in Fig. 8 demonstrate the variations of transmission performance of TCP/UDP ¯ows as the TCP ¯ow number increases and the UDP number decreases. From the transmission performance line charts' ¯uctuations, there is no obvious evidence show-ing there is a relationship between a ratio of TCP/UDP ¯ows and their transmission performance. A ratio of TCP/UDP does not impact a differential service operation that is supported by the congestion control and time slot mechanisms. 5.3. Transmission performance of the control mechanisms
Table 4 clearly shows that the congestion control mechanism in each case outperforms the time slot mechan-ism. This simulation result may result from the following three reasons: (1) in the ts/ts environment, the time slot mechanism might suffer from underutilization since the required burst bandwidth is smaller than the time slot assigned; (2) most of the bandwidth in the ts/be environment Table 3
A summary of key simulation parameters
Parameter name Number of alternatives
1. Transmission size 2 (10 KB, 1 MB) 2£5£4 40
2. Environment setting 5 (see Table 2)
3. Queueing discipline 4 (FCFS, SFQ, RED, DRR)
4. TCP/UDP ratio 19 (81:19,¼,99:1) 19£2£100 3800 5. Traf®c sources 2 6. TCP/UDP ¯ows 100 (81 1 19, ¼,99 1 1) Flows’ F T Flows’ T ransmission time
C. Yang, C.-H. Fu /Compute r Communi cations 24 (2001) 1661 ±1672 1667 Table 4
Average TCP/UDP ¯ows' transmission performance
1. In cc/cc, ts/ts, cc/be and ts/be, ¯ows in source traf®c 1are regulated by control algorithms; 2. In be/be, ¯ows in source traf®c 1are best effort ¯ows; 3. In cc/cc and ts/ts, ¯ows in source traf®c 2 are regulated by control algorithms; 4. In cc/be, ts/be and be/be, ¯ows in source traf®c 2 are best effort ¯ows; 5. Unit: seconds
Transmission environment Queueing discipline Flows' priority
Source traf®c 1Source traf®c 2
TCP1 TCP2 TCP3 TCP4 UDP3 UDP4 TCP1 TCP2 TCP3 TCP4 UDP3 UDP4
cc/cc (a pure congestion control mechanism environment) FCFS 290.39 612.04 1084.67 1581.06 802.65 1390.16 303.58 688.02 1228.05 1661.27 961.70 1450.27 DRR 250.98 735.68 1626.65 2459.73 1197.29 2037.99 264.20 790.87 1623.42 2423.65 1191.06 2033.07 RED 258.35 653.51 1244.00 1678.98 1025.00 1484.29 260.94 596.36 1068.91 1541.42 856.28 1326.45 SFQ 276.19 588.35 1201.76 1697.74 1050.77 1602.53 285.77 680.83 1236.64 1724.79 1103.02 1613.02 ts/ts (a pure time slot
mechanism environment) FCFS 450.42 1114.75 1447.57 1910.88 1533.65 1719.07 450.72 1114.60 1452.96 1910.29 1515.99 1723.58 DRR 451.61 1115.23 1438.84 1889.38 1527.89 1726.63 451.81 1118.65 1442.59 1893.43 1535.82 1731.57 RED 454.44 1147.63 1479.98 1928.71 1421.80 1653.31 459.33 1140.56 1481.73 1927.36 1425.11 1653.11 SFQ 451.09 1114.12 1438.51 1902.18 1529.15 1748.05 451.29 1117.36 1449.24 1880.19 1556.94 1756.44 cc/be (a mixed congestion
control mechanism environment) FCFS 582.19 1232.33 1585.42 1937.91 1402.76 1758.36 754.87 722.30 767.47 752.26 80.17 84.51 DRR 579.35 1979.88 2679.95 3318.67 2305.03 3047.99 993.82 1003.11 1003.19 1079.70 88.41 89.87 RED 579.52 1158.97 1551.12 1932.87 1387.72 1748.04 625.81 634.59 642.28 641.01 81.02 84.95 SFQ 483.67 1187.39 1613.88 1994.12 1486.93 1941.99 718.41 709.83 722.19 704.19 148.70 148.03 ts/be (a mixed time slot
mechanism environment) FCFS 1214.91 1787.47 2265.74 2840.17 1741.27 2058.57 593.68 588.24 586.53 590.25 79.95 83.20 DRR 1048.57 1637.40 2145.01 2687.73 1743.89 2078.98 761.24 774.40 743.56 800.43 90.62 92.28 RED 1178.34 1750.06 2237.68 2760.54 1704.01 2015.05 528.78 533.03 526.32 532.72 80.41 84.41 SFQ 1180.96 1768.99 2272.46 2880.33 1745.17 2045.72 559.36 560.88 556.00 537.61 152.49 151.82 be/be (a pure best-effort
traf®c environment) FCFS 1004.34 1030.48 1000.94 1029.12 145.64 151.82 1111.01 1118.17 1126.82 1141.71 139.29 146.16 DRR 1907.32 1997.61 1924.30 2023.77 157.10 173.75 1626.96 1707.24 1614.93 1706.87 164.29 164.99 RED 930.06 947.05 890.14 975.90 159.14 166.73 961.78 957.40 984.74 996.37 158.44 166.88 SFQ 1068.02 1060.22 1056.63 1049.85 240.06 277.87 1086.83 1056.28 1057.76 1052.27 257.96 256.47
may be taken by best-effort traf®c, only a little bandwidth available for the time slot mechanism to regulate the ¯ows' transmission; (3) the congestion control mechanism always keeps higher priority ¯ows to take the bandwidth whenever possible.
Fig. 9 shows ¯ows' transmission performance in the cc/ cc, ts/ts, cc/be and ts/be environments. In Fig. 9, the thin line charts represent the transmission performance of cc/cc and cc/be ¯ows and the thick line charts represent the transmis-sion performance of ts/ts and ts/be ¯ows. From these two group line charts, they clearly show the ¯uctuations of trans-mission performance of ¯ows with the different TCP/UDP ratios. Although there is no signi®cant relationship between transmission performance and a TCP/UDP ratio, Fig. 9 shows the transmission performance ¯uctuations of the cc/ cc and cc/be ¯ows are larger than ts/ts and ts/be ¯ows. Therefore, this means that the time slot mechanism is rela-tively more stable and predictable than the congestion
control mechanism with the different TCP/UDP ratios, although the time slot mechanism is slower than the conges-tion control mechanism.
In addition, Table 4 also shows that UDP3 has better performance than that of TCP3, and UDP4has better perfor-mance than that of TCP4. With the same transmission prior-ity, UDP ¯ows would outperform TCP ¯ows. Therefore, by assigning a lower priority to UDP ¯ows, when they are not time critical, assures that TCP ¯ows transmit before UDP ¯ows.
5.4. Transmission priority level of the ¯ows
The transmission performance of these two control mechanisms in the cc/be and ts/be environments is interest-ing. From the cc/be and ts/be row blocks of columns in the Source traf®c 1in Table 4, one can ®nd that the congestion control mechanism has a better transmission performance Fig. 8. Differential service operations of the cc/cc, cc/be, ts/ts and ts/be environments.
than that of the time slot mechanism when they operate with best-effort ¯ows. Except that the cc/be TCP1¯ows are better than all the be/be TCP ¯ows, the transmission performance of cc/be TCP2, TCP3and TCP4is worse than the correspond-ing be/be TCP ¯ows. Only the cc/be TCP1¯ows get a guar-anteed service. In other words, there is no need to have too
many priority levels in a differential service mechanism. Two levels are enough. A high priority ¯ow will receive a guaranteed service and has a better performance than ¯ows of lower priorities. On the other hand, the low priority or the best-effort ¯ows will compete for bandwidth left by ¯ows of the highest priority.
C. Yang, C.-H. Fu / Computer Communications 24 (2001) 1661±1672 1669
5.5. A relationship among the control mechanisms, transmission performance and queueing disciplines
Table 4 shows that the transmission performance is not too sensitive to the queueing disciplines. The queueing disciplines, however, do impact the transmission perfor-mance when different priorities are imposed on the traf®c. Several observations from Table 4 are listed in Table 5.
Table 5 shows there is no signi®cant relationship among control mechanisms, transmission performance and the queueing disciplines. But several simulation results are interesting: (1) all cc/be, ts/be, be/be UDP ¯ows with the FCFS queueing discipline receive the best transmission performance; (2) the DRR queueing discipline favors ts TCP ¯ows and does not favor cc and be TCP ¯ows. The cc and be TCP ¯ows, except TCP1 ¯ows, get the worst transmission performance in the cc/cc and be environments; (3) the RED queueing discipline favors all cc/be, ts/be and be/be TCP ¯ows. The UDP ¯ows with the RED queueing discipline also receive good transmission performance; (4) all UDP ¯ows with the SFQ queueing discipline have poor transmission performance.
Table 6 shows the standard deviation of transmission time corresponding to ¯ows shown in Table 4. By examining the column source traf®c 1in Table 6, one can ®nd the follow-ing observations: (1) the standard deviation value of trans-mission performance of the cc/cc and cc/be environments are greater than that of the ts/ts and ts/be environments in most cases. The transmission performance of time slot mechanism is more stable and predictable than the transmis-sion performance of congestion control mechanism; (2) in the cc/cc, ts/ts, cc/be and ts/be environments, one also ®nds that the standard deviation value of the lower priority ¯ows is larger than that of the higher priority ¯ows. That is, the higher priority ¯ows have a more stable and predictable
transmission performance than the lower priority ¯ows; (3) the FCFS and RED queueing disciplines might support a more stable transmission performance than other queueing disciplines in the cc/cc environment; (4) with the DRR queueing discipline, all cc/cc, cc/be and be/be TCP ¯ows have an unstable transmission performance; (5) the SFQ queueing discipline could support the most stable transmis-sion performance for all cc/be, ts/be and be/be UDP ¯ows. Moreover, the cc/be and ts/be TCP ¯ows with SFQ queue-ing discipline have more stable transmission performance than other queueing disciplines.
5.6. Parameter settings of the control mechanisms
Proper parameter settings are important to the control mechanisms simulations; it allows the mechanisms have better control. Three key parameters are investigated: round robin transmission time, number of time slots assigned to each priority and priority aging.
The round robin transmission time setting is important in the time slot mechanism. A ¯ow's round robin transmission time depends on the number of time slot. A proper setting of time slot number bene®ts both TCP and UDP ¯ows. If the number of time slot is too large, it will lead to a ®rst-come-®rst-served transmission behavior just as the case shown in Fig. 7. If the number of time slot is too small, a short round robin transmission time is shorter than the transmission round trip time. If a TCP ¯ow cannot get its destination ACKs, the retransmission of a TCP ¯ow will occur repeat-edly and deteriorate its transmission performance.
Additionally, if differences among round robin transmis-sion time of different priority ¯ows are too large, a low priority ¯ow may starve. Otherwise, the differential services are not signi®cant among different priority ¯ows. For the time slot mechanism, a time slot number assignment to each Table 5
Observations between transmission performance and queueing disciplines
Queueing disciplines Environments Flows Performance
FCFS cc/be, ts/be, be/be All be UDP ¯ows Best
DRR cc/cc, be/be All cc TCP2, TCP3, TCP4, UDP3, UDP4 ¯ows Worst All be TCP2, TCP3, TCP4, UDP3, UDP4 ¯ows
ts/be All ts TCP ¯ows Best
All be TCP ¯ows Worst
cc/cc, ts/ts, cc/be, ts/be All cc and ts ¯ows ts ¯ows are better than cc ¯ows
RED cc/be, ts/be, be/be All TCP ¯ows Better
cc/be, ts/be, be/be All be TCP ¯ows Best cc/cc, ts/ts, cc/be, ts/be All UDP ¯ows Better
ts/ts All TCP ¯ows Worst
All UDP ¯ows Best
SFQ cc/cc, ts/ts All UDP ¯ows Worst
C. Yang, C.-H. Fu /Compute r Communi cations 24 (2001) 1661 ±1672 1671 Table 6
Standard deviation of TCP/UDP ¯ows' transmission performance
1. In cc/cc, ts/ts, cc/be and ts/be, ¯ows in source traf®c 1are regulated by control algorithms; 2. In be/be, ¯ows in source traf®c 1are best effort ¯ows; 3. In cc/cc and ts/ts, ¯ows in source traf®c 2 are regulated by control algorithms; 4. In cc/be, ts/be and be/be, ¯ows in source traf®c 2 are best effort ¯ows; 5. Unit: seconds
Transmission environment Queueing discipline Flows' priority
Traf®c source 1Traf®c source 2
TCP1 TCP2 TCP3 TCP4 UDP3 UDP4 TCP1 TCP2 TCP3 TCP4 UDP3 UDP4
cc/cc (a pure congestion control mechanism environment) FCFS 22.517 72.429 199.938 241.349 148.040 260.736 19.667 89.446 196.809 218.273 202.538 248.081 DRR 17.258 112.100 313.526 381.021 263.624 402.590 16.700 202.259 331.519 370.441 285.425 372.951 RED 16.538 86.521 239.346 262.605 263.354 270.553 13.773 123.985 226.898 235.124 207.280 254.656 SFQ 15.343 93.327 307.992 316.727 314.763 328.746 16.436 176.114 229.475 273.345 248.735 280.365 ts/ts (a pure time slot
mechanism environment) FCFS 27.919 39.522 30.074 18.342 37.844 43.350 27.919 39.191 29.401 16.292 54.336 39.405 DRR 27.999 39.377 29.616 28.104 54.286 41.867 27.999 39.877 29.087 20.891 50.322 34.866 RED 25.765 38.634 34.566 26.690 57.413 36.154 33.895 37.015 26.838 29.518 59.306 38.962 SFQ 27.955 39.456 29.285 38.297 53.982 38.232 27.955 39.889 30.439 29.49126.245 12.653 cc/be (a mixed congestion
control mechanism environment) FCFS 57.343 161.123 184.227 170.965 171.031 156.047 104.166 79.531 119.173 100.266 43.787 41.791 DRR 82.326 189.004 254.046 341.464 227.877 263.819 137.282 132.209 146.395 140.546 27.010 25.289 RED 79.373 181.252 178.283 177.972 189.809 184.889 64.801 56.536 55.394 69.448 43.992 41.861 SFQ 36.247 180.497 152.119 153.947 147.039 121.845 58.455 49.443 45.035 41.996 14.786 14.630 ts/be (a mixed time slot
mechanism environment) FCFS 33.812 28.092 38.032 51.455 16.024 17.573 36.756 33.581 29.353 31.377 43.644 40.908 DRR 61.972 53.980 34.040 50.787 101.308 62.246 135.728 136.586 139.961 119.835 26.628 24.589 RED 45.988 21.583 36.292 45.825 18.054 20.184 25.924 17.051 27.381 32.826 43.979 41.851 SFQ 21.151 20.548 16.173 33.261 42.455 23.705 36.456 31.500 31.187 34.650 14.002 13.858 be/be (a pure best-effort
traf®c environment) FCFS 91.992 95.689 88.126 109.32 85.349 81.708 89.560 98.907 82.092 90.487 81.233 77.753 DRR 286.383 250.773 262.411 262.335 62.128 49.027 229.266 279.655 232.57 258.491 57.219 55.615 RED 72.812 90.609 75.115 73.894 87.951 83.680 75.985 78.553 72.776 64.789 87.444 83.869 SFQ 86.711 61.566 87.851 86.688 37.404 33.572 110.706 103.583 98.643 93.170 41.795 43.027
priority is important. The binary bandwidth allocation guarantees that high priority ¯ows receive better perfor-mance than low priority ¯ows. Meanwhile, this allocation scheme does not starve the low priority ¯ows. The optimal bandwidth allocation of round robin transmission time deserves a further study.
With numerous simulations, one can ®nd that a setting of priority aging time is important for both control mechan-isms. A short priority aging time allows the lower priority ¯ows to be upgraded sooner than otherwise. In that case, soon all the ¯ows become the highest priority. This traf®c pattern in turn degenerates into a best-effort traf®c and the differential service is not supported any more. A long prior-ity aging time, however, may cause a lower priorprior-ity ¯ow to starve because other higher priority ¯ows may keep coming and jump ahead of the queue.
6. Conclusion
TCP ¯ows are responsive to the network congestion whereas UDP ¯ows are irresponsible. UDP ¯ows often deteriorate the network congestion, sometimes even cause a congestion collapse. The uncontrollable UDP ¯ow is a major problem over the Internet. The congestion control mechanism and time slot mechanism are the two source-based ¯ow control mechanisms studied in this research. These two mechanisms are applied at the source node to regulate the transmissions of TCP and UDP ¯ows. With these two control mechanisms, UDP ¯ows are regulated and are not irresponsible to the network congestion. More-over, based on the priorities of ¯ows, differential services can be provided by these two mechanisms. High priority ¯ows would receive a better transmission performance than low priority ¯ows.
These two source-based control mechanisms regulate the TCP and UDP ¯ows at the source node. They are compa-tible with the current transmission operation environment over the Internet. No additional device, protocol, or control mechanism is needed to implement these two mechanisms. The only operation cost of these two mechanisms is the execution time at the source node.
Acknowledgements
This research is sponsored in part by NSC 89-2416-H-009-011
References
[1] S. McCanne, Sally Floyd, ns-Network Simulator, URLhttp://www-mash.cs.berkeley.edu/ns/.
[2] Van Jacobson, Michael J. Karels, Congestion avoidance and control, Proc.ACM SIGCOMM (1988).
[3] Sally Floyd, Kevin Fall, Promoting the use of end-to-end congestion control in the Internet, IEEE/ACM Trans. Network. (1999). [4] David D. Clark, Wenjia Fang, Explicit allocation of best effort packet
delivery service, ACM Trans. Network. 6 (4) (1998) 362±373. [5] Kevin Fall, Kannan Varadhan, ns Notes and Documentation, May 11,
1999.
[6] Andrew S. Tanenbaum, Computer Networks, 3rd ed., Prentice-Hall, New Jersey, 1996.
[7] Gary R. Wright, W. Richard Stevens, TCP/IP Illustrated, The Imple-mentation, vol. 4, Addison-Wesley, Reading, MA, 1995
[8] Paul E. McKenney, Stochastic fairness queueing, Internetworking: Research and Experience, vol. 2, 1991, pp. 113±131.
[9] Sally Floyd, Van Jacobson, Random early detection gateway for congestion avoidance, IEEE/ACM Trans. Network. 1(4) (1993) 397±413 URL http://www-nrg.ee.lbl.gov/nrg-papers.html.
[10] M. Shreedhar, George Varghese Lambda, Ef®cient Fair Queueing using De®cit Round Robin, November 18, 1994.