科技部補助專題研究計畫成果報告
期末報告
強制性管理階層財務預測與審計公費的關連
計 畫 類 別 : 個別型計畫 計 畫 編 號 : MOST 103-2410-H-004-206-執 行 期 間 : 103年08月01日至104年10月31日 執 行 單 位 : 國立政治大學會計學系 計 畫 主 持 人 : 潘健民 共 同 主 持 人 : 金成隆 計畫參與人員: 碩士班研究生-兼任助理人員:葉郡慈 碩士班研究生-兼任助理人員:鄭琪儒 碩士班研究生-兼任助理人員:洪于珺 碩士班研究生-兼任助理人員:宋育維 處 理 方 式 : 1.公開資訊:本計畫涉及專利或其他智慧財產權,2年後可公開查詢 2.「本研究」是否已有嚴重損及公共利益之發現:否 3.「本報告」是否建議提供政府單位施政參考:否中 華 民 國 105 年 02 月 04 日
中 文 摘 要 : 本文的主要目的是探討管理階層財務預測與審計公費的關聯性。利 用日本強制管理階層揭露財務預測之特殊環境,本文將探討強制性 管理階層財務預測如何影響審計公費的定價。本文特別針對強制性 管理階層財務預測修改與審計公費之間的關聯性做探討。在日本 ,上市公司的管理階層被證券交易所要求,每年度開始時都必須做 年度的財務預測。同時,日本的金融商品交易法也規定如果管理階 層在意識到有重大變動使其財務預測失真時,管理階層需要修改其 財務預測。在日本,公司在發佈管理階層財務預測之前,會交由會 計師做審閱。因此,如果公司經常修改其管理階層財務預測的話 ,會增加會計師的工作量。既然,日本的審計公費是以時間計費 ,那麼本文推論管理階層財務預測修正將會造成審計公費的增加。 本文研究結果發現,管理階層財務預測修正的次數與審計公費無相 關。反倒是財務預測修正的累積修正金額與審計公費有正向相關。 本文同時發現,初始財務預測與最終實現盈餘之間的差距與審計公 費也有正向相關。因此本文結論為會計師將財務預測修正的規模視 為審計風險的一部分。 中 文 關 鍵 詞 : 強制性管理階層財務預測, 財務預測修正, 審計公費
英 文 摘 要 : In this paper, we investigate the association between management earnings forecasts and audit fees. Taking
advantage of the unique setting in Japan, where management earnings forecasts are mandatory rather than voluntary, we extend the audit fee pricing literature by examining the role of risk associated with management earnings forecasts in the Japanese environment.
In particular, we investigate the association between management earnings forecast revisions and audit fees. In Japan, listed firms are requested to issue annual earnings forecasts in the beginning of the fiscal year. In
additional, the firms are also required to revise their earnings forecast if they foresee any significant changes will occur.
We find that the audit fees are positively associated with firms that have higher cumulated amount from revision of management earnings forecasts. We also find that audit fees are positively associated with firms that have greater discrepancy between their initial forecasts and realized earnings. We, however, do not find any evidences showing that there is any association between the numbers of forecast revisions and audit fees. Our conjecture is that reviewing management earnings forecasts along with
quarterly earnings reports may have been included in the auditing package. And the auditors care more about the magnitude of the revisions rather the times of the forecasts revisions.
The Association between Mandatory Management Earnings Forecasts
and Audit Fees
Chien-min Kevin Pan∗
Department of Accounting National Chengchi University Phone: +886-2-2939-3091 est. 88197
Email: [email protected]
January 2016
JEL classification: M40, M41, M48
Keywords: audit fees, management earnings forecasts
∗
ii
The Association between Mandatory Management Earnings Forecasts
and Audit Fees
Abstract
In this paper, we investigate the association between management earnings forecasts and audit fees. Taking advantage of the unique setting in Japan, where management earnings forecasts are mandatory rather than voluntary, we extend the audit fee pricing literature by examining the role of risk associated with management earnings forecasts in the Japanese environment.
In particular, we investigate the association between management earnings forecast revisions and audit fees. In Japan, listed firms are requested to issue annual earnings forecasts in the beginning of the fiscal year. In additional, the firms are also required to revise their earnings forecast if they foresee any significant changes will occur.
We find that the audit fees are positively associated with firms that have higher cumulated amount from revision of management earnings forecasts. We also find that audit fees are positively associated with firms that have greater discrepancy between their initial forecasts and realized earnings. We, however, do not find any evidences showing that there is any association between the numbers of forecast revisions and audit fees. Our conjecture is that reviewing management earnings forecasts along with quarterly earnings reports may have been included in the auditing package. And the auditors care more about the magnitude of the revisions rather the times of the forecasts revisions.
1
1. Introduction
We study the association between management earnings forecasts (MEFs) and audit fees. The releases of MEFs in Japan are in fact mandatory; therefore, auditors face different kind of audit risks than in the voluntary MEFs environment. Prior literature has documented that audit risks have a direct impact on the pricing of audit fees (e.g., Simunic 1980), and that auditors accordingly price different risk factors into their fees during the audit process (e.g., Hogan and Wilkins 2008). Gul, Jaggi, Lai, and Radhakrishnan (2013) take MEFs as a risk measure in determining audit fees to examine the relation between them. Li, Wasley, and Zimmerman (2012) propose a classification of MEFs into three rationales: cost of capital, managerial opportunism, and compliance with a rule requiring disclosure of nonpublic information or abstention from trading. Gul et al. (2013) use the methodologies developed in Li et al. (2012) and find that firms issuing opportunistic MEFs are charged higher audit fees. Taking advantage of the institutional background in Japan, where all MEFs are mandatory, this study seeks to shed light on the relation between audit risk and audit fee pricing by examining their relationship to mandatory MEFs.
Firms in Japan face less constraint in releasing MEFs and MEF revisions compared to their counterparts in the U.S. Japanese listed firms are required to revise their initial forecasts released in the beginning of the fiscal year if they foresee any possible change during the same period. Japanese firms’ responses to the MEF revision requirements are mixed. Herrmann, Inoue, and Thomas (2003) find that in order to avoid issuing MEF revisions, Japanese firms will manage earnings to meet MEFs. On the other hand, Kato,
2
Skinner and Kunimura (2009) find that Japanese firms usually upwardly biased their initial forecasts then revise downward to avoid negative earnings surprises in the year end.
MEFs in Japan are included as one of the disclosure items in the kessan tanshin (summary of financial statements). Releases of kessan tanshin are required by the Timely Disclosure Rules of the Tokyo Stock Exchange. Fail to comply with the Timely Disclosure Rules are subject to be punished.
Disclosures items included in kessan tanshin are reviewed by the auditors1 before being released to the public. A survey2 conducted by the Tokyo Stock Exchange (TSE) shows that that only 25 out 1416 firms release their kessan tanshin without any forms of auditors’ involvements or reviews. The survey results confirm that reviewing kessan
tanshin is one of the audit services in Japan; therefore, it should be one of the factors in
determining audit fees in Japan. Hence, if Japanese firms are required to revise their MEFs, it will only increase the workloads for auditors if a firm frequently revises its MEFs. In addition to increased workloads, frequent MEF revisions might also imply inferior audit quality. Skinner and Srinivasan (2012) provide evidence consistent with the importance of auditors’ reputation for audit quality in Japan. It is also very possible that auditor might increase audit fees for frequent MEF revising firms.
Audit fees in Japan were not disclosed in firms’ yukashoken hokokusho (annual securities filings, equivalent to annual reports) until 2004. Before 2004, audit fees in
1 In a private interview with an auditor in Tokyo, the auditor revealed that he has been reviewing kessan
tanshin (and the management earnings forecasts included in the kessan tanshin) since he joined audit firms in the mid-1990s.
2 Summary of the survey on quarterly disclosure (shihannki kaiji ni kansuru jojo kaisha no ishiki jittai
chosa kekka no gaiyo) URL: http://www.tse.or.jp/listing/seibi/b7gje60000005z9h-att/joujou_gaiyou.pdf (in Japanese).
3
Japan were priced using a so-called “Standard Audit Fee Schedule (hyojun kansa hyoshu)” set by the Japanese Institute of Certified Public Accountants (JICPA). Under the Standard Fee Schedule, audit fees are determined by a fixed rate and the days auditors have spent
for auditing the firms.3 In October 2003, JICPA released a new audit fee pricing
guideline4 and change the audit fee pricing to the so-called “Time Charge” method.5 The new time charge audit fee pricing guideline requires auditors to assess the audit risks and price the risks into audit fees.
Since the Time Charge method was adopted to determine audit fees in 2004, many studies (e.g., Yazawa, 2009; Fukukawa, 2011; Yazawa, 2012) in Japan, including JICPA6 itself, have tried to find how audit fees are determined under the new pricing scheme. However, as Yazawa (2012) suggests that even with some many efforts have been made to study audit fee pricing in Japan, we still know little about the processes and factors in determining audit fees.
In this study, we try to reveal the association between MEFs and audit fees. Considering MEFs to be a risk measure, Gul et al. (2013) find that firms issuing MEFs are charged higher audit fees than those that do not. They also find that audit fees are particularly high for firms that issue opportunistic MEFs. In contrast to studies conducted in the U.S., where most MEFs are voluntary, we examine the association between MEFs
3 According to the Standard Fee Schedule set by JICPA, audit fees consist of basic fees and working fees.
The basic fees are JPY9.95 million for firms listed in TSE 1st section, JPY6.85 million for firms listed in TSE 2nd section and JPY5.75 million for the rest of the firms. Working fees are JPY2.48 million per leading auditor. If the auditors spend more than 25 days on auditing a firm, the additional working fees will be JPY0.089 million per day multiply by the numbers of leading and supporting auditors.
4 Current JICPA audit fee pricing guideline URL:
http://www.hp.jicpa.or.jp/specialized_field/pdf/member/01122-003578.pdf (in Japanese).
5 Time charge method will be detailed in the institutional background in section two. 6
JICPA also conduct several studies trying to find out how auditors estimate audit time under time charge method. The study reports and a follow-up revision (kansajikan no mistumori ni kansuru kenkyu hokoku) were first released in September 2006 and June 2008 respectively. URL:
4
and audit fees using Japanese firm data, in a setting where MEFs are effectively mandated. The prior literature only documents a few studies on the mandated MEFs in Japan. Herrmann et al. (2003) find that Japanese firms sell assets to align reported earnings and MEFs. Kato et al. (2009) find upwardly biased MEFs with subsequent revisions in Japan.
This paper contributes to the literature in the following ways. The prior literature documents that voluntary MEFs represent risk in determinations of audit fees (e.g., Gul et al., 2013). This study extends the audit fee pricing literature by examining the role of risk associated with mandatory MEFs. We will be the first study to examine the association between MEF revisions and audit fees. In a voluntary MEF environment, managers are reluctant to revise MEFs, but when they are mandatory, managers are expected to revise them if they foresee changes. Our results are expected to increase our understandings of the processes in pricing audit fees when take MEFs into considerations.
2. Institutional background and hypothesis development
Management Earnings Forecasts in Japan
The releases of MEFs in Japan begin with the requests from the Tokyo Stock Exchanges in the year end of 1974 (Kubo 1992; Kubo 2000). The Securities and Exchange Act of Japan requires the listed firms to submit yukashoken hokokusho within three month of the end of fiscal year. Therefore, there will be three months of time lag to the most from the fiscal end to the actual release of the firms’ annual performance.
5
Kessan tanshin are therefore used to fill in the three month time lag. The firms will
release their earnings forecasts for the coming fiscal year along with the realized earnings figures in kessan tanshin. In the kessan tanshin, listed firms will provide forecasts on Sales, Operating Income (since 2008), Earnings before Extraordinary Items and Income Taxes, Net Income, Net Income per Share, and Dividend per Share of the coming fiscal year.
The listed firms are expected to provide forecasts on annual earnings through the fourth quarterly kessan tanshin. In addition to the regular release of MEFs through kessan
tanshin for each quarter, the Financial Instruments and Exchange Act of Japan (prior to
September 30, 2007, the Securities and Exchange Act) requires firms to timely revise their MEFs if they foresee any significant changes.7 The requirements are 10% or more for sales and 30% or more for the other three earnings measures.8 In 1999, TSE set forth timely disclosure rules9 for firms listed in TSE to comply. Firms that fail to comply with the timely disclosure rules will receive punishments from the TSE.10
Audit Fee Pricing and Time Charge Method
In Japan, the pricing of audit fees follows the guideline set by the JICPA. In March 2004, audit fee pricing in Japan started to follow the new guideline called “Time Charge”
7 Financial Instruments and Exchange Act, Article 166-2(3). The forecast revision requirements are
regulations to prohibit insider trading.
8
Note that the initial forecasts are requests from the stock exchange, but forecast revisions are required by the Financial Instruments and Exchange Act.
9 Rules on timely disclosure for corporate information of the listed securities issuers (jojo yukashoken no
hakousha no kaisha joho no tekiji kaijito ni kansuru kisoku).
10 TSE punishments include 1. warnings (koto chui),
2. improvement reports (kaizen hokokusho) (URL: http://www.tse.or.jp/listing/kaizen/), 3. watching lists (kaiji chui meigara shitei) (URL: http://www.tse.or.jp/listing/kaiji/index.html/), 4. cash fines (jojo keiyaku iyakukin) (URL: http://www.tse.or.jp/listing/iyakukin/index.html/), and 5. delisting (jojo haishi) (URL: http://www.tse.or.jp/listing/haishi/list.html/).
6
method set by JICPA. Under the new time charge method guideline, audit fees are determined by the sum of required profits of audit firm plus direct and indirect audit costs. Direct audit costs are calculated by using the charge ratio11 of auditing auditors multiply the time needed for the auditing. Indirect costs are mostly fixed costs like insurance fees. Therefore, time needed for audit plays the most important role in pricing audit fees. Estimation of time needed for audit also considers client size, complexity and audit risk. Therefore, we can expect that audit fee pricing has a direct association to the time estimated for audit.
Hypotheses
Since the 1970s, accumulating empirical evidence in the literature shows that MEFs convey information that can influence stock prices (e.g., Foster 1973; Patell 1976; Penman 1980). Follow-up studies also provide evidences showing that MEFs in Japan also have information contents (e.g., Darrough and Harris 1991, Conroy, Harris and Park 1998). Subsequent studies in Japan also show that stock prices go up (down) in response to upward (downward) MEF revisions (e.g., Goto and Sakurai, 1993; and Hah, 1994). The existing literature provides extensive empirical evidences concerning voluntary MEFs; therefore, discussions on voluntary MEFs in prior studies have investigated the true motivations of managers to issue MEFs. This paper is intended to extend the role of the risks that MEFs pose in determining audit fees in a setting where MEFs are effectively mandated. Prior literature has documented only two studies on mandated MEFs from Japanese firm data. Herrmann et al. (2003) demonstrate that
11 Each auditor has their own “charge ratio” according to their ranks (e.g., partner, manager, senior and
7
Japanese firms sell fixed assets and marketable securities to manage earnings to meet the MEFs. Kato et al. (2009) find that initial MEFs in Japan are usually biased upward, but managers are able to make subsequent forecast revisions to ensure that earnings surprises will be positive.
Prior literature on mandatory MEFs tells the story from opposing perspectives. Herrmann et al. (2003) demonstrate that the MEFs issued by firms are an important indicator of reputation, and that managers want to manage earnings to meet the benchmark. On the other hand, Kato et al. (2009) show that because managers are not punished for revising MEFs, they are constantly upwardly biased. In an environment where MEF issuance is mandatory, the action of issuing MEFs does not indicate risk. Instead, the revisions of MEFs should be perceived as risk factors. Consider the fact that MEFs are reviewed by the auditors before being released; we expect that audit fees will be higher for firms that frequently revise their MEFs from the following two perspectives. First, MEF revisions increase workloads for auditors. Auditing is a labor-intensive service, and the time consumed in providing auditing service is also a key factor in pricing audit fees under current time charge method in Japan; we expect MEF revisions increase the workloads for auditors and thus increase the amount of audit fees. Second, frequent MEF revisions might signal inferior audit quality. As Skinner and Srinivasan (2012) show that auditors care about their reputation for audit quality in Japan; it is very possible that auditors will increase audit fees for firms that might issue MEF revisions. Therefore, our first hypothesis is (all hypotheses are stated in the null form):
8
As shown in Kato et al. (2009) that firms Japan usually upwardly biased their initial forecasts to avoid earnings surprises in the year end. Goto and Sakurai (1993) and Hah (1994) both show that stock price decreases in response to downward revisions. It is very possible that downward revisions might be perceived as inferior audit quality because the auditors cannot help the firm give out more precise forecasts. Therefore, our second hypothesis is:
H2: Audit fees are expected to be higher if the firm eventually revises its MEFs
downward.
Kato et al. (2009) show that firms frequently revise the MEFs they issue. The percentage of firms that revise their MEFs at least once is 99.6%, that of firms that revise MEFs twice 87.7%, three times 65.5%, and four times 30.6%. More MEF revisions mean more reviews by auditors are needed. Therefore, the third hypothesis is:
H3: Audit fees are expected to be higher for the firm that issues multiple MEF
revisions.
The number and magnitude of MEF revisions matter. The firm may only issue one revision, but the revised amount may be huge. On the other hand, the firm may issue many MEF revisions, but the cumulative revised amounts may be cancelled out by frequent upward and downward revisions. Therefore, the following hypotheses concern
9
the magnitude of MEF revisions.
H4: Audit fees are expected to be higher for the firm that cumulates higher MEF
revision amount (in absolute value).
H5: Audit fees are expected to be higher for the firm that has greater discrepancies
between initial forecasts and realized earnings.
3. Research Design
Since Simunic (1980), a standard audit-fee pricing model in the literature generally includes client size, complexity, risk, and other client-related and auditor related factors to predict fees. In this study, we add several MEF specifications to the model to study the association between MEFs and audit fees. Following prior literature (e.g., Hogan and Wilkins 2008; Fukukawa 2011, Gul et al. 2013), we construct the following audit fee model:
LNAFit = β0 + β1MEFit + β2LNASTit + β3LNSubsit + β4LNSegit + β5Overseasit
+β6INVRECit + β7Quickit + β8DAit+ β9ROAit + β10 ROAVARit
+ β11Growthit + β12ABSPADAit + β13LNNonAFit + β14YEit + β15Loss + β16Big3it + β17PolicyChangeit + β18GCit + β19AuditOpinion + εit (1)
10
In the model, LNAF is the natural logarithm of the audit fee. MEF is the main variable defined in this study to test the hypothesis. We define 5 MEF variables in this study based on based on the MEFs at net income level. MEF1 is a binary variable set equal to 1 if a firm revises its MEF. MEF2 is a binary variable set equal to 1 if a firm revises its MEFs downward. MEF3 is the number of revisions of a firm’s MEFs.12 MEF4 is the absolute value of revised cumulative amount of a firm’s MEF. MEF5 is the amount differences between the initial MEF and the realized earnings.13
Following Hogan and Wilkins (2008), Fukukawa (2011), and Gul et al. (2013), we include the following control variables in the model: LNAST, LNSubs, LNSEG, Overseas, INVREC, Quick, DA, ROA, ROAVAR, Growth, ABSPADA, LNNonAF, YE, LOSS, BIG3, PolicyChange, GC, and Audit Opinion.
Like in prior studies, we also model variables to control for size, complexity, risk and related factors into the regression. We use the LNAST, which is the natural logarithm of total assets, to control for size. For the complexity, we use LNSubs (number of consolidated subsidiary firms), LNSeg (number of business segments), and Overseas (overseas sales over total assets) to control for complexity. Firms have more numbers of consolidated firms, more segment and overseas sales all increase the workload for auditors.
We measure risk from audit risk, profitability and leverage perspectives. We use IVNREC (sum of inventory and receivable over total assets), Quick (current assets minus inventories to current liabilities), DA (long-term debt over total assets), ROA (net income
12 We define two types of MEF3 variables. One is the natural logarithm of the numbers of MEF revisions.
Another is a binary indicator variable set equal to one if the firms revise their MEFs for more than two times and 0 otherwise.
13 We deflat MEF4 and MEF5 using total assets. We also obtain similar results using natural logarithm of
11
over total assets), ROAVAR (5 year variance of ROA), Growth (percentage change in sales in a year), and Loss (binary variable set equal to 1 if a firm reports net losses) to control for risk.
We also add ABSPADA (performance-adjusted unsigned accrual) to control for current earnings quality. LNNonAF is the natural logarithm of non-audit fees. The remaining variables are indicator variables. Big 3 is an indicator variable set equal to 1 if a firm is audited by a Big 3 audit firm (Deloitte, KPMG and Ernst and Young).14 YE is
an indicator variable set equal to 1 if the firm’s fiscal year ends in March.15
PolicyChange is an indicator variable set equal to 1 if the firm changes any of its accounting policies in a fiscal year. GC is an indicator variable set equal to 1 if the auditor expresses going concern in the annual report. AuditOpinion is an indicator variable set equal to 1 if the auditor expresses auditor confined audit opinion other than going concern.
4. Sample and Data
Sample Selection
We will obtain financial data from Nikkei NEEDS–FinancialQuest.16 We will hand collect the audit fees (both audit fees and non-audit fees) and auditor data from the
14 We exclude PwC due the collapse of PwC’s affiliate auditor in Japan, ChuoAoyama. For details, see
Skinner and Srinivasan (2012).
15 Most of the Japanese firms end their fiscal year on March 31st. 16
Nikkei NEEDS is a commercial database provided by Nikkei, a business news publisher in Japan. Nikkei NEEDS has been adopted as the mail source of data by various research papers on Japanese accounting issues (e.g., Skinner 2008; Kato et al. 2009; Kato, Li and Skinner, 2014). FinancialQuest is an online service of NEEDS.
12
Auditors and Audit Fees Handbook (kansanin kansahoshu hakusho) published by the JICPA. The JICPA Auditors and Audit Fees Handbook are available from 2008 to 2012. Data after 2013 are hand-collected from annual reports of the firms listed in TSE. Annual reports can be obtained from EDINET (Electronic Disclosure for Investors’ NETwork, which is a Japanese equivalent of the U.S. Electronic Data-Gathering, Analysis, and Retrieval system, EDGER).
We set the sample period of this study from 2010 to avoid external shocks associated with the collapse of ChuoAoyama (PwC’s affiliate in Japan). In addition, annual reports that comply with J-SOX after 2009. Since J-SOX is modeled after the US SOX Act, using only data after J-SOX became effective increases the comparability and consistency of our results. As a result, our sample period is from 2010 to 2014; contains a total of 5 fiscal years.
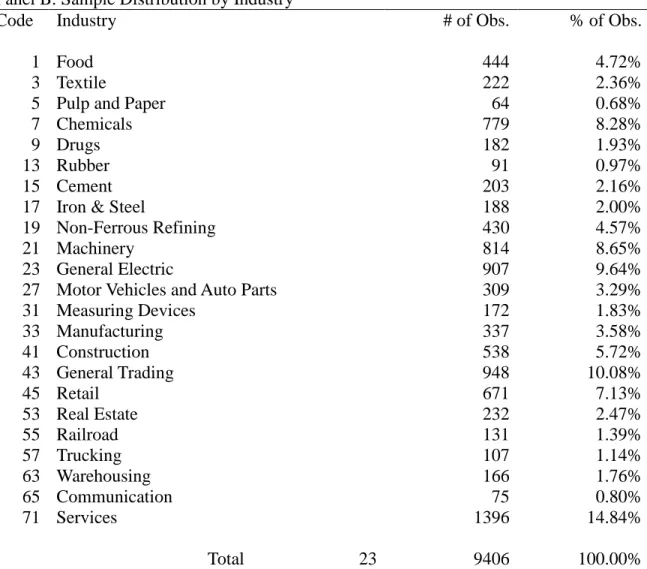
Panel A of Table 1 reports the sample compositions of this paper. We first collect all firms listed in the Tokyo Stock Exchange (excluding emerging market). We then deduct firms in financial institutions, and regulated industries. We further delete firms with missing data for audit fee, MEF and other financial variables. As a result, we obtain a final sample of 9,406 observations. Panel B of Table 1 reports the sample distribution by industry. There are a total of 23 industries in the sample. Firms in services and general trading industry each consists more than 10% of the observations in the sample. Firms in general electric and machinery industry each also consists close to 10% of the observations in the sample. This sample distribution is consistent with the current industry structure in Japan.
13
Summary Statistics and Correlations
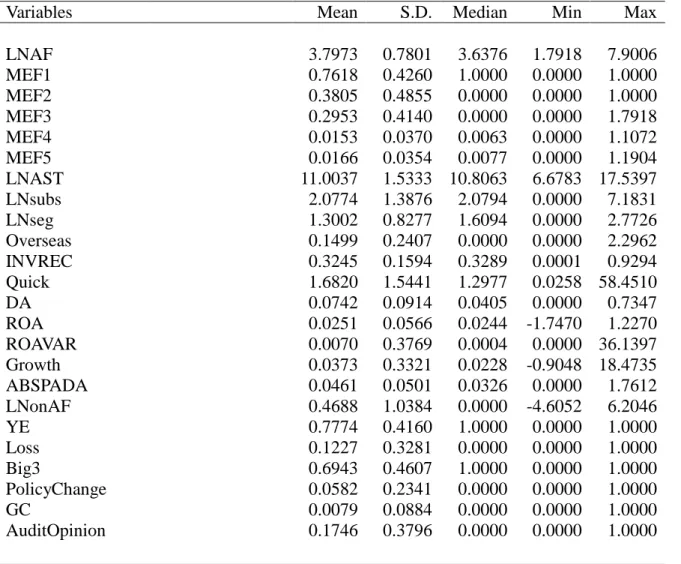
Table 2 reports the summary statistics of the sample. Mean of MEF1 is 0.7618, i.e., 78.16% of the firms in the sample at least once revise their forecasts. MEF2 reveals that 38.05% of the firms in the sample eventually revise their forecasts downward. Note that 77.74% of the firms in the sample end their fiscal year in March while 69.43% of the firms in the sample are audited by the Big 3 audit firms. Auditors express audit opinions other than going concern to 17% of firms in the sample; however, only 0.79% of the firms in the sample receive going concern opinion.
Table 3 presents the correlation matrix between variables. Pearson product-moment correlation coefficients are reported in the upper diagonals and Spearman’s rank correlation coefficients summarized in the lower diagonals, respectively. Panel A of Table 3 reports the correlations between audit fee and MEFs variables. There is no particular high correlation between audit fees and MEFs variables. Panel B of Table 3 reports the correlations between audit fee and other control variables. Note that the reported coefficients between audit fee and asset, subsidiaries, segments, overseas, non-audit fee and big 3 are high, as expected. Other controls variables do not have particularly high coefficients.
5. Empirical Results
Main Results
14
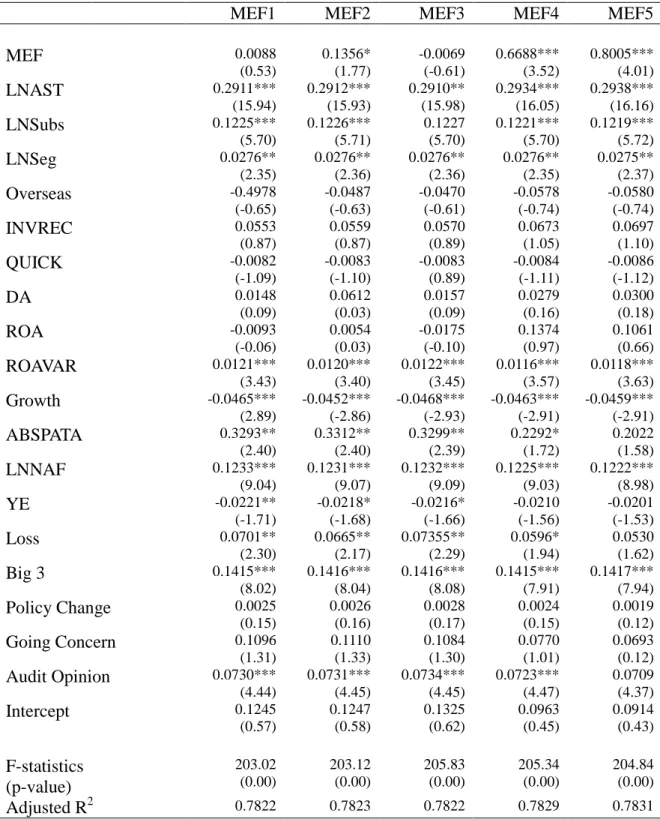
statistically significant for MEF2 (at 10% level), MEF4 (at 1% level), and MEF5 (at 1% level). The results support hypothesis H2, H4 and H5. The straight forward interpretations for these results are as follows. First, hypothesis H2 predicts that audit fees are expected to be higher if the firm revises MEF downward. Kato et al. (2009) that firms usually bias MEFs upward then revise the MEFs downward at the subsequent MEF revisions. The result that audit fee is positively associated with MEF2 suggests that auditors might consider the upward biased MEFs to be one of the audit risk factors.
Hypothesis H4 predicts that audit fees are expected to be higher for the firm that cumulates higher MEF revision amount (in absolute value). Since the firms are required to issue new MEFs when they foresee any significant earnings changes, firms may be less reluctant to revise their previous forecasts. However, if a firm’s cumulated MEF revision amount is large; it is very possible that the firm does not a clear vision of their business operation. The result shows that audit fees are positively associated with MEF4 at 1% significant level. This result also suggests that auditors may charge higher audit fees for firms that cumulates higher MEF revision amount in compensation for the audit risks.
Hypothesis H5 predicts that audit fees are expected to be higher for the firm that has greater discrepancies between initial forecasts and realized earnings. Herrmann, Inoue, and Thomas (2003) show that firms avoid revising MEFs through asset sales. However, a large gap between initial forecast and realized earnings cannot be filled by managing earnings but only revising previous forecasts. The result shows that audit fees are positively associated with MEF5 at 1% significant level. This result also suggests that auditors may consider larger forecast gaps as audit risks and charge for higher
15
premium.
Two hypotheses, H1 and H3, are not supported by the results reported in Table 4. Hypothesis H1 predicts that audit fees are expected to be higher if the firm revises MEFs. Since the firms are required to issue new MEFs when they foresee any significant earnings changes, the possibilities that a firm would never need to revise previous forecasts is little. Consider that mean of MEF1 is 0.7618, i.e., 78.18% of firms revise their MEF for at least 1 times. Under this circumstance, it is nature that H1 is not supported by the evidences.
To our surprise, H3 is not supported by the evidences. The coefficient for MEF3 is negative and is not significant. As previously noted that a survey conducted by the TSE reveals that more than 98% of the firms listed in TSE have auditors involved their MEFs before the forecasts are released, we then predicts in hypothesis H3 that audit fees are expected to be higher for the firm that issues multiple MEF revisions. However, the empirical results do not support this hypothesis. The interpretations for this result could be that reviewing MEFs have been included in the audit service packages. The survey conducted by the TSE was related to the introduction of quarterly earnings reports in TSE. If the firms include the release of forecasts revisions along with quarterly reports, then multiple forecast revisions will not be extra workloads for auditors.17
In sum, the positive associations between audit fees and MEFs variables (MEF1, MEF4 and MEF5) reveal that auditors do consider MEFs when pricing audit fees. This is also consistent with Gul et al. (2013) that auditors consider MEFs as one of the risk
17
Instead of the taking natural logarithm of the numbers of MEF revisions issued, we set MEF3 as a binary variable that is equal to 1 if the firms issue more than 2 times of forecasts revisions. Since the firms issue 3 quarterly reports before fiscal end, we also set MEF3 equal to 1 if the firms issue more 4 or 5 forecasts revisions. However, all results remain insignificant.
16
factors. The empirical results reveal that audit fees are higher when the gaps between initial forecasts and realized earnings or cumulative revision amounts are large, suggesting that auditors price MEFs into audit fees.
Results for Additional Tests
In the additional tests, we look at interactions between the MEF variables in the study. For the interactions between cumulated revision amounts and other binary variables, we construct MEF1*MEF4, MEF2*MEF4 and MEF3*MEF4. For the interactions between forecast gap and other binary variables, we construct MEF1*MEF5,
MEF2*MEF5 and MEF3*MEF5.18
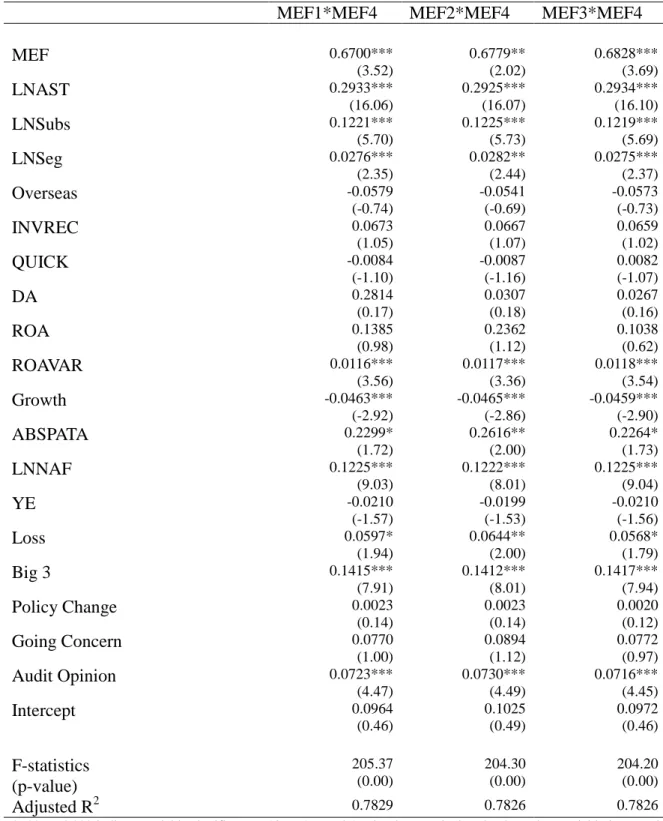
Table 5 reports the results of the interactions variables for cumulated revision amounts. All interaction variables are positively associated with audit fees at 1% significant level (except for MEF2*MEF5 is at 5% significant level). This reveals that firms are charged for higher audit fees at any conditions when the firms have higher cumulated forecast revision amount.
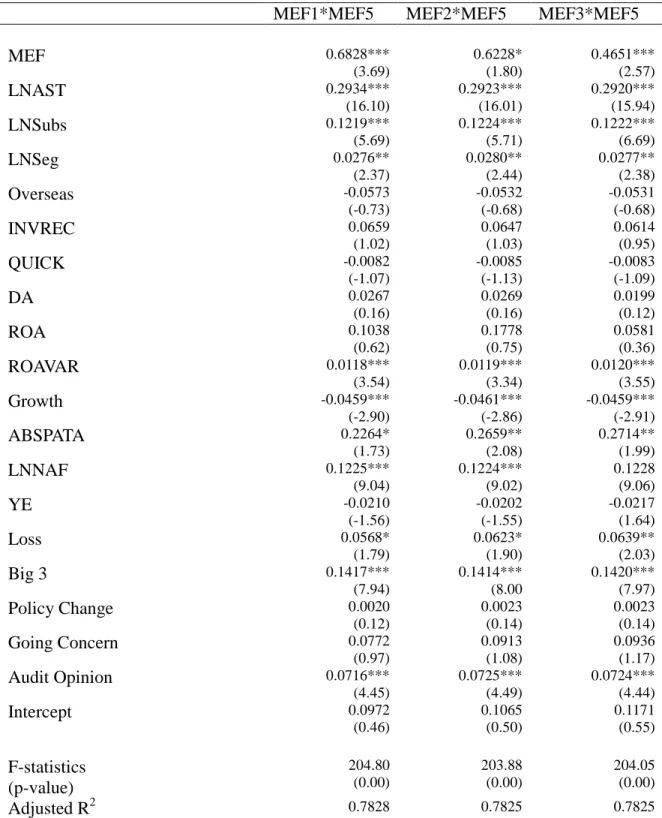
Table 6 documents the results of the interactions variables for large gap between initial forecast and realized earnings. All interaction variables are positively associated with audit fees at 1% significant level (except for MEF2*MEF5 is at 10% significant level). The results also suggest that auditors charge higher audit fees at any conditions when the firms that end up with having large gap between initial forecasts and realized earnings.
In sum, results reported in this study suggest that audit fees are associated with the
18 In the additional tests, MEF3 is set equal to 1 if the firms issued more than 2 forecast revisions and 0
17
magnitude of revision amount (MEF4) and the amount the firms need to revise (MEF5). These results taken together suggest that auditors do not charge firms higher audit fees for frequently revision of MEFs but for the greater amount that is being revised. These results together reveal that it is very possible that the auditors consider MEFs as one of the audit risk factors.
6. Concluding Remarks
In this study, we examine the association between management earnings forecasts and audit fees. The releases of MEFs in Japan are in fact mandatory; therefore, auditors face different kind of audit risks than in the environment where MEFs are mostly voluntary.
Gul et al. (2013) adopt the methodologies developed in Li et al. (2012) to categorize MEFs into three different types and find that firms issuing opportunistic MEFs are charged for higher audit fees. Taking advantage of the institutional background in Japan, where all MEFs are mandatory, this study seeks to shed some light on the relation between audit risks and audit fees pricing by examining their relationships with mandatory MEFs.
We find results showing that the magnitudes of the MEF revisions are positively associated with audit fees. Evidences reported in this study reveal that firms that cumulated higher revision amount are charged for higher audit fees. Evidences also show that firms that have greater gap between initial earnings forecasts and realized earnings
18
(i.e., greater amount to revise forecasts) are also charged for higher audit fees. However, we do not find evidence showing that audit fees are associated with frequent revisions of MEFs. The results reported in this study together suggest that auditors consider MEFs as one of the risk factors in terms of the magnitudes of revisions, and charge higher audit fees to compensate for such audit risks.
19
Reference
Conroy, R., R. Harris, and Y. Park. 1998. Fundamental information and share prices in Japan: Evidence from earnings surprise and management predictions. International
Journal of Forecasting 14 (2): 227-244.
Darrough, M. and T. Harris. 1991. Do management forecasts of earnings affect stock prices in Japan? In Japanese Financial Market Research, edited by W. T. Ziemba, W. Bailey, and Y. Hamao, 197-229, North Holland, Amsterdam.
Foster, G. 1973. Stock market reaction to estimates of earnings per share by company officials. Journal of Accounting Research 11 (1): 25-37.
Fukukawa, H. 2011. Audit pricing and cost strategies of Japanese Big 3 firms.
International Journal of Auditing 15 (2): 109-126.
Goto, T., and K. Sakurai. 1993. Earnings forecast revisions and insider trading regulations (rieki yosoku no kaitei joho to insider torihiki kisei). Accounting (kigyo kaikei) 45 (9): 127-132 (in Japanese).
Gul, F., B. Jaggi, K. Lai and S. Radhakrishnan. 2013. Association between opportunistic management earnings forecasts and audit fees. Working paper, Hong Kong Polytechnic University.
Hah, E. 1998. Empirical analysis on the filing system: Information contents of earnings forecast revision (filing seido no josho bunseki – gyoseki yoso shusei no joho koka).
Waseda Commercial Review (waseda shogaku) 377: 63-89 (in Japanese).
Herrmann, D., T. Inoue and W. B. Thomas. 2003. The sale of assets to manage earnings in Japan. Journal of Accounting Research 41 (1): 80-108.
Hogan, C. E., and M. S. Wilkins. 2008. Evidence on the audit risk model: do auditors increase audit fees in the presence of internal control deficiencies? Contemporary
Accounting Research 25 (1): 219-242.
Kato, K., D. J. Skinner, and M. Kunimura. 2009. Management forecasts in Japan: An empirical study of forecasts that are effectively mandated. Accounting Review 84 (5): 1575-1606.
Kato, K., M. Li, and D.J. Skinner. 2014. Is Japan really a 'Buy'? The corporate governance, cash holdings, and economic performance of Japanese companies. Chicago Booth Research Paper No. 13-06.
Kubo, Y. 1992. Theory and Practice of Timely Disclosure (tekiji kaiji no riron to jitsumu),
Chuokeizai-Sha: Tokyo (in Japanese).
Kubo, Y. 2000. Market Side Disclosure (maketto saido disukurojya), Chuokeizai-Sha: Tokyo (in Japanese).
Li, E., C. E. Wasley and J. L. Zimmerman. 2012. Should management earnings guidance be pooled? Classifying management earnings guidance into capital market, opportunistic, and disclose or abstain rationales: Implications for research. Working paper, University of Rochester.
Patell, J. M. 1976. Corporate forecast of earnings per share and stock price behavior: Empirical tests. Journal of Accounting Research 14 (2): 246-276.
Penman, S. H. 1980. An empirical investigation of the voluntary disclosure of corporate earnings forecasts. Journal of Accounting Research 18 (1): 132-160.
Simunic, D. A. 1980. The pricing of audit services: Theory and evidence. Journal of
20
Skinner, D. J. 2008. The rise of deferred tax assets in Japan: The case of the major Japanese banks, Journal of Accounting and Economics 46(2-3): 218-239.
Skinner, D. J, and S. Srinivasan. 2012. Audit quality and auditor reputation: Evidence from Japan. Accounting Review 87 (5): 1737-1765.
Yazawa, K. 2009. The study on audit pricing model: Evidence from Japan (kansa hoshu
hyoka model no kenkyu). Aoyama Journal of Business (aoyama keiei ronshu) 44 (3):
227-256 (in Japanese).
Yazawa, K. 2012. A study on the audit pricing model II: Focus on the internal control audit (kansa hyoshu hyoka model no kenkyu II: naibu tosei kansa no donyu ni shoten wo atete).Aoyama Journal of Business (aoyama keiei ronshu) 47(1): 79-97 (in Japanese).
21
Exhibit 1 - Variables Definitions
LNAF = natural logarithm of audit fees;
MEF1 = binary variable set equal to 1 if a firm revises its MEF, and 0 otherwise;
MEF2 = binary variable set equal to 1 if a firm eventually revises its MEFs downward, and 0 otherwise;
MEF3 = natural logarithm of the number of revisions of a firm’s MEFs;
MEF4 = the absolute value of revised cumulative amount of a firm’s MEFs;
MEF5 = the amount differences between the initial MEF and the realized earnings;
LNAST = natural logarithm of total assets;
LNSub = natural logarithm of number of consolidated subsidiary firms
LNSeg = natural logarithm of the number of reported business segments;
Overseas = overseas sales over total assets;
INVREC = sum of inventory and receivable over total assets;
Quick = current assets minus inventories to current liabilities;
DA = long-term debt over total assets;
ROA = net income over total assets;
ROAVAR = 5 year variance of ROA
Growth = percentage change in sales in a year, measured as (Salest – Salest-1) / Salet-1;
ABSPADA = absolute value of performance-adjusted accrual, measured as the difference between the firm-specific residual from the equation: [Total Accruals = γ0 + γ1(1/asset-1) + γ2(△REV - △AR) + γ3PPE + ε] and the median firm-specific residual from the same two-digit code/ROA decile in year t.
LNNonAF = natural logarithm of non-audit fees;
YE = indicator variable set equal to 1 if the firm’s fiscal year ends in March
31st, and 0 otherwise;
Loss = indicator variable set equal to 1 if a firm reports net losses, and 0 otherwise;
Big3 = indicator variable set equal to 1 if a firm is audited by a Big 3 audit firm: Deloitte, KPMG or Ernst and Young, and 0 otherwise;
PolicyChange = indicator variable set equal to 1 if a firm reports any accounting policy
change, and 0 otherwise;
GC = indicator variable set equal to 1 if the auditor expresses going concern,
and 0 otherwise;
AuditOpinion = indicator variable set equal to 1 if the auditor expresses audit opinions
22
Table 1 – Observations and Sample Distribution Panel A: Observation
Total Observations 12,635
Deduct:
Financial institutions 993
Regulated industries 438
Missing audit fee data 1072
Missing MEF data 517
Missing financial variables 547
Final Observations 9406
Panel B: Sample Distribution by Industry
Code Industry # of Obs. % of Obs.
1 Food 444 4.72%
3 Textile 222 2.36%
5 Pulp and Paper 64 0.68%
7 Chemicals 779 8.28%
9 Drugs 182 1.93%
13 Rubber 91 0.97%
15 Cement 203 2.16%
17 Iron & Steel 188 2.00%
19 Non-Ferrous Refining 430 4.57%
21 Machinery 814 8.65%
23 General Electric 907 9.64%
27 Motor Vehicles and Auto Parts 309 3.29%
31 Measuring Devices 172 1.83% 33 Manufacturing 337 3.58% 41 Construction 538 5.72% 43 General Trading 948 10.08% 45 Retail 671 7.13% 53 Real Estate 232 2.47% 55 Railroad 131 1.39% 57 Trucking 107 1.14% 63 Warehousing 166 1.76% 65 Communication 75 0.80% 71 Services 1396 14.84% Total 23 9406 100.00%
23
Table 2 - Summary Statistics
Variables Mean S.D. Median Min Max
LNAF 3.7973 0.7801 3.6376 1.7918 7.9006 MEF1 0.7618 0.4260 1.0000 0.0000 1.0000 MEF2 0.3805 0.4855 0.0000 0.0000 1.0000 MEF3 0.2953 0.4140 0.0000 0.0000 1.7918 MEF4 0.0153 0.0370 0.0063 0.0000 1.1072 MEF5 0.0166 0.0354 0.0077 0.0000 1.1904 LNAST 11.0037 1.5333 10.8063 6.6783 17.5397 LNsubs 2.0774 1.3876 2.0794 0.0000 7.1831 LNseg 1.3002 0.8277 1.6094 0.0000 2.7726 Overseas 0.1499 0.2407 0.0000 0.0000 2.2962 INVREC 0.3245 0.1594 0.3289 0.0001 0.9294 Quick 1.6820 1.5441 1.2977 0.0258 58.4510 DA 0.0742 0.0914 0.0405 0.0000 0.7347 ROA 0.0251 0.0566 0.0244 -1.7470 1.2270 ROAVAR 0.0070 0.3769 0.0004 0.0000 36.1397 Growth 0.0373 0.3321 0.0228 -0.9048 18.4735 ABSPADA 0.0461 0.0501 0.0326 0.0000 1.7612 LNonAF 0.4688 1.0384 0.0000 -4.6052 6.2046 YE 0.7774 0.4160 1.0000 0.0000 1.0000 Loss 0.1227 0.3281 0.0000 0.0000 1.0000 Big3 0.6943 0.4607 1.0000 0.0000 1.0000 PolicyChange 0.0582 0.2341 0.0000 0.0000 1.0000 GC 0.0079 0.0884 0.0000 0.0000 1.0000 AuditOpinion 0.1746 0.3796 0.0000 0.0000 1.0000
24
Table 3 - Correlation Matrixes
Panel A: Correlation Matrix for Audit Fee and MEF Variables
LNAF MEF1 MEF2 MEF3 MEF4 MEF5
LNAF 1 0.035*** -0.021** 0.054*** -0.067*** -0.070*** MEF1 0.041*** 1 0.438*** 0.399*** 0.220*** 0.152*** MEF2 -0.020* 0.438*** 1 0.205*** 0.218*** 0.180*** MEF3 0.062*** 0.411*** 0.212*** 1 0.266*** 0.223*** MEF4 -0.060*** 0.699*** 0.400*** 0.482*** 1 0.889*** MEF5 -0.099*** 0.370*** 0.222*** 0.335*** 0.763*** 1 *, **, *** Denote 0.1, 0.05, and 0.01 significance levels, respectively.
Panel B: Correlation Matrix for Audit Fee and Control Variables
1 2 3 4 5 6 7 8 9 10 11 12 13 14 15 16 17 18 19 1 1 0.849 0.762 0.319 0.262 -0.028 -0.146 0.176 -0.015 -0.006 -0.017 -0.079 0.598 0.137 -0.050 0.319 0.092 -0.070 0.093 2 0.816 1 0.770 0.279 0.270 -0.062 -0.130 0.186 0.022 -0.013 0.001 -0.123 0.545 0.168 -0.113 0.252 0.089 -0.126 0.058 3 0.748 0.738 1 0.374 0.400 0.024 -0.137 0.154 -0.014 -0.006 0.010 -0.119 0.471 0.170 -0.057 0.276 0.090 -0.060 0.057 4 0.363 0.305 0.394 1 -0.019 0.002 -0.162 -0.148 -0.064 -0.017 -0.003 -0.019 0.189 0.120 -0.026 0.186 0.041 -0.004 0.043 5 0.287 0.289 0.447 0.049 1 0.262 -0.012 -0.034 0.001 -0.008 0.030 -0.016 -0.169 0.119 0.017 0.082 0.089 -0.024 0.002 6 0.011 -0.043 0.029 -0.020 0.248 1 -0.139 -0.223 -0.040 -0.020 0.002 0.089 -0.052 0.153 0.001 0.041 0.024 -0.004 -0.047 7 -0.143 -0.133 -0.097 -0.178 0.112 -0.025 1 -0.346 0.132 0.007 -0.008 0.010 -0.078 -0.001 -0.050 -0.030 -0.026 -0.034 -0.045 8 0.182 0.197 0.229 0.220 0.028 -0.109 -0.589 1 -0.155 -0.011 -0.024 -0.031 0.128 0.012 0.085 -0.001 0.016 0.006 0.079 9 -0.015 0.012 -0.015 -0.112 0.024 -0.071 0.319 -0.251 1 0.016 0.161 -0.048 0.022 -0.050 -0.542 0.047 -0.001 -0.265 -0.093 10 -0.113 -0.229 -0.080 -0.078 0.205 0.044 0.074 -0.016 -0.018 1 0.005 0.015 -0.005 0.002 -0.001 -0.022 -0.003 0.010 -0.003 11 0.011 0.054 0.064 -0.023 0.050 0.029 0.045 -0.037 0.395 -0.038 1 0.065 0.020 -0.039 -0.134 -0.000 0.018 -0.046 0.002 12 -0.072 -0.109 -0.120 -0.042 -0.021 0.095 0.021 -0.069 -0.013 0.155 0.026 1 -0.043 -0.040 0.106 -0.034 -0.008 0.100 0.040 13 0.459 0.437 0.405 0.213 0.160 -0.042 -0.063 0.132 0.055 -0.062 0.081 -0.032 1 0.064 -0.059 0.204 0.072 -0.036 0.072 14 0.146 0.166 0.167 0.101 0.156 0.152 0.042 0.043 -0.067 -0.059 -0.050 -0.044 0.042 1 -0.015 0.041 0.016 -0.013 -0.025 15 -0.065 -0.122 -0.061 -0.012 0.045 0.008 -0.112 0.079 -0.568 0.269 -0.282 0.103 -0.071 -0.015 1 -0.067 0.001 0.190 0.105 16 0.384 0.258 0.276 0.163 0.087 0.035 -0.013 0.008 0.055 -0.067 0.023 -0.027 0.225 0.041 -0.067 1 0.005 -0.090 -0.099 17 0.084 0.085 0.086 0.049 0.088 0.019 -0.022 0.028 -0.007 0.011 -0.001 -0.001 0.058 0.016 0.001 0.005 1 -0.002 0.244 18 -0.082 -0.116 -0.065 -0.015 -0.011 -0.004 -0.006 0.004 -0.110 0.124 -0.076 0.058 -0.040 -0.013 0.190 -0.090 -0.002 1 0.190 19 0.061 0.038 0.043 0.055 0.003 -0.044 -0.076 0.068 -0.085 0.083 -0.059 0.024 0.055 -0.025 0.011 -0.099 0.244 0.190 1 Numbers in bold indicate significance at the 1% level. Pearson product-moment correlation coefficient and Spearman’s rank correlation coefficient are respectively reported in the upper and lower diagonals. Numbers of variables represented are as follows: 1. LNAF, 2. LNAST, 3. LNsubs, 4. LNseg, 5. Overseas, 6. INVREC, 7. Quick, 8. DA, 9. ROA, 10. ROAVAR, 11. Growth, 12. ABSPADA, 13. LNonAF, 14. YE, 15. Loss, 16. Big3, 17. PolicyChange, 18. GC, and 19. AuditOpinion.
25
Table 4 - The association between audit fees and management earnings forecasts
MEF1 MEF2 MEF3 MEF4 MEF5
MEF 0.0088 (0.53) 0.1356* (1.77) -0.0069 (-0.61) 0.6688*** (3.52) 0.8005*** (4.01) LNAST 0.2911*** (15.94) 0.2912*** (15.93) 0.2910** (15.98) 0.2934*** (16.05) 0.2938*** (16.16) LNSubs 0.1225*** (5.70) 0.1226*** (5.71) 0.1227 (5.70) 0.1221*** (5.70) 0.1219*** (5.72) LNSeg 0.0276** (2.35) 0.0276** (2.36) 0.0276** (2.36) 0.0276** (2.35) 0.0275** (2.37) Overseas -0.4978 (-0.65) -0.0487 (-0.63) -0.0470 (-0.61) -0.0578 (-0.74) -0.0580 (-0.74) INVREC 0.0553 (0.87) 0.0559 (0.87) 0.0570 (0.89) 0.0673 (1.05) 0.0697 (1.10) QUICK -0.0082 (-1.09) -0.0083 (-1.10) -0.0083 (0.89) -0.0084 (-1.11) -0.0086 (-1.12) DA 0.0148 (0.09) 0.0612 (0.03) 0.0157 (0.09) 0.0279 (0.16) 0.0300 (0.18) ROA -0.0093 (-0.06) 0.0054 (0.03) -0.0175 (-0.10) 0.1374 (0.97) 0.1061 (0.66) ROAVAR 0.0121*** (3.43) 0.0120*** (3.40) 0.0122*** (3.45) 0.0116*** (3.57) 0.0118*** (3.63) Growth -0.0465*** (2.89) -0.0452*** (-2.86) -0.0468*** (-2.93) -0.0463*** (-2.91) -0.0459*** (-2.91) ABSPATA 0.3293** (2.40) 0.3312** (2.40) 0.3299** (2.39) 0.2292* (1.72) 0.2022 (1.58) LNNAF 0.1233*** (9.04) 0.1231*** (9.07) 0.1232*** (9.09) 0.1225*** (9.03) 0.1222*** (8.98) YE -0.0221** (-1.71) -0.0218* (-1.68) -0.0216* (-1.66) -0.0210 (-1.56) -0.0201 (-1.53) Loss 0.0701** (2.30) 0.0665** (2.17) 0.07355** (2.29) 0.0596* (1.94) 0.0530 (1.62) Big 3 0.1415*** (8.02) 0.1416*** (8.04) 0.1416*** (8.08) 0.1415*** (7.91) 0.1417*** (7.94) Policy Change 0.0025 (0.15) 0.0026 (0.16) 0.0028 (0.17) 0.0024 (0.15) 0.0019 (0.12) Going Concern 0.1096 (1.31) 0.1110 (1.33) 0.1084 (1.30) 0.0770 (1.01) 0.0693 (0.12) Audit Opinion 0.0730*** (4.44) 0.0731*** (4.45) 0.0734*** (4.45) 0.0723*** (4.47) 0.0709 (4.37) Intercept 0.1245 (0.57) 0.1247 (0.58) 0.1325 (0.62) 0.0963 (0.45) 0.0914 (0.43) F-statistics (p-value) 203.02 (0.00) 203.12 (0.00) 205.83 (0.00) 205.34 (0.00) 204.84 (0.00) Adjusted R2 0.7822 0.7823 0.7822 0.7829 0.7831
*, **, and *** indicate variable significant at 10%, 5%, and 1% level respectively. The dependent variable is natural logarithm of audit fees. The t-statistics reported in the parenthesis are calculated from standard error clustered at both industry and firm. All VIF (Variance Inflation Factor) are less than 5 in the analysis.
26
Table 5 - The association between audit fees and management earnings forecasts
MEF1*MEF4 MEF2*MEF4 MEF3*MEF4
MEF 0.6700*** (3.52) 0.6779** (2.02) 0.6828*** (3.69) LNAST 0.2933*** (16.06) 0.2925*** (16.07) 0.2934*** (16.10) LNSubs 0.1221*** (5.70) 0.1225*** (5.73) 0.1219*** (5.69) LNSeg 0.0276*** (2.35) 0.0282** (2.44) 0.0275*** (2.37) Overseas -0.0579 (-0.74) -0.0541 (-0.69) -0.0573 (-0.73) INVREC 0.0673 (1.05) 0.0667 (1.07) 0.0659 (1.02) QUICK -0.0084 (-1.10) -0.0087 (-1.16) 0.0082 (-1.07) DA 0.2814 (0.17) 0.0307 (0.18) 0.0267 (0.16) ROA 0.1385 (0.98) 0.2362 (1.12) 0.1038 (0.62) ROAVAR 0.0116*** (3.56) 0.0117*** (3.36) 0.0118*** (3.54) Growth -0.0463*** (-2.92) -0.0465*** (-2.86) -0.0459*** (-2.90) ABSPATA 0.2299* (1.72) 0.2616** (2.00) 0.2264* (1.73) LNNAF 0.1225*** (9.03) 0.1222*** (8.01) 0.1225*** (9.04) YE -0.0210 (-1.57) -0.0199 (-1.53) -0.0210 (-1.56) Loss 0.0597* (1.94) 0.0644** (2.00) 0.0568* (1.79) Big 3 0.1415*** (7.91) 0.1412*** (8.01) 0.1417*** (7.94) Policy Change 0.0023 (0.14) 0.0023 (0.14) 0.0020 (0.12) Going Concern 0.0770 (1.00) 0.0894 (1.12) 0.0772 (0.97) Audit Opinion 0.0723*** (4.47) 0.0730*** (4.49) 0.0716*** (4.45) Intercept 0.0964 (0.46) 0.1025 (0.49) 0.0972 (0.46) F-statistics (p-value) 205.37 (0.00) 204.30 (0.00) 204.20 (0.00) Adjusted R2 0.7829 0.7826 0.7826
*, **, and *** indicate variable significant at 10%, 5%, and 1% level respectively. The dependent variable is natural logarithm of audit fees. The t-statistics reported in the parenthesis are calculated from standard error clustered at both industry and firm. All VIF (Variance Inflation Factor) are less than 5 in the analysis.
27
Table 6 - The association between audit fees and management earnings forecasts
MEF1*MEF5 MEF2*MEF5 MEF3*MEF5
MEF 0.6828*** (3.69) 0.6228* (1.80) 0.4651*** (2.57) LNAST 0.2934*** (16.10) 0.2923*** (16.01) 0.2920*** (15.94) LNSubs 0.1219*** (5.69) 0.1224*** (5.71) 0.1222*** (6.69) LNSeg 0.0276** (2.37) 0.0280** (2.44) 0.0277** (2.38) Overseas -0.0573 (-0.73) -0.0532 (-0.68) -0.0531 (-0.68) INVREC 0.0659 (1.02) 0.0647 (1.03) 0.0614 (0.95) QUICK -0.0082 (-1.07) -0.0085 (-1.13) -0.0083 (-1.09) DA 0.0267 (0.16) 0.0269 (0.16) 0.0199 (0.12) ROA 0.1038 (0.62) 0.1778 (0.75) 0.0581 (0.36) ROAVAR 0.0118*** (3.54) 0.0119*** (3.34) 0.0120*** (3.55) Growth -0.0459*** (-2.90) -0.0461*** (-2.86) -0.0459*** (-2.91) ABSPATA 0.2264* (1.73) 0.2659** (2.08) 0.2714** (1.99) LNNAF 0.1225*** (9.04) 0.1224*** (9.02) 0.1228 (9.06) YE -0.0210 (-1.56) -0.0202 (-1.55) -0.0217 (1.64) Loss 0.0568* (1.79) 0.0623* (1.90) 0.0639** (2.03) Big 3 0.1417*** (7.94) 0.1414*** (8.00 0.1420*** (7.97) Policy Change 0.0020 (0.12) 0.0023 (0.14) 0.0023 (0.14) Going Concern 0.0772 (0.97) 0.0913 (1.08) 0.0936 (1.17) Audit Opinion 0.0716*** (4.45) 0.0725*** (4.49) 0.0724*** (4.44) Intercept 0.0972 (0.46) 0.1065 (0.50) 0.1171 (0.55) F-statistics (p-value) 204.80 (0.00) 203.88 (0.00) 204.05 (0.00) Adjusted R2 0.7828 0.7825 0.7825
*, **, and *** indicate variable significant at 10%, 5%, and 1% level respectively. The dependent variable is natural logarithm of audit fees. The t-statistics reported in the parenthesis are calculated from standard error clustered at both industry and firm. All VIF (Variance Inflation Factor) are less than 5 in the analysis.
科技部補助計畫衍生研發成果推廣資料表
日期:2016/02/04科技部補助計畫
計畫名稱: 強制性管理階層財務預測與審計公費的關連 計畫主持人: 潘健民 計畫編號: 103-2410-H-004-206- 學門領域: 會計無研發成果推廣資料
103年度專題研究計畫研究成果彙整表
計畫主持人:潘健民 計畫編號: 103-2410-H-004-206-計畫名稱:強制性管理階層財務預測與審計公費的關連 成果項目 量化 單位 備註(質化說明 :如數個計畫共 同成果、成果列 為該期刊之封面 故事...等) 實際已達成 數(被接受 或已發表) 預期總達成 數(含實際 已達成數) 本計畫實 際貢獻百 分比 國內 論文著作 期刊論文 0 0 100% 篇 研究報告/技術報告 0 0 100% 研討會論文 0 0 100% 專書 0 0 100% 章/本 專利 申請中件數 0 0 100% 件 已獲得件數 0 0 100% 技術移轉 件數 0 0 100% 件 權利金 0 0 100% 千元 參與計畫人力 (本國籍) 碩士生 4 4 100% 人次 博士生 0 0 100% 博士後研究員 0 0 100% 專任助理 0 0 100% 國外 論文著作 期刊論文 0 0 100% 篇 研究報告/技術報告 0 0 100% 研討會論文 0 0 100% 專書 0 0 100% 章/本 專利 申請中件數 0 0 100% 件 已獲得件數 0 0 100% 技術移轉 件數 0 0 100% 件 權利金 0 0 100% 千元 參與計畫人力 (外國籍) 碩士生 0 0 100% 人次 博士生 0 0 100% 博士後研究員 0 0 100% 專任助理 0 0 100% 其他成果 (無法以量化表達之 成果如辦理學術活動 、獲得獎項、重要國 際合作、研究成果國 際影響力及其他協助 產業技術發展之具體 效益事項等,請以文 字敘述填列。) 無成果項目 量化 名稱或內容性質簡述 科 教 處 計 畫 加 填 項 目 測驗工具(含質性與量性) 0 課程/模組 0 電腦及網路系統或工具 0 教材 0 舉辦之活動/競賽 0 研討會/工作坊 0 電子報、網站 0 計畫成果推廣之參與(閱聽)人數 0